Drip Irrigation Market

Drip Irrigation Market Report by Component (Emitters/Drippers, Drip Tubes/Drip Mainlines, Filters & Fertilizer Injectors, Fittings & Accessories, Pressure Pumps And Valves), Crop Type, Application, Emitter/Dripper Type, & Region - Global Forecast to 2029

Report Code: AGI 3730 Jun, 2024, by marketsandmarkets.com

[311 Pages Report] According to MarketsandMarkets, the drip irrigation market is projected to reach USD 8.6 billion by 2029 from USD 5.6 billion by 2024, at a CAGR of 9.0% during the forecast period in terms of value. Farmers are recognizing the long-term economic advantages of drip irrigation, including lower water and labor costs and improved crop productivity. With growing concerns over water scarcity, drip irrigation is favored for its efficiency in minimizing water use compared to traditional irrigation methods. Technological advancements, such as anti-clogging emitters and automated systems, enhance the efficiency and reliability of drip irrigation, attracting more farmers. Government incentives and subsidies for water conservation practices also boost market growth. Additionally, the expanding awareness of sustainable farming practices and the need to address climate change impacts create significant opportunities for the adoption of drip irrigation systems worldwide.

Drip Irrigation Market

To know about the assumptions considered for the study, Request for Free Sample Report

Drip Irrigation Market Opportunities

To know about the assumptions considered for the study, download the pdf brochure

Market Dynamics

Driver: Economic benefits

Drip irrigation systems offer significant economic benefits by maximizing water efficiency through precise delivery to plant roots, reducing water bills and conserving resources. They also lower labor costs by minimizing the need for manual irrigation management, allowing farmers to allocate resources more effectively. Moreover, drip irrigation systems optimize fertilizer and pesticide use by delivering these inputs directly to the root zone, thereby reducing wastage and environmental impact while enhancing crop yields and quality. Additionally, these systems save energy by requiring less pumping compared to traditional methods, resulting in lower operational costs and reduced carbon footprint. Overall, drip irrigation contributes to improved farm profitability through enhanced efficiency and sustainability practices.

Restraint : High Initial Cost

The high initial cost of drip irrigation systems poses a substantial barrier to adoption, particularly for smallholder farmers and those operating on limited budgets. The upfront investment encompasses various components such as emitters, filters, pipes, controllers, and possibly additional infrastructure like pumps and water storage tanks. These costs can be prohibitive for farmers who may already face financial constraints or lack access to credit facilities. Moreover, the need for specialized knowledge and expertise in system design and installation adds to the initial investment, as farmers may require professional assistance to ensure proper setup and functionality.

Opportunity : Integration with precision agriculture

Integration of drip irrigation with precision agriculture technologies represents a significant opportunity for farmers to enhance efficiency and productivity. By deploying sensors embedded in the soil or on plants, farmers can monitor crucial factors such as soil moisture levels, nutrient content, and temperature in real-time. Automated controllers linked to these sensors enable precise control over irrigation schedules and water application rates based on actual crop needs and environmental conditions. This targeted approach not only optimizes water and nutrient use but also reduces the risk of over-irrigation or under-irrigation, which can adversely affect crop health and yield.

Challenge: Clogging Issue

Clogging remains a significant challenge for drip irrigation systems, especially in areas with poor water quality or where sediment and organic matter are prevalent. These substances can accumulate in the pipes, emitters, and filters of the system, reducing water flow and compromising the uniformity of water distribution to plants. The accumulation of particles can lead to partial or complete blockages in emitters, affecting the system's efficiency and necessitating regular maintenance.

Drip Irrigation Market Ecosystem

Key players within this market consist of reputable and financially robust drip irrigation manufacturers. These entities boast extensive industry tenure, offering diversified product portfolios, advanced technologies, and robust global sales and marketing networks. Prominent companies in this market include Rivulis (Isarel), The Toro Company (US), Jain Irrigation Systems Ltd. (India), HUNTERS INDUSTRIES INC. (US), NETAFIM (Isarel), Mahindra EPC Irrigation Limited  (India), Rain Bird Corporation (US), Chinadrip Irrigation Equipment (Xiamen) Co., Ltd.  (China), Elgo Irrigation Ltd. (Isarel), Shanghai Irrist Corp., Ltd. (China), Antelco (Australia), Microjet Irrigation Systems (South Africa), metzer (Isarel), Grupo Chamartin S.A. (Spain), and Azud (Spain).

Top Companies in Drip Irrigation Market

In crop type segment, field crops to hold largest market share in the global drip irrigation market.

Field crops constitute the largest share in the drip irrigation market for several reasons. Firstly, field crops such as maize, soybeans, wheat, and cotton cover vast areas of agricultural land globally, requiring efficient water management practices to optimize yields and conserve water resources. Drip irrigation systems offer precise control over water and nutrient delivery, which is critical for enhancing crop productivity and quality in large-scale farming operations. Secondly, the economic viability of drip irrigation systems is particularly beneficial for field crops due to their high water requirements and the potential for significant savings in water and labor costs compared to traditional irrigation methods.

By application, surface application to hold largest market share in the drip irrigation market.  

Surface application holds the largest market share in the drip irrigation market due to its ease of installation and maintenance, cost-effectiveness, and versatility. These systems are simpler and cheaper to set up and maintain compared to subsurface systems, making them accessible to a wide range of farmers. They can be easily integrated into existing fields without significant modifications, offering flexibility for various crops and field conditions. Additionally, surface drip irrigation provides efficient water management by delivering water directly to plant roots, reducing wastage through evaporation and runoff.

By dripper/emitter type, inline emitter to grow at highest rate in the given forecast period.

Inline emitters are experiencing rapid growth in the drip irrigation market due to their ability to provide uniform water distribution, reduce clogging, and simplify installation and maintenance. Their integrated design ensures consistent spacing and water delivery, optimizing plant growth and yields while minimizing labor and maintenance costs. Cost efficiency is further enhanced by reduced clogging and maintenance needs. Additionally, inline emitters' versatility makes them suitable for various applications, including row crops, orchards, vineyards, and greenhouses.

In component type, fittings & accessories to grow at consistent rate in the given forecast period.

Drip fittings and accessories are growing at a consistent rate in the drip irrigation market due to their essential role in ensuring the flexibility, efficiency, and reliability of irrigation systems. These components are crucial for customizing and expanding drip irrigation setups to meet specific agricultural needs. The increasing adoption of drip irrigation systems worldwide drives demand for high-quality fittings and accessories that can enhance system performance and longevity. Technological advancements have led to the development of more durable and easy-to-install fittings, reducing maintenance efforts and costs. 

Asia Pacific to dominate the drip irrigation market during the forecast period.   

Asia Pacific dominates the drip irrigation market due to a combination of factors including the region's large agricultural base, increasing awareness of water scarcity, and strong government support for sustainable farming practices. Countries like China and India, with their vast agricultural landscapes and significant population-dependent on farming, are driving the adoption of efficient irrigation methods to boost crop yields and ensure food security. Government initiatives and subsidies aimed at promoting water conservation and modern irrigation technologies have further accelerated the adoption of drip irrigation systems. Additionally, the presence of a large number of smallholder farms and the need to maximize productivity on limited land resources make drip irrigation an attractive solution.

North American Drip Irrigation Market Size, and Share

Key Market Players 

The key players in this market include Rivulis (Isarel), The Toro Company (US), Jain Irrigation Systems Ltd. (India), HUNTERS INDUSTRIES INC. (US), NETAFIM (Isarel), Mahindra EPC Irrigation Limited (India), Rain Bird Corporation (US), Chinadrip Irrigation Equipment (Xiamen) Co., Ltd. (China), Elgo Irrigation Ltd. (Isarel), Shanghai Irrist Corp., Ltd. (China), Antelco (Australia), Microjet Irrigation Systems (South Africa), metzer (Isarel), Grupo Chamartin S.A. (Spain), and Azud (Spain). These market participants are emphasizing the expansion of their footprint via agreements and partnerships. They maintain a robust presence in North America, Asia Pacific, South America, RoW, and Europe, and they are supported by manufacturing facilities and well-established distribution networks spanning these regions.  

Get online access to the report on the World's First Market Intelligence Cloud

  • Easy to Download Historical Data & Forecast Numbers
  • Company Analysis Dashboard for high growth potential opportunities
  • Research Analyst Access for customization & queries
  • Competitor Analysis with Interactive dashboard
  • Latest News, Updates & Trend analysis
Request Sample

Scope of the Report

Report Metric

Details

Market size estimation

2024–2029

Base year considered

2023

Forecast period considered

2024–2029

Units considered

Value (USD Million)

Segments Covered

By Component Type, Crop Type, Application, Emitter/Dripper Type, and Region

Regions covered

North America, Europe, South America, Asia Pacific, and RoW

Companies studied

  • NETAFIM (Isarel)
  •  Rivulis (Isarel)
  • The Toro Company (US)
  • Jain Irrigation Systems Ltd. (India)
  • HUNTERS INDUSTRIES INC. (US)
  • Mahindra EPC Irrigation Limited  (India)
  • Rain Bird Corporation (US)
  • Chinadrip Irrigation Equipment (Xiamen) Co., Ltd.  (China)
  •  Elgo Irrigation Ltd. (Isarel)
  • Shanghai Irrist Corp., Ltd. (China)
  •  Antelco (Australia)
  • Microjet Irrigation Systems (South Africa)
  • metzer (Isarel)
  • Grupo Chamartin S.A. (Spain)
  • Azud (Spain)
  • DripWorks (US)
  • Irritec S.p.A  (Italy)
  • National Diversified Sales, Inc. (US)
  • Irrigation Direct Canada  (US)
  • Global Irrigation, Inc. (US)
  • KSNM DRIP  (India)
  • Agrodrip   (Greece)
  • Goldenkey (United Arab Emirates)
  • Sujay Irrigations Pvt. Ltd. (India)
  • Bharat Drip Irrigation and Agro (India)

This research report categorizes the drip irrigation market based on component type, crop type, application, emitter/dripper type, and region.

Target Audience

  • Drip Irrigation traders, retailers, and distributors
  • Drip Irrigation manufacturers & suppliers
  • Related government authorities, commercial research & development (R&D) institutions.
  • Regulatory bodies, including government agencies and NGOs.
  • Commercial research & development (R&D) institutions and financial institutions.
  • Government and research organizations.
  • Venture capitalists and investors.
  • Technology providers to drip irrigation companies.
  • Associations and industry bodies. 

Drip Irrigation Market:

By Component Type
  • Drip Mainlines/Drip Tubes
  • Filters & Fertilizer Injectors
  • Fittings & Accessories
  • Emitters/Drippers
  • Pressure Pumps
  • Valves
By Crop Type
  • Field Crops
  • Fruits & Nuts
  • Vegetable Crops
  • Other Crops
By Application
  • Surface
  • Subsurface
By Emitter/Dripper Type
  • Inline
  • Online
By Region:
  • North America
  • Europe
  • Asia Pacific
  • South America
  • Rest of the World (RoW)

Recent Developments

  • In September 2023, Rivulis and Dragon-Line, leaders in micro-irrigation and mobile drip irrigation pivots respectively, announced an exclusive partnership in the US, Mexico, and Canada. Dragon-Line will launch a new Mobile Drip Irrigation System utilizing a newly developed Rivulis drip line product through this collaboration. This partnership will enhance Rivulis' field presence, boost engineering resources, and expand production capacity, enabling the company to swiftly meet market demands with innovative solutions.
  • In March 2023, Jain International Trading B.V. (JITBV), a wholly owned subsidiary of Jain Irrigation, merged with Rivulis. The newly formed entity, branded as "Rivulis in alliance with Jain International" ("MergeCo"), will become a global leader in irrigation and climate solutions, ranking as the second-largest in the world with approximately USD 750 million in revenues. MergeCo will continue to use and promote prominent JAIN brands in markets where they have significant presence and value. 
  • In February 2023, The Toro Company launched the 900 Series Valve that features an innovative, patent-pending valve seat design, providing growers with a highly efficient and reliable solution for irrigation system control. This versatile valve also offers designers flexible sizing options, making it suitable for a wide range of applications.

Frequently Asked Questions (FAQ):

To speak to our analyst for a discussion on the above findings, click Speak to Analyst

TABLE OF CONTENTS
 
1 INTRODUCTION (Page No. - 28)
    1.1 STUDY OBJECTIVES 
    1.2 MARKET DEFINITION 
    1.3 MARKET SCOPE 
           1.3.1 MARKET SEGMENTATION
                    FIGURE 1 DRIP IRRIGATION MARKET SEGMENTATION
           1.3.2 INCLUSIONS & EXCLUSIONS
                    TABLE 1 DRIP IRRIGATION MARKET: INCLUSIONS & EXCLUSIONS
           1.3.3 REGIONS COVERED
           1.3.4 YEARS CONSIDERED
    1.4 UNIT CONSIDERED 
           1.4.1 CURRENCY
                    TABLE 2 USD EXCHANGE RATES CONSIDERED, 2019–2023
    1.5 STAKEHOLDERS 
    1.6 SUMMARY OF CHANGES 
           1.6.1 IMPACT OF RECESSION
 
2 RESEARCH METHODOLOGY (Page No. - 34)
    2.1 RESEARCH DATA 
           FIGURE 2 DRIP IRRIGATION MARKET: RESEARCH DESIGN
           2.1.1 SECONDARY DATA
                    2.1.1.1 Key data from secondary sources
           2.1.2 PRIMARY DATA
                    2.1.2.1 Key data from primary sources
                               FIGURE 3 KEY DATA FROM PRIMARY SOURCES
                    2.1.2.2 Key industry insights
                    2.1.2.3 Breakdown of primaries
    2.2 MARKET SIZE ESTIMATION 
           2.2.1 BOTTOM-UP APPROACH
                    FIGURE 4 DRIP IRRIGATION MARKET: DEMAND-SIDE CALCULATION
           2.2.2 TOP-DOWN APPROACH
                    2.2.2.1 Approach to estimate market size using top-down analysis
                               FIGURE 5 DRIP IRRIGATION MARKET SIZE ESTIMATION STEPS AND RESPECTIVE SOURCES: SUPPLY SIDE
    2.3 DATA TRIANGULATION 
           FIGURE 6 DATA TRIANGULATION METHODOLOGY
    2.4 RESEARCH ASSUMPTIONS 
    2.5 LIMITATIONS AND RISK ASSESSMENT 
    2.6 RECESSION IMPACT ON DRIP IRRIGATION MARKET 
           2.6.1 RECESSION MACRO INDICATORS
                    FIGURE 7 INDICATORS OF RECESSION
                    FIGURE 8 GLOBAL INFLATION RATE, 2011–2022
                    FIGURE 9 GLOBAL GDP, 2011–2022 (USD TRILLION)
                    FIGURE 10 RECESSION INDICATORS AND THEIR IMPACT ON DRIP IRRIGATION MARKET
                    FIGURE 11 DRIP IRRIGATION MARKET: EARLIER FORECAST VS. RECESSION FORECAST
 
3 EXECUTIVE SUMMARY (Page No. - 47)
    TABLE 3 DRIP IRRIGATION MARKET SNAPSHOT, 2024 VS. 2029 
    FIGURE 12 DRIP IRRIGATION MARKET, BY COMPONENT, 2024 VS. 2029 (USD MILLION) 
    FIGURE 13 DRIP IRRIGATION MARKET, BY CROP TYPE, 2024 VS. 2029 (USD MILLION) 
    FIGURE 14 DRIP IRRIGATION MARKET, BY EMITTER/DRIPPER TYPE, 2024 VS. 2029 (USD MILLION) 
    FIGURE 15 DRIP IRRIGATION MARKET, BY APPLICATION, 2024 VS. 2029 (USD MILLION) 
    FIGURE 16 DRIP IRRIGATION MARKET SHARE (2023) AND CAGR (2024–2029), BY REGION 
 
4 PREMIUM INSIGHTS (Page No. - 52)
    4.1 ATTRACTIVE MARKET OPPORTUNITIES IN DRIP IRRIGATION MARKET 
           FIGURE 17 INCREASING WATER SCARCITY, GOVERNMENT INITIATIVES, AND GROWING DEMAND FOR AGRICULTURAL PRODUCTION TO DRIVE DEMAND FOR DRIP IRRIGATION SYSTEMS
    4.2 ASIA PACIFIC: DRIP IRRIGATION MARKET, BY COMPONENT AND COUNTRY 
           FIGURE 18 DRIP MAINLINES/DRIP TUBES SEGMENT AND INDIA TO ACCOUNT FOR LARGEST SHARES IN ASIA PACIFIC DRIP IRRIGATION MARKET IN 2024
    4.3 DRIP IRRIGATION MARKET: SHARE OF MAJOR REGIONAL SUBMARKETS 
           FIGURE 19 INDIA TO ACCOUNT FOR LARGEST SHARE (BY VALUE) IN 2024
    4.4 DRIP IRRIGATION MARKET, BY COMPONENT AND REGION 
           FIGURE 20 DRIP MAINLINES/DRIP TUBES SEGMENT TO OCCUPY LARGEST MARKET SHARE DURING FORECAST PERIOD
    4.5 DRIP IRRIGATION MARKET, BY CROP TYPE AND REGION 
           FIGURE 21 FIELD CROPS SEGMENT TO DOMINATE MARKET DURING FORECAST PERIOD
    4.6 DRIP IRRIGATION MARKET, BY EMITTER/DRIPPER TYPE AND REGION 
           FIGURE 22 INLINE TO ACCOUNT FOR LARGEST MARKET SHARE DURING FORECAST PERIOD
    4.7 DRIP IRRIGATION MARKET, BY APPLICATION AND REGION 
           FIGURE 23 SURFACE APPLICATION TO ACCOUNT FOR LARGER MARKET SHARE DURING FORECAST PERIOD
 
5 MARKET OVERVIEW (Page No. - 59)
    5.1 INTRODUCTION 
           FIGURE 24 GLOBAL FRESHWATER WITHDRAWALS, 2020
    5.2 MACROECONOMIC INDICATORS 
           5.2.1 INCREASING POPULATION DENSITY
                    TABLE 4 POPULATION DENSITY, BY COUNTRY, 2019–2027 (PEOPLE PER SQUARE KILOMETER)
                    FIGURE 25 POPULATION PROJECTION: TOP 10 POPULOUS COUNTRIES, 2050 VS. 2075 (THOUSANDS)
           5.2.2 CLIMATE CHANGE
    5.3 MARKET DYNAMICS 
           FIGURE 26 MARKET DYNAMICS: DRIP IRRIGATION MARKET
           5.3.1 DRIVERS
                    5.3.1.1 Government programs and subsidies driving acceptance of drip irrigation systems
                    5.3.1.2 Efficiency in water use in drought-prone areas
                               TABLE 5 WATER REQUIREMENT, BY CROP: DRIP IRRIGATION VS. CONVENTIONAL IRRIGATION
                    5.3.1.3 Cost efficiency in agricultural production
                    5.3.1.4 Enhanced crop yields
                               TABLE 6 INCREASE IN YIELD: DRIP IRRIGATION VS. SURFACE IRRIGATION
           5.3.2 RESTRAINTS
                    5.3.2.1 High initial cost of large-scale drip irrigation systems
                    5.3.2.2 High cost of system maintenance
           5.3.3 OPPORTUNITIES
                    5.3.3.1 Increasing adoption of precision agriculture and sustainable practices
                    5.3.3.2 Advancements in technological capabilities of drip irrigation systems
           5.3.4 CHALLENGES
                    5.3.4.1 Environmental degradation of equipment resulting in additional costs for clean-up and disposal
                    5.3.4.2 Soil salinity hazards and bioclogging in drip irrigation systems
 
6 INDUSTRY TRENDS (Page No. - 70)
    6.1 INTRODUCTION 
    6.2 TRENDS/DISRUPTIONS IMPACTING CUSTOMERS’ BUSINESSES 
           FIGURE 27 DRIP IRRIGATION MARKET: TRENDS/DISRUPTING IMPACTING CUSTOMERS’ BUSINESSES
    6.3 VALUE CHAIN ANALYSIS 
           FIGURE 28 DRIP IRRIGATION MARKET: VALUE CHAIN ANALYSIS
           6.3.1 RESEARCH & DEVELOPMENT
           6.3.2 RAW MATERIALS & MANUFACTURING
           6.3.3 MARKETING & SALES
           6.3.4 ASSEMBLY & INSTALLATION
           6.3.5 FEEDBACK
    6.4 ECOSYSTEM ANALYSIS/MARKET MAP 
           6.4.1 DEMAND SIDE
           6.4.2 SUPPLY SIDE
                    FIGURE 29 KEY STAKEHOLDERS IN DRIP IRRIGATION MARKET ECOSYSTEM
                    TABLE 7 DRIP IRRIGATION MARKET: ECOSYSTEM
    6.5 TECHNOLOGY ANALYSIS 
           6.5.1 KEY TECHNOLOGIES
                    6.5.1.1 AUTOMATED IRRIGATION SYSTEMS
                    6.5.1.2 PRESSURE-COMPENSATING EMITTERS
           6.5.2 COMPLEMENTARY TECHNOLOGIES
                    6.5.2.1 SOIL MOISTURE SENSORS
           6.5.3 ADJACENT TECHNOLOGIES
                    6.5.3.1 FERTIGATION SYSTEMS
    6.6 PRICING ANALYSIS 
           6.6.1 AVERAGE SELLING PRICE TREND OF KEY PLAYERS, BY CROP TYPE
                    FIGURE 30 AVERAGE SELLING PRICE TREND OF KEY PLAYERS, BY CROP TYPE, 2023
                    TABLE 8 AVERAGE SELLING PRICE (ASP) TREND OF KEY PLAYERS, BY CROP TYPE, 2023 (USD/HECTARE)
                    FIGURE 31 AVERAGE SELLING PRICE TREND, BY CROP TYPE, 2019–2023 (USD/HECTARE)
                    TABLE 9 AVERAGE SELLING PRICE (ASP) TREND OF DRIP IRRIGATION SYSTEMS, BY CROP TYPE, 2019–2023 (USD/HECTARE)
                    FIGURE 32 FIELD CROPS: AVERAGE SELLING PRICE TREND, BY REGION
           6.6.2 AVERAGE SELLING PRICE TREND OF CROP TYPE, BY REGION
                    TABLE 10 FIELD CROPS: AVERAGE SELLING PRICE (ASP) TREND, BY REGION, 2019–2023 (USD/HECTARE)
                    FIGURE 33 FRUITS & NUTS: AVERAGE SELLING PRICE TREND, BY REGION
                    TABLE 11 FRUITS & NUTS: AVERAGE SELLING PRICE (ASP) TREND, BY REGION, 2019–2023 (USD/HECTARE)
                    FIGURE 34 VEGETABLE CROPS: AVERAGE SELLING PRICE TREND, BY REGION
                    TABLE 12 VEGETABLE CROPS: AVERAGE SELLING PRICE (ASP) TREND, BY REGION, 2019–2023 (USD/HECTARE)
                    FIGURE 35 OTHER CROPS: AVERAGE SELLING PRICE TREND, BY REGION
                    TABLE 13 OTHER CROPS: AVERAGE SELLING PRICE (ASP) TREND, BY REGION, 2019–2023 (USD/HECTARE)
    6.7 PATENT ANALYSIS 
           FIGURE 36 PATENTS GRANTED FOR DRIP IRRIGATION MARKET, 2014–2024
           FIGURE 37 REGIONAL ANALYSIS OF PATENTS GRANTED FOR DRIP IRRIGATION MARKET, 2014–2024
           TABLE 14 KEY PATENTS PERTAINING TO DRIP IRRIGATION, 2014–2024
    6.8 CASE STUDY ANALYSIS 
           6.8.1 INNOVATIVE IRRIGATION REFORM IN YUANMOU COUNTY
           6.8.2 OPTIMIZING DRIP IRRIGATION FOR ROCK MELON IN TROPICAL RAIN HOUSE SHELTERS
           6.8.3 ENHANCING RED RASPBERRY YIELDS WITH PULSE DRIP IRRIGATION
    6.9 TRADE ANALYSIS 
           6.9.1 EXPORT SCENARIO OF HS CODE 842482
                    FIGURE 38 EXPORT VALUE OF HS CODE 842482: KEY COUNTRIES, 2018–2022 (USD THOUSAND)
                    TABLE 15 EXPORT VALUE OF HS CODE 842482, BY KEY COUNTRY, 2018–2022 (USD THOUSAND)
           6.9.2 IMPORT SCENARIO OF HS CODE 842482
                    FIGURE 39 IMPORT VALUE OF HS CODE 842482: KEY COUNTRIES, 2018–2022 (USD THOUSAND)
                    TABLE 16 IMPORT VALUE OF HS CODE 842482, BY KEY COUNTRY, 2018–2022 (USD THOUSAND)
    6.10 KEY CONFERENCES & EVENTS 
           TABLE 17 DRIP IRRIGATION MARKET: DETAILED LIST OF CONFERENCES AND EVENTS, 2024–2025
    6.11 REGULATORY LANDSCAPE 
           6.11.1 REGULATORY BODIES, GOVERNMENT AGENCIES, AND OTHER ORGANIZATIONS
                    TABLE 18 NORTH AMERICA: REGULATORY BODIES, GOVERNMENT AGENCIES, AND OTHER ORGANIZATIONS
                    TABLE 19 EUROPE: REGULATORY BODIES, GOVERNMENT AGENCIES, AND OTHER ORGANIZATIONS
                    TABLE 20 ASIA PACIFIC: REGULATORY BODIES, GOVERNMENT AGENCIES, AND OTHER ORGANIZATIONS
                    TABLE 21 SOUTH AMERICA: REGULATORY BODIES, GOVERNMENT AGENCIES, AND OTHER ORGANIZATIONS
                    TABLE 22 ROW: REGULATORY BODIES, GOVERNMENT AGENCIES, AND OTHER ORGANIZATIONS
           6.11.2 NORTH AMERICA
                    6.11.2.1 US
                    6.11.2.2 Canada
                    6.11.2.3 Mexico
           6.11.3 EUROPE
                    6.11.3.1 Spain
                    6.11.3.2 France
                    6.11.3.3 Germany
           6.11.4 ASIA PACIFIC
                    6.11.4.1 India
                    6.11.4.2 China
                    6.11.4.3 Australia
                               TABLE 23 STANDARDS CODES & PRACTICES FOR RURAL IRRIGATION SYSTEM DESIGN BY QUEENSLAND STATE GOVERNMENT
                    6.11.4.4 Bangladesh
           6.11.5 MIDDLE EAST
                    6.11.5.1 UAE
           6.11.6 AFRICA
    6.12 PORTER’S FIVE FORCES ANALYSIS 
                    TABLE 24 PORTER’S FIVE FORCES IMPACT ON DRIP IRRIGATION MARKET
                    FIGURE 40 DRIP IRRIGATION MARKET: PORTER’S FIVE FORCES ANALYSIS
           6.12.1 INTENSITY OF COMPETITIVE RIVALRY
           6.12.2 BARGAINING POWER OF SUPPLIERS
           6.12.3 BARGAINING POWER OF BUYERS
           6.12.4 THREAT OF SUBSTITUTES
           6.12.5 THREAT OF NEW ENTRANTS
    6.13 KEY STAKEHOLDERS AND BUYING CRITERIA 
           6.13.1 KEY STAKEHOLDERS IN BUYING PROCESS
                    FIGURE 41 INFLUENCE OF STAKEHOLDERS ON BUYING PROCESS FOR EMITTER/DRIPPER TYPES
                    TABLE 25 INFLUENCE OF STAKEHOLDERS ON BUYING PROCESS FOR EMITTER/DRIPPER TYPES
           6.13.2 BUYING CRITERIA
                    FIGURE 42 KEY BUYING CRITERIA FOR EMITTER/DRIPPER TYPES
                    TABLE 26 KEY BUYING CRITERIA FOR EMITTER/DRIPPER TYPES
    6.14 INVESTMENT AND FUNDING SCENARIO 
                    FIGURE 43 INVESTMENT & FUNDING SCENARIO OF FEW MAJOR PLAYERS
 
7 DRIP IRRIGATION MARKET, BY COMPONENT (Page No. - 103)
    7.1 INTRODUCTION 
           FIGURE 44 DRIP MAINLINES/DRIP TUBES TO DOMINATE OVERALL MARKET DURING FORECAST PERIOD
           TABLE 27 DRIP IRRIGATION MARKET, BY COMPONENT, 2019–2023 (USD MILLION)
           TABLE 28 DRIP IRRIGATION MARKET, BY COMPONENT, 2024–2029 (USD MILLION)
    7.2 EMITTERS/DRIPPERS 
           7.2.1 INCREASED EFFICIENCY DUE TO EMITTERS/DRIPPERS TO DRIVE DEMAND
                    TABLE 29 EMITTERS/DRIPPERS MARKET, BY REGION, 2019–2023 (USD MILLION)
                    TABLE 30 EMITTERS/DRIPPERS MARKET, BY REGION, 2024–2029 (USD MILLION)
    7.3 PRESSURE PUMPS 
           7.3.1 SOLAR PUMP TO SAVE ELECTRICITY AND INCREASE EFFICIENCY IN DRIP IRRIGATION
                    TABLE 31 PRESSURE PUMPS MARKET, BY REGION, 2019–2023 (USD MILLION)
                    TABLE 32 PRESSURE PUMPS MARKET, BY REGION, 2024–2029 (USD MILLION)
    7.4 DRIP MAINLINES/DRIP TUBES 
           7.4.1 AVAILABILITY OF INNOVATIVE MATERIALS AND EASY INSTALLATION TO AID GROWTH OF DRIP TUBES/DRIP LINES
                    TABLE 33 DRIP MAINLINES/DRIP TUBES MARKET, BY REGION, 2019–2023 (USD MILLION)
                    TABLE 34 DRIP MAINLINES/DRIP TUBES MARKET, BY REGION, 2024–2029 (USD MILLION)
    7.5 VALVES 
           7.5.1 AUTOMATION OF VALVES TO DRIVE GROWTH OF DRIP IRRIGATION MARKET
                    TABLE 35 VALVES MARKET, BY REGION, 2019–2023 (USD MILLION)
                    TABLE 36 VALVES MARKET, BY REGION, 2024–2029 (USD MILLION)
    7.6 FILTERS & FERTILIZER INJECTORS 
           7.6.1 FERTILIZER INJECTORS TO OFFER FAST AND ACCURATE WAY TO FEED PLANTS
           7.6.2 FERTILIZER INJECTORS
           7.6.3 FILTERS
                    7.6.3.1 Primary filters
                               7.6.3.1.1 Sand separators
                               7.6.3.1.2 Hydrocyclone filters
                    7.6.3.2 Secondary filters
                               7.6.3.2.1 Disc filters
                               7.6.3.2.2 Screen filters
                               TABLE 37 FILTERS & FERTILIZER INJECTORS MARKET, BY REGION, 2019–2023 (USD MILLION)
                               TABLE 38 FILTERS & FERTILIZER INJECTORS MARKET, BY REGION, 2024–2029 (USD MILLION)
    7.7 FITTINGS & ACCESSORIES 
           7.7.1 COST-EFFECTIVENESS AND HIGHER IRRIGATION SYSTEM CONTROL TO BOLSTER DEMAND IN ASIA PACIFIC
           7.7.2 WATER METERS
           7.7.3 PRESSURE GAUGES
           7.7.4 IRRIGATION CONTROLLERS
           7.7.5 JOINERS
           7.7.6 GROMMETS
           7.7.7 END CAPS
           7.7.8 OTHER FITTINGS & ACCESSORIES
                    TABLE 39 FITTINGS & ACCESSORIES MARKET, BY REGION, 2019–2023 (USD MILLION)
                    TABLE 40 FITTINGS & ACCESSORIES MARKET, BY REGION, 2024–2029 (USD MILLION)
 
8 DRIP IRRIGATION MARKET, BY EMITTER/DRIPPER TYPE (Page No. - 115)
    8.1 INTRODUCTION 
           FIGURE 45 INLINE SEGMENT TO DOMINATE DRIP IRRIGATION MARKET DURING FORECAST PERIOD
           TABLE 41 DRIP IRRIGATION MARKET, BY EMITTER TYPE, 2019–2023 (USD MILLION)
           TABLE 42 DRIP IRRIGATION MARKET, BY EMITTER TYPE, 2024–2029 (USD MILLION)
    8.2 INLINE EMITTERS 
           8.2.1 IMPROVED EFFICIENCY AND FERTIGATION COMPATIBILITY TO DRIVE DEMAND FOR INLINE EMITTERS
                    TABLE 43 INLINE EMITTERS MARKET, BY REGION, 2019–2023 (USD MILLION)
                    TABLE 44 INLINE EMITTERS MARKET, BY REGION, 2024–2029 (USD MILLION)
    8.3 ONLINE EMITTERS 
           8.3.1 INNOVATION IN ONLINE EMITTERS IN REDUCING COSTS TO DRIVE DEMAND FOR DRIP IRRIGATION
                    TABLE 45 ONLINE EMITTERS MARKET, BY REGION, 2019–2023 (USD MILLION)
                    TABLE 46 ONLINE EMITTERS MARKET, BY REGION, 2024–2029 (USD MILLION)
 
9 DRIP IRRIGATION MARKET, BY CROP TYPE (Page No. - 119)
    9.1 INTRODUCTION 
           FIGURE 46 FIELD CROPS TO DOMINATE DRIP IRRIGATION MARKET DURING FORECAST PERIOD
           TABLE 47 DRIP IRRIGATION MARKET, BY CROP TYPE, 2019–2023 (‘000 HA)
           TABLE 48 DRIP IRRIGATION MARKET, BY CROP TYPE, 2024–2029 (‘000 HA)
           TABLE 49 DRIP IRRIGATION MARKET, BY CROP TYPE, 2019–2023 (USD MILLION)
           TABLE 50 DRIP IRRIGATION MARKET, BY CROP TYPE, 2024–2029 (USD MILLION)
    9.2 FIELD CROPS 
           9.2.1 INCREASING CONCERNS OVER WATER SCARCITY TO FUEL DEMAND FOR DRIP IRRIGATION SYSTEMS
           9.2.2 CORN
           9.2.3 COTTON
           9.2.4 SUGARCANE
           9.2.5 RICE
           9.2.6 OTHER FIELD CROPS
                    TABLE 51 DRIP IRRIGATION MARKET FOR FIELD CROPS, BY REGION, 2019–2023 (‘000 HA)
                    TABLE 52 DRIP IRRIGATION MARKET FOR FIELD CROPS, BY REGION, 2024–2029 (‘000 HA)
                    TABLE 53 DRIP IRRIGATION MARKET FOR FIELD CROPS, BY REGION, 2019–2023 (USD MILLION)
                    TABLE 54 DRIP IRRIGATION MARKET FOR FIELD CROPS, BY REGION, 2024–2029 (USD MILLION)
    9.3 FRUITS & NUTS 
           9.3.1 HIGH-PROFIT MARGINS AND REDUCTION OF CROP STRESS FOR OPTIMUM GROWTH TO DRIVE ADOPTION OF DRIP IRRIGATION
           9.3.2 GRAPES
           9.3.3 APPLES
           9.3.4 PEARS
           9.3.5 WALNUTS
           9.3.6 OTHER FRUITS & NUTS
                    TABLE 55 DRIP IRRIGATION MARKET FOR FRUITS & NUTS, BY REGION, 2019–2023 (‘000 HA)
                    TABLE 56 DRIP IRRIGATION MARKET FOR FRUITS & NUTS, BY REGION, 2024–2029 (‘000 HA)
                    TABLE 57 DRIP IRRIGATION MARKET FOR FRUITS & NUTS, BY REGION, 2019–2023 (USD MILLION)
                    TABLE 58 DRIP IRRIGATION MARKET FOR FRUITS & NUTS, BY REGION, 2024–2029 (USD MILLION)
    9.4 VEGETABLE CROPS 
           9.4.1 IMPROVED YIELDS AND HIGH EFFICIENCY TO DRIVE DEMAND FOR DRIP IRRIGATION OF VEGETABLE CROPS
           9.4.2 TOMATOES
           9.4.3 CAPSICUM
           9.4.4 CHILLI
           9.4.5 CABBAGE
           9.4.6 OTHER VEGETABLE CROPS
                    TABLE 59 DRIP IRRIGATION MARKET FOR VEGETABLE CROPS, BY REGION, 2019–2023 (‘000 HA)
                    TABLE 60 DRIP IRRIGATION MARKET FOR VEGETABLE CROPS, BY REGION, 2024–2029 (‘000 HA)
                    TABLE 61 DRIP IRRIGATION MARKET FOR VEGETABLE CROPS, BY REGION, 2019–2023 (USD MILLION)
                    TABLE 62 DRIP IRRIGATION MARKET FOR VEGETABLE CROPS, BY REGION, 2024–2029 (USD MILLION)
    9.5 OTHER CROPS 
           TABLE 63 DRIP IRRIGATION MARKET FOR OTHER CROPS, BY REGION, 2019–2023 (‘000 HA)
           TABLE 64 DRIP IRRIGATION MARKET FOR OTHER CROPS, BY REGION, 2024–2029 (‘000 HA)
           TABLE 65 DRIP IRRIGATION MARKET FOR OTHER CROPS, BY REGION, 2019–2023 (USD MILLION)
           TABLE 66 DRIP IRRIGATION MARKET FOR OTHER CROPS, BY REGION, 2024–2029 (USD MILLION)
 
10 DRIP IRRIGATION MARKET, BY APPLICATION (Page No. - 133)
     10.1 INTRODUCTION 
               FIGURE 47 SURFACE APPLICATION TO DOMINATE DRIP IRRIGATION MARKET DURING FORECAST PERIOD
               TABLE 67 DRIP IRRIGATION MARKET, BY APPLICATION, 2019–2023 (USD MILLION)
               TABLE 68 DRIP IRRIGATION MARKET, BY APPLICATION, 2024–2029 (USD MILLION)
     10.2 SURFACE APPLICATION 
             10.2.1 LOW COST OF INSTALLATION AND MAINTENANCE LEADING TO INCREASING DEMAND
                       TABLE 69 SURFACE DRIP IRRIGATION MARKET, BY REGION, 2019–2023 (USD MILLION)
                       TABLE 70 SURFACE DRIP IRRIGATION MARKET, BY REGION, 2024–2029 (USD MILLION)
     10.3 SUBSURFACE APPLICATION 
             10.3.1 ADVANCEMENTS IN FERTIGATION AND INLINE EMITTER TECHNOLOGIES TO DRIVE GROWTH
                       TABLE 71 SUBSURFACE DRIP IRRIGATION MARKET, BY REGION, 2019–2023 (USD MILLION)
                       TABLE 72 SUBSURFACE DRIP IRRIGATION MARKET, BY REGION, 2024–2029 (USD MILLION)
 
11 DRIP IRRIGATION MARKET, BY REGION (Page No. - 138)
     11.1 INTRODUCTION 
               TABLE 73 DRIP IRRIGATION MARKET SIZE, BY REGION, 2019–2023 (‘000 HA)
               TABLE 74 DRIP IRRIGATION MARKET SIZE, BY REGION, 2024–2029 (‘000 HA)
               TABLE 75 DRIP IRRIGATION MARKET, BY REGION, 2019–2023 (USD MILLION)
               TABLE 76 DRIP IRRIGATION MARKET, BY REGION, 2024–2029 (USD MILLION)
               FIGURE 48 MIDDLE EAST PROJECTED TO BE FASTEST-GROWING IN DRIP IRRIGATION MARKET DURING FORECAST PERIOD
     11.2 NORTH AMERICA 
             11.2.1 RECESSION IMPACT
                       FIGURE 49 NORTH AMERICA: RECESSION IMPACT ANALYSIS, 2024
                       TABLE 77 NORTH AMERICA: DRIP IRRIGATION MARKET, BY CROP TYPE, 2019–2023 (‘000 HA)
                       TABLE 78 NORTH AMERICA: DRIP IRRIGATION MARKET, BY CROP TYPE, 2024–2029 (‘000 HA)
                       TABLE 79 NORTH AMERICA: DRIP IRRIGATION MARKET, BY COUNTRY, 2019–2023 (USD MILLION)
                       TABLE 80 NORTH AMERICA: DRIP IRRIGATION MARKET, BY COUNTRY, 2024–2029 (USD MILLION)
                       TABLE 81 NORTH AMERICA: DRIP IRRIGATION MARKET, BY CROP TYPE, 2019–2023 (USD MILLION)
                       TABLE 82 NORTH AMERICA: DRIP IRRIGATION MARKET, BY CROP TYPE, 2024–2029 (USD MILLION)
                       TABLE 83 NORTH AMERICA: DRIP IRRIGATION MARKET, BY APPLICATION, 2019–2023 (USD MILLION)
                       TABLE 84 NORTH AMERICA: DRIP IRRIGATION MARKET, BY APPLICATION, 2024–2029 (USD MILLION)
                       TABLE 85 NORTH AMERICA: DRIP IRRIGATION MARKET, BY COMPONENT, 2019–2023 (USD MILLION)
                       TABLE 86 NORTH AMERICA: DRIP IRRIGATION MARKET, BY COMPONENT, 2024–2029 (USD MILLION)
                       TABLE 87 NORTH AMERICA: DRIP IRRIGATION MARKET, BY EMITTER/DRIPPER TYPE, 2019–2023 (USD MILLION)
                       TABLE 88 NORTH AMERICA: DRIP IRRIGATION MARKET, BY EMITTER/DRIPPER TYPE, 2024–2029 (USD MILLION)
             11.2.2 US
                       11.2.2.1 Increasing adoption of drip irrigation systems on farmlands and advancement in technologies to drive adoption of drip irrigation equipment
                                   TABLE 89 US: DRIP IRRIGATION MARKET, BY CROP TYPE, 2019–2023 (USD MILLION)
                                   TABLE 90 US: DRIP IRRIGATION MARKET, BY CROP TYPE, 2024–2029 (USD MILLION)
                                   TABLE 91 US: DRIP IRRIGATION MARKET, BY CROP TYPE, 2019–2023 (‘000 HA)
                                   TABLE 92 US: DRIP IRRIGATION MARKET, BY CROP TYPE, 2024–2029 (‘000 HA)
                                   TABLE 93 US: DRIP IRRIGATION MARKET, BY COMPONENT, 2019–2023 (USD MILLION)
                                   TABLE 94 US: DRIP IRRIGATION MARKET, BY COMPONENT, 2024–2029 (USD MILLION)
             11.2.3 CANADA
                       11.2.3.1 Increasing investments in developing irrigation infrastructure to drive demand for drip irrigation systems
                                   TABLE 95 CANADA: DRIP IRRIGATION MARKET, BY CROP TYPE, 2019–2023 (USD THOUSAND)
                                   TABLE 96 CANADA: DRIP IRRIGATION MARKET, BY CROP TYPE, 2024–2029 (USD THOUSAND)
                                   TABLE 97 CANADA: DRIP IRRIGATION MARKET, BY CROP TYPE, 2019–2023 (‘000 HA)
                                   TABLE 98 CANADA: DRIP IRRIGATION MARKET, BY CROP TYPE, 2024–2029 (‘000 HA)
                                   TABLE 99 CANADA: DRIP IRRIGATION MARKET, BY COMPONENT, 2019–2023 (USD THOUSAND)
                                   TABLE 100 CANADA: DRIP IRRIGATION MARKET, BY COMPONENT, 2024–2029 (USD THOUSAND)
             11.2.4 MEXICO
                       11.2.4.1 Government policies and high-water tariffs encourage farmers to adopt drip irrigation systems
                                   TABLE 101 MEXICO: DRIP IRRIGATION MARKET, BY CROP TYPE, 2019–2023 (USD MILLION)
                                   TABLE 102 MEXICO: DRIP IRRIGATION MARKET, BY CROP TYPE, 2024–2029 (USD MILLION)
                                   TABLE 103 MEXICO: DRIP IRRIGATION MARKET, BY CROP TYPE, 2019–2023 (‘000 HA)
                                   TABLE 104 MEXICO: DRIP IRRIGATION MARKET, BY CROP TYPE, 2024–2029 (‘000 HA)
                                   TABLE 105 MEXICO: DRIP IRRIGATION MARKET, BY COMPONENT, 2019–2023 (USD MILLION)
                                   TABLE 106 MEXICO: DRIP IRRIGATION MARKET, BY COMPONENT, 2024–2029 (USD MILLION)
     11.3 EUROPE 
             11.3.1 EUROPE: RECESSION IMPACT
                       FIGURE 50 EUROPEAN DRIP IRRIGATION MARKET: RECESSION IMPACT ANALYSIS, 2024
                       TABLE 107 EUROPE: DRIP IRRIGATION MARKET, BY CROP TYPE, 2019–2023 (‘000 HA)
                       TABLE 108 EUROPE: DRIP IRRIGATION MARKET, BY CROP TYPE, 2024–2029 (‘000 HA)
                       TABLE 109 EUROPE: DRIP IRRIGATION MARKET, BY COUNTRY, 2019–2023 (USD MILLION)
                       TABLE 110 EUROPE: DRIP IRRIGATION MARKET, BY COUNTRY, 2024–2029 (USD MILLION)
                       TABLE 111 EUROPE: DRIP IRRIGATION MARKET, BY CROP TYPE, 2019–2023 (USD MILLION)
                       TABLE 112 EUROPE: DRIP IRRIGATION MARKET, BY CROP TYPE, 2024–2029 (USD MILLION)
                       TABLE 113 EUROPE: DRIP IRRIGATION MARKET, BY APPLICATION, 2019–2023 (USD MILLION)
                       TABLE 114 EUROPE: DRIP IRRIGATION MARKET, BY APPLICATION, 2024–2029 (USD MILLION)
                       TABLE 115 EUROPE: DRIP IRRIGATION MARKET, BY COMPONENT, 2019–2023 (USD MILLION)
                       TABLE 116 EUROPE: DRIP IRRIGATION MARKET, BY COMPONENT, 2024–2029 (USD MILLION)
                       TABLE 117 EUROPE: DRIP IRRIGATION MARKET, BY EMITTER/DRIPPER TYPE, 2019–2023 (USD MILLION)
                       TABLE 118 EUROPE: DRIP IRRIGATION MARKET, BY EMITTER/DRIPPER TYPE, 2024–2029 (USD MILLION)
             11.3.2 SPAIN
                       11.3.2.1 Use of drip irrigation system in production of high-value crops to drive market in Spain
                                   TABLE 119 SPAIN: DRIP IRRIGATION MARKET, BY CROP TYPE, 2019–2023 (USD MILLION)
                                   TABLE 120 SPAIN: DRIP IRRIGATION MARKET, BY CROP TYPE, 2024–2029 (USD MILLION)
                                   TABLE 121 SPAIN: DRIP IRRIGATION MARKET, BY CROP TYPE, 2019–2023 (‘000 HA)
                                   TABLE 122 SPAIN: DRIP IRRIGATION MARKET, BY CROP TYPE, 2024–2029 (‘000 HA)
                                   TABLE 123 SPAIN: DRIP IRRIGATION MARKET, BY COMPONENT, 2019–2023 (USD MILLION)
                                   TABLE 124 SPAIN: DRIP IRRIGATION MARKET, BY COMPONENT, 2024–2029 (USD MILLION)
             11.3.3 ITALY
                       11.3.3.1 Vineyards to contribute significantly to demand for drip irrigation systems in Italy
                                   TABLE 125 ITALY: DRIP IRRIGATION MARKET, BY CROP TYPE, 2019–2023 (USD THOUSAND)
                                   TABLE 126 ITALY: DRIP IRRIGATION MARKET, BY CROP TYPE, 2024–2029 (USD THOUSAND)
                                   TABLE 127 ITALY: DRIP IRRIGATION MARKET, BY CROP TYPE, 2019–2023 (‘000 HA)
                                   TABLE 128 ITALY: DRIP IRRIGATION MARKET, BY CROP TYPE, 2024–2029 (‘000 HA)
                                   TABLE 129 ITALY: DRIP IRRIGATION MARKET, BY COMPONENT, 2019–2023 (USD THOUSAND)
                                   TABLE 130 ITALY: DRIP IRRIGATION MARKET, BY COMPONENT, 2024–2029 (USD THOUSAND)
             11.3.4 FRANCE
                       11.3.4.1 Increasing need for modernization of irrigation system to supplement drip irrigation deployment
                                   TABLE 131 FRANCE: DRIP IRRIGATION MARKET, BY CROP TYPE, 2019–2023 (USD MILLION)
                                   TABLE 132 FRANCE: DRIP IRRIGATION MARKET, BY CROP TYPE, 2024–2029 (USD MILLION)
                                   TABLE 133 FRANCE: DRIP IRRIGATION MARKET, BY CROP TYPE, 2019–2023 (‘000 HA)
                                   TABLE 134 FRANCE: DRIP IRRIGATION MARKET, BY CROP TYPE, 2024–2029 (‘000 HA)
                                   TABLE 135 FRANCE: DRIP IRRIGATION MARKET, BY COMPONENT, 2019–2023 (USD MILLION)
                                   TABLE 136 FRANCE: DRIP IRRIGATION MARKET, BY COMPONENT, 2024–2029 (USD MILLION)
             11.3.5 GREECE
                       11.3.5.1 Consistent efforts by Greek government to fuel deployment of microirrigation systems
                                   TABLE 137 GREECE: DRIP IRRIGATION MARKET, BY CROP TYPE, 2019–2023 (USD MILLION)
                                   TABLE 138 GREECE: DRIP IRRIGATION MARKET, BY CROP TYPE, 2024–2029 (USD MILLION)
                                   TABLE 139 GREECE: DRIP IRRIGATION MARKET, BY CROP TYPE, 2019–2023 (‘000 HA)
                                   TABLE 140 GREECE: DRIP IRRIGATION MARKET, BY CROP TYPE, 2024–2029 (‘000 HA)
                                   TABLE 141 GREECE: DRIP IRRIGATION MARKET, BY COMPONENT, 2019–2023 (USD MILLION)
                                   TABLE 142 GREECE: DRIP IRRIGATION MARKET, BY COMPONENT, 2024–2029 (USD MILLION)
             11.3.6 TURKEY
                       11.3.6.1 Consistent efforts by Turkish government to boost modern irrigation methods, including drip irrigation
                                   TABLE 143 TURKEY: DRIP IRRIGATION MARKET, BY CROP TYPE, 2019–2023 (USD MILLION)
                                   TABLE 144 TURKEY: DRIP IRRIGATION MARKET, BY CROP TYPE, 2024–2029 (USD MILLION)
                                   TABLE 145 TURKEY: DRIP IRRIGATION MARKET, BY CROP TYPE, 2019–2023 (‘000 HA)
                                   TABLE 146 TURKEY: DRIP IRRIGATION MARKET, BY CROP TYPE, 2024–2029 (‘000 HA)
                                   TABLE 147 TURKEY: DRIP IRRIGATION MARKET, BY COMPONENT, 2019–2023 (USD MILLION)
                                   TABLE 148 TURKEY: DRIP IRRIGATION MARKET, BY COMPONENT, 2024–2029 (USD MILLION)
             11.3.7 REST OF EUROPE
                       TABLE 149 REST OF EUROPE: DRIP IRRIGATION MARKET, BY CROP TYPE, 2019–2023 (USD MILLION)
                       TABLE 150 REST OF EUROPE: DRIP IRRIGATION MARKET, BY CROP TYPE, 2024–2029 (USD MILLION)
                       TABLE 151 REST OF EUROPE: DRIP IRRIGATION MARKET, BY CROP TYPE, 2019–2023 (‘000 HA)
                       TABLE 152 REST OF EUROPE: DRIP IRRIGATION MARKET, BY CROP TYPE, 2024–2029 (‘000 HA)
                       TABLE 153 REST OF EUROPE: DRIP IRRIGATION MARKET, BY COMPONENT, 2019–2023 (USD MILLION)
                       TABLE 154 REST OF EUROPE: DRIP IRRIGATION MARKET, BY COMPONENT, 2024–2029 (USD MILLION)
     11.4 ASIA PACIFIC 
               FIGURE 51 ASIA PACIFIC: DRIP IRRIGATION MARKET SNAPSHOT
             11.4.1 RECESSION IMPACT
                       FIGURE 52 ASIA PACIFIC RECESSION IMPACT ANALYSIS, 2024
                       TABLE 155 ASIA PACIFIC: DRIP IRRIGATION MARKET, BY CROP TYPE, 2019–2023 (‘000 HA)
                       TABLE 156 ASIA PACIFIC: DRIP IRRIGATION MARKET, BY CROP TYPE, 2024–2029 (‘000 HA)
                       TABLE 157 ASIA PACIFIC: DRIP IRRIGATION MARKET, BY COUNTRY, 2019–2023 (USD MILLION)
                       TABLE 158 ASIA PACIFIC: DRIP IRRIGATION MARKET, BY COUNTRY, 2024–2029 (USD MILLION)
                       TABLE 159 ASIA PACIFIC: DRIP IRRIGATION MARKET, BY CROP TYPE, 2019–2023 (USD MILLION)
                       TABLE 160 ASIA PACIFIC: DRIP IRRIGATION MARKET, BY CROP TYPE, 2024–2029 (USD MILLION)
                       TABLE 161 ASIA PACIFIC: DRIP IRRIGATION MARKET, BY APPLICATION, 2019–2023 (USD MILLION)
                       TABLE 162 ASIA PACIFIC: DRIP IRRIGATION MARKET, BY APPLICATION, 2024–2029 (USD MILLION)
                       TABLE 163 ASIA PACIFIC: DRIP IRRIGATION MARKET, BY COMPONENT, 2019–2023 (USD MILLION)
                       TABLE 164 ASIA PACIFIC: DRIP IRRIGATION MARKET, BY COMPONENT, 2024–2029 (USD MILLION)
                       TABLE 165 ASIA PACIFIC: DRIP IRRIGATION MARKET, BY EMITTER/DRIPPER TYPE, 2019–2023 (USD MILLION)
                       TABLE 166 ASIA PACIFIC: DRIP IRRIGATION MARKET, BY EMITTER/DRIPPER TYPE, 2024–2029 (USD MILLION)
             11.4.2 CHINA
                       11.4.2.1 Growing concerns about water usage and initiatives by Chinese government to drive drip irrigation market
                                   TABLE 167 CHINA: DRIP IRRIGATION MARKET, BY CROP TYPE, 2019–2023 (USD MILLION)
                                   TABLE 168 CHINA: DRIP IRRIGATION MARKET, BY CROP TYPE, 2024–2029 (USD MILLION)
                                   TABLE 169 CHINA: DRIP IRRIGATION MARKET, BY CROP TYPE, 2019–2023 (‘000 HA)
                                   TABLE 170 CHINA: DRIP IRRIGATION MARKET, BY CROP TYPE, 2024–2029 (‘000 HA)
                                   TABLE 171 CHINA: DRIP IRRIGATION MARKET, BY COMPONENT, 2019–2023 (USD MILLION)
                                   TABLE 172 CHINA: DRIP IRRIGATION MARKET, BY COMPONENT, 2024–2029 (USD MILLION)
             11.4.3 INDIA
                       11.4.3.1 Rising concerns over water scarcity and favorable agricultural environment to fuel drip irrigation market growth in India
                                   TABLE 173 INDIA: DRIP IRRIGATION MARKET, BY CROP TYPE, 2019–2023 (USD MILLION)
                                   TABLE 174 INDIA: DRIP IRRIGATION MARKET, BY CROP TYPE, 2024–2029 (USD MILLION)
                                   TABLE 175 INDIA: DRIP IRRIGATION MARKET, BY CROP TYPE, 2019–2023 (‘000 HA)
                                   TABLE 176 INDIA: DRIP IRRIGATION MARKET, BY CROP TYPE, 2024–2029 (‘000 HA)
                                   TABLE 177 INDIA: DRIP IRRIGATION MARKET, BY COMPONENT, 2019–2023 (USD MILLION)
                                   TABLE 178 INDIA: DRIP IRRIGATION MARKET, BY COMPONENT, 2024–2029 (USD MILLION)
             11.4.4 AUSTRALIA
                       11.4.4.1 Technological advancements and presence of key players in Australia to support drip irrigation
                                   TABLE 179 AUSTRALIA: DRIP IRRIGATION MARKET, BY CROP TYPE, 2019–2023 (USD MILLION)
                                   TABLE 180 AUSTRALIA: DRIP IRRIGATION MARKET, BY CROP TYPE, 2024–2029 (USD MILLION)
                                   TABLE 181 AUSTRALIA: DRIP IRRIGATION MARKET, BY CROP TYPE, 2019–2023 (‘000 HA)
                                   TABLE 182 AUSTRALIA: DRIP IRRIGATION MARKET, BY CROP TYPE, 2024–2029 (‘000 HA)
                                   TABLE 183 AUSTRALIA: DRIP IRRIGATION MARKET, BY COMPONENT, 2019–2023 (USD MILLION)
                                   TABLE 184 AUSTRALIA: DRIP IRRIGATION MARKET, BY COMPONENT, 2024–2029 (USD MILLION)
             11.4.5 JAPAN
                       11.4.5.1 Increase in scope of protected agriculture to attract investments in drip irrigation
                                   TABLE 185 JAPAN: DRIP IRRIGATION MARKET, BY CROP TYPE, 2019–2023 (USD THOUSAND)
                                   TABLE 186 JAPAN: DRIP IRRIGATION MARKET, BY CROP TYPE, 2024–2029 (USD THOUSAND)
                                   TABLE 187 JAPAN: DRIP IRRIGATION MARKET, BY CROP TYPE, 2019–2023 (‘000 HA)
                                   TABLE 188 JAPAN: DRIP IRRIGATION MARKET, BY CROP TYPE, 2024–2029 (‘000 HA)
                                   TABLE 189 JAPAN: DRIP IRRIGATION MARKET, BY COMPONENT, 2019–2023 (USD THOUSAND)
                                   TABLE 190 JAPAN: DRIP IRRIGATION MARKET, BY COMPONENT, 2024–2029 (USD THOUSAND)
             11.4.6 INDONESIA
                       11.4.6.1 Minimal land for agriculture and short rainfall periods driving demand for drip irrigation systems
                                   TABLE 191 INDONESIA: DRIP IRRIGATION MARKET, BY CROP TYPE, 2019–2023 (USD MILLION)
                                   TABLE 192 INDONESIA: DRIP IRRIGATION MARKET, BY CROP TYPE, 2024–2029 (USD MILLION)
                                   TABLE 193 INDONESIA: DRIP IRRIGATION MARKET, BY CROP TYPE, 2019–2023 (‘000 HA)
                                   TABLE 194 INDONESIA: DRIP IRRIGATION MARKET, BY CROP TYPE, 2024–2029 (‘000 HA)
                                   TABLE 195 INDONESIA: DRIP IRRIGATION MARKET, BY COMPONENT, 2019–2023 (USD THOUSAND)
                                   TABLE 196 INDONESIA: DRIP IRRIGATION MARKET, BY COMPONENT, 2024–2029 (USD THOUSAND)
             11.4.7 THAILAND
                       11.4.7.1 Government initiatives expected to encourage drip irrigation for fruit cultivation
                                   TABLE 197 THAILAND: DRIP IRRIGATION MARKET, BY CROP TYPE, 2019–2023 (USD THOUSAND)
                                   TABLE 198 THAILAND: DRIP IRRIGATION MARKET, BY CROP TYPE, 2024–2029 (USD THOUSAND)
                                   TABLE 199 THAILAND: DRIP IRRIGATION MARKET, BY CROP TYPE, 2019–2023 (‘000 HA)
                                   TABLE 200 THAILAND: DRIP IRRIGATION MARKET, BY CROP TYPE, 2024–2029 (‘000 HA)
                                   TABLE 201 THAILAND: DRIP IRRIGATION MARKET, BY COMPONENT, 2019–2023 (USD THOUSAND)
                                   TABLE 202 THAILAND: DRIP IRRIGATION MARKET, BY COMPONENT, 2024–2029 (USD THOUSAND)
             11.4.8 REST OF ASIA PACIFIC
                       TABLE 203 REST OF ASIA PACIFIC: DRIP IRRIGATION MARKET, BY CROP TYPE, 2019–2023 (USD MILLION)
                       TABLE 204 REST OF ASIA PACIFIC: DRIP IRRIGATION MARKET, BY CROP TYPE, 2024–2029 (USD MILLION)
                       TABLE 205 REST OF ASIA PACIFIC: DRIP IRRIGATION MARKET, BY CROP TYPE, 2019–2023 (‘000 HA)
                       TABLE 206 REST OF ASIA PACIFIC: DRIP IRRIGATION MARKET, BY CROP TYPE, 2024–2029 (‘000 HA)
                       TABLE 207 REST OF ASIA PACIFIC: DRIP IRRIGATION MARKET, BY COMPONENT, 2019–2023 (USD MILLION)
                       TABLE 208 REST OF ASIA PACIFIC: DRIP IRRIGATION MARKET, BY COMPONENT, 2024–2029 (USD MILLION)
     11.5 SOUTH AMERICA 
             11.5.1 RECESSION IMPACT
                       FIGURE 53 SOUTH AMERICAN RECESSION IMPACT ANALYSIS, 2024
                       TABLE 209 SOUTH AMERICA: DRIP IRRIGATION MARKET, BY CROP TYPE, 2019–2023 (‘000 HA)
                       TABLE 210 SOUTH AMERICA: DRIP IRRIGATION MARKET, BY CROP TYPE, 2024–2029 (‘000 HA)
                       TABLE 211 SOUTH AMERICA: DRIP IRRIGATION MARKET, BY COUNTRY, 2019–2023 (USD MILLION)
                       TABLE 212 SOUTH AMERICA: DRIP IRRIGATION MARKET, BY COUNTRY, 2024–2029 (USD MILLION)
                       TABLE 213 SOUTH AMERICA: DRIP IRRIGATION MARKET, BY CROP TYPE, 2019–2023 (USD MILLION)
                       TABLE 214 SOUTH AMERICA: DRIP IRRIGATION MARKET, BY CROP TYPE, 2024–2029 (USD MILLION)
                       TABLE 215 SOUTH AMERICA: DRIP IRRIGATION MARKET, BY APPLICATION, 2019–2023 (USD MILLION)
                       TABLE 216 SOUTH AMERICA: DRIP IRRIGATION MARKET, BY APPLICATION, 2024–2029 (USD MILLION)
                       TABLE 217 SOUTH AMERICA: DRIP IRRIGATION MARKET, BY COMPONENT, 2019–2023 (USD MILLION)
                       TABLE 218 SOUTH AMERICA: DRIP IRRIGATION MARKET, BY COMPONENT, 2024–2029 (USD MILLION)
                       TABLE 219 SOUTH AMERICA: DRIP IRRIGATION MARKET, BY EMITTER/DRIPPER TYPE, 2019–2023 (USD MILLION)
                       TABLE 220 SOUTH AMERICA: DRIP IRRIGATION MARKET, BY EMITTER/DRIPPER TYPE, 2024–2029 (USD MILLION)
             11.5.2 BRAZIL
                       11.5.2.1 Adoption of drip irrigation through drip protection to drive market
                                   TABLE 221 BRAZIL: DRIP IRRIGATION MARKET, BY CROP TYPE, 2019–2023 (USD MILLION)
                                   TABLE 222 BRAZIL: DRIP IRRIGATION MARKET, BY CROP TYPE, 2024–2029 (USD MILLION)
                                   TABLE 223 BRAZIL: DRIP IRRIGATION MARKET, BY CROP TYPE, 2019–2023 (‘000 HA)
                                   TABLE 224 BRAZIL: DRIP IRRIGATION MARKET, BY CROP TYPE, 2024–2029 (‘000 HA)
                                   TABLE 225 BRAZIL: DRIP IRRIGATION MARKET, BY COMPONENT, 2019–2023 (USD MILLION)
                                   TABLE 226 BRAZIL: DRIP IRRIGATION MARKET, BY COMPONENT, 2024–2029 (USD MILLION)
             11.5.3 ARGENTINA
                       11.5.3.1 Growing potential for agriculture to boost demand for drip irrigation
                                   TABLE 227 ARGENTINA: DRIP IRRIGATION MARKET, BY CROP TYPE, 2019–2023 (USD MILLION)
                                   TABLE 228 ARGENTINA: DRIP IRRIGATION MARKET, BY CROP TYPE, 2024–2029 (USD MILLION)
                                   TABLE 229 ARGENTINA: DRIP IRRIGATION MARKET, BY CROP TYPE, 2019–2023 (‘000 HA)
                                   TABLE 230 ARGENTINA: DRIP IRRIGATION MARKET, BY CROP TYPE, 2024–2029 (‘000 HA)
                                   TABLE 231 ARGENTINA: DRIP IRRIGATION MARKET, BY COMPONENT, 2019–2023 (USD MILLION)
                                   TABLE 232 ARGENTINA: DRIP IRRIGATION MARKET, BY COMPONENT, 2024–2029 (USD MILLION)
             11.5.4 REST OF SOUTH AMERICA
                       TABLE 233 REST OF SOUTH AMERICA: DRIP IRRIGATION MARKET, BY CROP TYPE, 2019–2023 (USD MILLION)
                       TABLE 234 REST OF SOUTH AMERICA: DRIP IRRIGATION MARKET, BY CROP TYPE, 2024–2029 (USD MILLION)
                       TABLE 235 REST OF SOUTH AMERICA: DRIP IRRIGATION MARKET, BY CROP TYPE, 2019–2023 (‘000 HA)
                       TABLE 236 REST OF SOUTH AMERICA: DRIP IRRIGATION MARKET, BY CROP TYPE, 2024–2029 (‘000 HA)
                       TABLE 237 REST OF SOUTH AMERICA: DRIP IRRIGATION MARKET, BY COMPONENT, 2019–2023 (USD MILLION)
                       TABLE 238 REST OF SOUTH AMERICA: DRIP IRRIGATION MARKET, BY COMPONENT, 2024–2029 (USD MILLION)
     11.6 REST OF THE WORLD (ROW) 
               FIGURE 54 ROW: DRIP IRRIGATION MARKET SNAPSHOT
             11.6.1 RECESSION IMPACT
                       FIGURE 55 ROW RECESSION IMPACT ANALYSIS, 2024
                       TABLE 239 ROW: DRIP IRRIGATION MARKET, BY CROP TYPE, 2019–2023 (‘000 HA)
                       TABLE 240 ROW: DRIP IRRIGATION MARKET, BY CROP TYPE, 2024–2029 (‘000 HA)
                       TABLE 241 ROW: DRIP IRRIGATION MARKET, BY REGION, 2019–2023 (USD MILLION)
                       TABLE 242 ROW: DRIP IRRIGATION MARKET, BY REGION, 2024–2029 (USD MILLION)
                       TABLE 243 ROW: DRIP IRRIGATION MARKET, BY CROP TYPE, 2019–2023 (USD MILLION)
                       TABLE 244 ROW: DRIP IRRIGATION MARKET, BY CROP TYPE, 2024–2029 (USD MILLION)
                       TABLE 245 ROW: DRIP IRRIGATION MARKET, BY APPLICATION, 2019–2023 (USD MILLION)
                       TABLE 246 ROW: DRIP IRRIGATION MARKET, BY APPLICATION, 2024–2029 (USD MILLION)
                       TABLE 247 ROW: DRIP IRRIGATION MARKET, BY COMPONENT, 2019–2023 (USD MILLION)
                       TABLE 248 ROW: DRIP IRRIGATION MARKET, BY COMPONENT, 2024–2029 (USD MILLION)
                       TABLE 249 ROW: DRIP IRRIGATION MARKET, BY EMITTER/DRIPPER TYPE, 2019–2023 (USD MILLION)
                       TABLE 250 ROW: DRIP IRRIGATION MARKET, BY EMITTER/DRIPPER TYPE, 2024–2029 (USD MILLION)
             11.6.2 AFRICA
                       11.6.2.1 Investments by governments and collaboration of companies to support drip irrigation to fuel demand
                                   TABLE 251 AFRICA: DRIP IRRIGATION MARKET, BY CROP TYPE, 2019–2023 (USD MILLION)
                                   TABLE 252 AFRICA: DRIP IRRIGATION MARKET, BY CROP TYPE, 2024–2029 (USD MILLION)
                                   TABLE 253 AFRICA: DRIP IRRIGATION MARKET, BY CROP TYPE, 2019–2023 (‘000 HA)
                                   TABLE 254 AFRICA: DRIP IRRIGATION MARKET, BY CROP TYPE, 2024–2029 (‘000 HA)
                                   TABLE 255 AFRICA: DRIP IRRIGATION MARKET, BY COMPONENT, 2019–2023 (USD MILLION)
                                   TABLE 256 AFRICA: DRIP IRRIGATION MARKET, BY COMPONENT, 2024–2029 (USD MILLION)
             11.6.3 MIDDLE EAST
                       11.6.3.1 Investments by governments and partnerships between key players to drive market growth
                                   TABLE 257 MIDDLE EAST: DRIP IRRIGATION MARKET, BY CROP TYPE, 2019–2023 (USD MILLION)
                                   TABLE 258 MIDDLE EAST: DRIP IRRIGATION MARKET, BY CROP TYPE, 2024–2029 (USD MILLION)
                                   TABLE 259 MIDDLE EAST: DRIP IRRIGATION MARKET, BY CROP TYPE, 2019–2023 (‘000 HA)
                                   TABLE 260 MIDDLE EAST: DRIP IRRIGATION MARKET, BY CROP TYPE, 2024–2029 (‘000 HA)
                                   TABLE 261 MIDDLE EAST: DRIP IRRIGATION MARKET, BY COMPONENT, 2019–2023 (USD MILLION)
                                   TABLE 262 MIDDLE EAST: DRIP IRRIGATION MARKET, BY COMPONENT, 2024–2029 (USD MILLION)
 
12 COMPETITIVE LANDSCAPE (Page No. - 221)
     12.1 OVERVIEW 
     12.2 KEY PLAYERS' STRATEGIES/RIGHT TO WIN 
               TABLE 263 OVERVIEW OF STRATEGIES ADOPTED BY KEY PLAYERS IN DRIP IRRIGATION MARKET, 2020–2024
     12.3 SEGMENTAL REVENUE ANALYSIS 
               FIGURE 56 ANNUAL SEGMENTAL REVENUE ANALYSIS OF KEY PLAYERS, 2019–2023 (USD BILLION)
     12.4 MARKET SHARE ANALYSIS, 2023 
               FIGURE 57 DRIP IRRIGATION MARKET: MARKET SHARE ANALYSIS
               TABLE 264 DRIP IRRIGATION MARKET: DEGREE OF COMPETITION
     12.5 COMPANY EVALUATION MATRIX: KEY PLAYERS, 2023 
             12.5.1 STARS
             12.5.2 EMERGING LEADERS
             12.5.3 PERVASIVE PLAYERS
             12.5.4 PARTICIPANTS
                       FIGURE 58 DRIP IRRIGATION MARKET: COMPANY EVALUATION MATRIX (KEY PLAYERS), 2023
             12.5.5 COMPANY FOOTPRINT: KEY PLAYERS, 2023
                       12.5.5.1 Company footprint
                                   FIGURE 59 COMPANY FOOTPRINT
                       12.5.5.2 Component footprint
                                   TABLE 265 DRIP IRRIGATION MARKET: COMPONENT FOOTPRINT
                       12.5.5.3 Emitter/Dripper type footprint
                                   TABLE 266 DRIP IRRIGATION MARKET: EMITTER/DRIPPER TYPE FOOTPRINT
                       12.5.5.4 Crop type footprint
                                   TABLE 267 DRIP IRRIGATION MARKET: CROP TYPE FOOTPRINT
                       12.5.5.5 Application footprint
                                   TABLE 268 DRIP IRRIGATION MARKET: APPLICATION FOOTPRINT
                       12.5.5.6 Region footprint
                                   TABLE 269 DRIP IRRIGATION MARKET: REGION FOOTPRINT
     12.6 COMPANY EVALUATION MATRIX: STARTUPS/SMES, 2023 
             12.6.1 PROGRESSIVE COMPANIES
             12.6.2 RESPONSIVE COMPANIES
             12.6.3 DYNAMIC COMPANIES
             12.6.4 STARTING BLOCKS
                       FIGURE 60 DRIP IRRIGATION MARKET: COMPANY EVALUATION MATRIX (STARTUPS/SMES), 2023
             12.6.5 COMPETITIVE BENCHMARKING: STARTUPS/SMES, 2023
                       12.6.5.1 Detailed list of key startups/SMEs
                                   TABLE 270 DRIP IRRIGATION MARKET: LIST OF KEY STARTUPS/SMES
                       12.6.5.2 Competitive benchmarking of key startups/SMEs
                                   TABLE 271 DRIP IRRIGATION MARKET: COMPETITIVE BENCHMARKING OF KEY STARTUPS/SMES, 2023 (1/3)
                                   TABLE 272 DRIP IRRIGATION MARKET: COMPETITIVE BENCHMARKING OF KEY STARTUPS/SMES, 2023 (2/3)
                                   TABLE 273 DRIP IRRIGATION MARKET: COMPETITIVE BENCHMARKING OF KEY STARTUPS/SMES, 2023 (3/3)
     12.7 COMPANY VALUATION AND FINANCIAL METRICS 
               FIGURE 61 COMPANY VALUATION OF FEW MAJOR PLAYERS
               FIGURE 62 EV/EBITDA OF KEY COMPANIES
     12.8 BRAND/PRODUCT/SERVICE ANALYSIS 
               FIGURE 63 BRAND/PRODUCT/SERVICE ANALYSIS, BY KEY BRANDS OF DRIP IRRIGATION KEY
     12.9 COMPETITIVE SCENARIO AND TRENDS 
             12.9.1 PRODUCT LAUNCHES
                       TABLE 274 DRIP IRRIGATION MARKET: PRODUCT/SERVICE LAUNCHES, JANUARY 2020–MAY 2024
             12.9.2 DEALS
                       TABLE 275 DRIP IRRIGATION MARKET: DEALS, JANUARY 2020–MAY 2024
             12.9.3 EXPANSIONS
                       TABLE 276 DRIP IRRIGATION MARKET: EXPANSIONS, JANUARY 2020–MAY 2024
 
13 COMPANY PROFILES (Page No. - 244)
(Business overview, Products/Solutions/Services offered, Recent developments & MnM View)*
     13.1 KEY PLAYERS 
             13.1.1 NETAFIM
                       TABLE 277 NETAFIM: COMPANY OVERVIEW
                       FIGURE 64 NETAFIM: COMPANY SNAPSHOT
                       TABLE 278 NETAFIM: PRODUCTS/SOLUTIONS/SERVICES OFFERED
                       TABLE 279 NETAFIM: PRODUCT LAUNCHES
                       TABLE 280 NETAFIM: DEALS
             13.1.2 RIVULIS
                       TABLE 281 RIVULIS: COMPANY OVERVIEW
                       TABLE 282 RIVULIS: PRODUCTS/SOLUTIONS/SERVICES OFFERED
                       TABLE 283 RIVULIS: PRODUCT LAUNCHES
                       TABLE 284 RIVULIS: DEALS
             13.1.3 THE TORO COMPANY
                       TABLE 285 THE TORO COMPANY: COMPANY OVERVIEW
                       FIGURE 65 THE TORO COMPANY: COMPANY SNAPSHOT
                       TABLE 286 THE TORO COMPANY: PRODUCTS/SOLUTIONS/SERVICES OFFERED
                       TABLE 287 THE TORO COMPANY: PRODUCT LAUNCHES
             13.1.4 JAIN IRRIGATION SYSTEMS LTD.
                       TABLE 288 JAIN IRRIGATION SYSTEMS LTD.: COMPANY OVERVIEW
                       FIGURE 66 JAIN IRRIGATION SYSTEMS LTD.: COMPANY SNAPSHOT
                       TABLE 289 JAIN IRRIGATION SYSTEMS LTD.: PRODUCTS/SOLUTIONS/SERVICES OFFERED
                       TABLE 290 JAIN IRRIGATION SYSTEMS LTD.: DEALS
             13.1.5 HUNTER INDUSTRIES INC.
                       TABLE 291 HUNTER INDUSTRIES INC.: COMPANY OVERVIEW
                       TABLE 292 HUNTER INDUSTRIES INC.: PRODUCTS/SOLUTIONS/SERVICES OFFERED
                       TABLE 293 HUNTER INDUSTRIES INC.: DEALS
             13.1.6 MAHINDRA EPC IRRIGATION LIMITED
                       TABLE 294 MAHINDRA EPC IRRIGATION LIMITED: COMPANY OVERVIEW
                       FIGURE 67 MAHINDRA EPC IRRIGATION LIMITED.: COMPANY SNAPSHOT
                       TABLE 295 MAHINDRA EPC IRRIGATION LIMITED: PRODUCTS/SOLUTIONS/SERVICES OFFERED
             13.1.7 RAIN BIRD CORPORATION
                       TABLE 296 RAIN BIRD CORPORATION: COMPANY OVERVIEW
                       TABLE 297 RAIN BIRD CORPORATION: PRODUCTS/SOLUTIONS/SERVICES OFFERED
                       TABLE 298 RAIN BIRD CORPORATION: PRODUCT LAUNCHES
             13.1.8 CHINADRIP IRRIGATION EQUIPMENT (XIAMEN) CO., LTD
                       TABLE 299 CHINADRIP IRRIGATION EQUIPMENT (XIAMEN) CO., LTD.: COMPANY OVERVIEW
                       TABLE 300 CHINADRIP IRRIGATION EQUIPMENT CO. LTD.: PRODUCTS/SOLUTIONS/SERVICES OFFERED
                       TABLE 301 CHINADRIP IRRIGATION EQUIPMENT (XIAMEN) CO., LTD.: PRODUCT LAUNCHES
             13.1.9 ELGO IRRIGATION LTD.
                       TABLE 302 ELGO IRRIGATION LTD.: COMPANY OVERVIEW
                       TABLE 303 ELGO IRRIGATION LTD.: PRODUCTS/SOLUTIONS/SERVICES OFFERED
               13.1.10 SHANGHAI IRRIST CORP., LTD.
                                   TABLE 304 SHANGHAI IRRIST CORP., LTD.: COMPANY OVERVIEW
                                   TABLE 305 SHANGHAI IRRIST CORP., LTD.: PRODUCTS/SOLUTIONS/SERVICES OFFERED
               13.1.11 ANTELCO
                                   TABLE 306 ANTELCO: COMPANY OVERVIEW
                                   TABLE 307 ANTELCO: PRODUCTS/SOLUTIONS/SERVICES OFFERED
                                   TABLE 308 ANTELCO: DEALS
               13.1.12 MICROJET IRRIGATION SYSTEMS
                                   TABLE 309 MICROJET IRRIGATION SYSTEMS: COMPANY OVERVIEW
                                   TABLE 310 MICROJET IRRIGATION SYSTEMS: PRODUCTS/SOLUTIONS/SERVICES OFFERED
               13.1.13 METZER
                                   TABLE 311 METZER: COMPANY OVERVIEW
                                   TABLE 312 METZER: PRODUCTS/SOLUTIONS/SERVICES OFFERED
                                   TABLE 313 METZER: EXPANSIONS
               13.1.14 GRUPO CHAMARTIN S.A.
                                   TABLE 314 GRUPO CHAMARTIN S.A.: COMPANY OVERVIEW
                                   TABLE 315 GRUPO CHAMARTIN S.A.: PRODUCTS/SOLUTIONS/SERVICES OFFERED
               13.1.15 AZUD
                                   TABLE 316 AZUD: COMPANY OVERVIEW
                                   TABLE 317 AZUD: PRODUCTS/SOLUTIONS/SERVICES OFFERED
     13.2 OTHER PLAYERS 
             13.2.1 DRIPWORKS
                       TABLE 318 DRIPWORKS: COMPANY OVERVIEW
                       TABLE 319 DRIPWORKS: PRODUCTS/SOLUTIONS/SERVICES OFFERED
             13.2.2 IRRITEC S.P.A
                       TABLE 320 IRRITEC S.P.A: COMPANY OVERVIEW
                       TABLE 321 IRRITEC S.P.A: PRODUCTS/SOLUTIONS/SERVICES OFFERED
                       TABLE 322 IRRITEC S.P.A: DEALS
                       TABLE 323 IRRITEC S.P.A: EXPANSIONS
             13.2.3 GOLDENKEY
                       TABLE 324 GOLDENKEY: COMPANY OVERVIEW
                       TABLE 325 GOLDENKEY: PRODUCTS/SOLUTIONS/SERVICES OFFERED
             13.2.4 KSNM DRIP
                       TABLE 326 KSNM DRIP: COMPANY OVERVIEW
                       TABLE 327 KSNM DRIP PRODUCTS/SOLUTIONS/SERVICES OFFERED
             13.2.5 NATIONAL DIVERSIFIED SALES, INC.
                       TABLE 328 NATIONAL DIVERSIFIED SALES, INC.: COMPANY OVERVIEW
                       TABLE 329 NATIONAL DIVERSIFIED SALES, INC.: PRODUCTS/SOLUTIONS/SERVICES OFFERED
             13.2.6 AGRODRIP
             13.2.7 IRRIGATION DIRECT CANADA
             13.2.8 SUJAY IRRIGATIONS PVT LTD.
             13.2.9 BHARAT DRIP IRRIGATION AND AGRO
             13.2.10 GLOBAL IRRIGATION, INC.
*Details on Business overview, Products/Solutions/Services offered, Recent developments & MnM View might not be captured in case of unlisted companies.
 
14 ADJACENT AND RELATED MARKETS (Page No. - 300)
     14.1 INTRODUCTION 
               TABLE 330 ADJACENT MARKETS TO DRIP IRRIGATION MARKET
     14.2 LIMITATIONS 
     14.3 DRIPPERS MARKET 
             14.3.1 MARKET DEFINITION
             14.3.2 MARKET OVERVIEW
                       TABLE 331 DRIPPERS MARKET, BY DRIPPER TYPE, 2019–2021 (USD MILLION)
                       TABLE 332 DRIPPERS MARKET, BY DRIPPER TYPE, 2022–2027 (USD MILLION)
     14.4 IRRIGATION AUTOMATION MARKET 
             14.4.1 MARKET DEFINITION
             14.4.2 MARKET OVERVIEW
                       TABLE 333 IRRIGATION AUTOMATION MARKET, BY COMPONENT, 2019–2021 (USD MILLION)
                       TABLE 334 IRRIGATION AUTOMATION MARKET, BY COMPONENT, 2022–2027 (USD MILLION)
 
15 APPENDIX (Page No. - 304)
     15.1 DISCUSSION GUIDE 
     15.2 KNOWLEDGESTORE: MARKETSANDMARKETS’ SUBSCRIPTION PORTAL 
     15.3 CUSTOMIZATION OPTIONS 
     15.4 RELATED REPORTS 
     15.5 AUTHOR DETAILS 

The study involved four major activities in estimating the current size of the drip irrigation market. Exhaustive secondary research was done to collect information on the market, peer market, and parent market. The next step was to validate these findings, assumptions, and sizing with industry experts across the value chain through primary research. Both top-down and bottom-up approaches were employed to estimate the complete market size. After that, market breakdown and data triangulation were used to estimate the market size of segments and subsegments.

Secondary Research

This research study involved the extensive use of secondary sources—directories and databases such as Bloomberg Businessweek and Factiva—to identify and collect information useful for a technical, market-oriented, and commercial study of the drip irrigation market.

In the secondary research process, various sources such as annual reports, press releases & investor presentations of companies, white papers, certified publications, articles from recognized authors, gold & silver standard websites, directories, and databases were referred to identify and collect information. This research study involved the extensive use of secondary sources—directories and databases such as Bloomberg Businessweek and Factiva—to identify and collect information useful for a technical, market-oriented, and commercial study of the drip irrigation market.

Secondary research was mainly used to obtain key information about the industry’s supply chain, the total pool of key players, and market classification and segmentation as per the industry trends to the bottom-most level, regional markets, and key developments from both market- and technology-oriented perspectives.

Primary Research

Extensive primary research was conducted after obtaining information regarding the drip irrigation market scenario through secondary research. Several primary interviews were conducted with market experts from both the demand and supply sides across major countries of North America, Europe, Asia Pacific, the Middle East & Africa, and South America. Primary data was collected through questionnaires, emails, and telephonic interviews. The primary sources from the supply side included various industry experts, such as Chief X Officers (CXOs), Vice Presidents (VPs), Directors from business development, marketing, research, and development teams, and related key executives from distributors and key opinion leaders. Primary interviews were conducted to gather insights such as market statistics, data on revenue collected from the products and services, market breakdowns, market size estimations, market forecasting, and data triangulation. Primary research also helped in understanding the various trends related to component type, crop type, application, emitter/dripper type, and region.
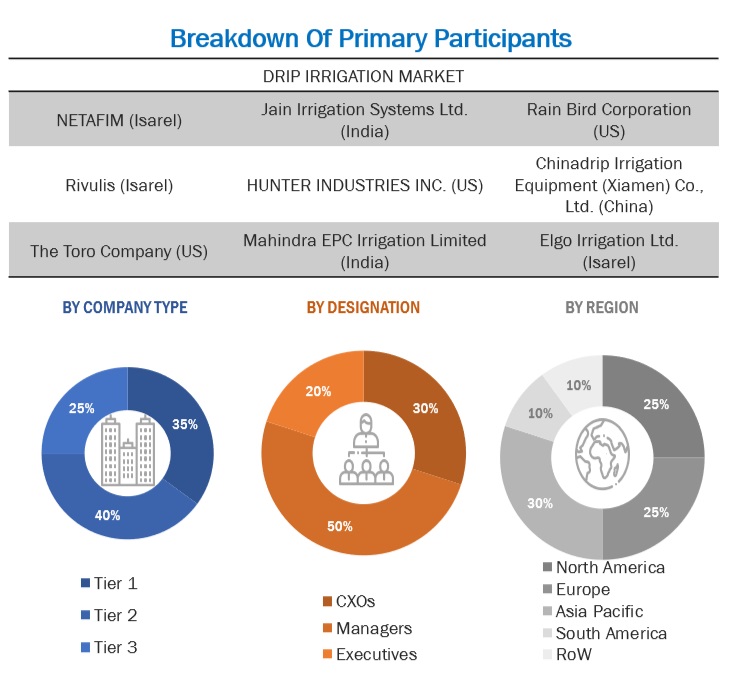
Drip Irrigation Market Size, and Share

To know about the assumptions considered for the study, download the pdf brochure

Market Size Estimation

Both the top-down and bottom-up approaches were used to estimate and validate the total size of the drip irrigation market. These approaches were also used extensively to estimate the size of various dependent submarkets. The research methodology used to estimate the market size includes the following:

  • Key players were identified through extensive secondary research.
  • The industry’s value chain and market size were determined through primary and secondary research.
  • All percentage share splits and breakdowns were determined using secondary sources and verified through primary sources.
  • All the possible parameters that affect the markets covered in this research study were accounted for, viewed in extensive detail, verified through primary research, and analyzed to obtain the final quantitative and qualitative data.
  • The following figure provides an illustrative representation of the complete market size estimation process implemented in this research study for an overall estimation of the drip irrigation market in a consolidated format.

The following sections (bottom-up & top-down) depict the overall market size estimation process employed for the purpose of this study.

Global Drip Irrigation Market: Bottom-Up Approach
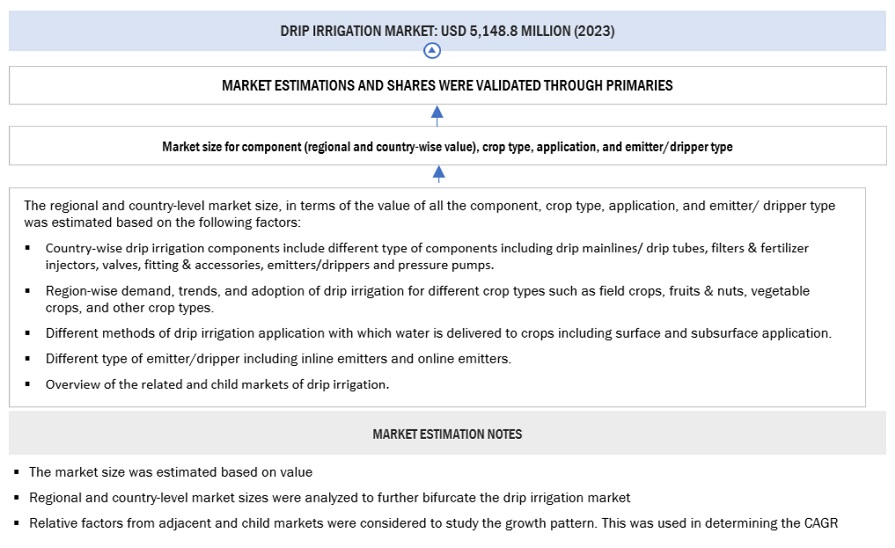
Drip Irrigation Market Bottom Up Approach

To know about the assumptions considered for the study, Request for Free Sample Report

Global Drip Irrigation Market: Top-Down Approach

Drip Irrigation Market Top Down Approach

Data Triangulation

After arriving at the overall market size from the estimation process explained above, the total market was split into several segments and subsegments. Data triangulation and market breakdown procedures were employed, wherever applicable, to estimate the overall drip irrigation market and arrive at the exact statistics for all segments and subsegments. The data was triangulated by studying various factors and trends from the demand and supply sides. Along with this, the market size was validated using both the top-down and bottom-up approaches.

Market Definition

Drip irrigation refers to a type of microirrigation system that allows water and nutrients to drip slowly into the roots of plants from above or below the soil surface. The use of drip irrigation helps minimize water loss due to evaporation by distributing water through a network of valves, pipes, tubing, and emitters. Drip irrigation methods are known to offer a significant advantage in efficiency against other conventional irrigation methods, including sprinklers and flooding.

Drip Irrigation is essential in applying small amounts of water and fertilizer unifirmly across a specific area, therebypreventing drift and runoff. Surface drip irrigation systems utilize close emitter spacing and a thin wall dripline, which is inserted below the surface. Subsurface systems utilize larger emitter intervals and comprise a thicker wall.

Key Stakeholders

  • Supply-side: Drip irrigation component manufacturers, drip irrigation technology providers, irrigation consultants & service providers, suppliers, and distributors
  • Demand-side: Farmers, agricultural warehouse owners, horticultural cooperative societies, importers, and exporters
  • Regulatory side: Concerned government authorities, commercial research & development (R&D) institutions, and other regulatory bodies
  • Associations and industry bodies such as the Food and Agricultural Organization (FAO) - AQUASTAT, Environmental Protection Agency (EPA), and the International Commission on Irrigation and Drainage (ICID)

Report Objectives

Market Intelligence

  • Determining and projecting the size of the drip irrigation market with respect to  component type, crop type, application, emitter/dripper type sample, and region.
  • Identifying the attractive opportunities in the market by determining the largest and fastest-growing segments
  • Providing detailed information about the key factors influencing the market growth (drivers, restraints, opportunities, and industry-specific challenges)
  • Providing the regulatory framework and market entry process related to the drip irrigation market
  • Analyzing the micro markets with respect to individual growth trends, prospects, and their contribution to the total market

Competitive Intelligence

  • Identifying and profiling the key players in the drip irrigation market
  • Providing a comparative analysis of market leaders based on the following:
  • Product offerings
  • Business strategies
  • Strengths and weaknesses
  • Key financials
  • Understanding the competitive landscape and identifying the major growth strategies adopted by players across the country
  • Providing insights on key product innovations and investments in the drip irrigation market

Available Customizations:

With the given market data, MarketsandMarkets offers customizations according to company-specific scientific needs.

The following customization options are available for the report:

Product Analysis

  • Product Matrix, which gives a detailed comparison of the product portfolio of each company.

Geographic Analysis

With the given market data, MarketsandMarkets offers customizations according to company-specific scientific needs.

  • Further breakdown of the Rest of Europe into Netherlands and Portugal.
  • Further breakdown of the Rest of Asia Pacific into South Korea, the Philippines, Bangladesh, and Vietnam.
  • Further breakdown of the Rest of South America into Peru, Ecuador, Chile, and Colombia.

Company Information

  • Detailed analyses and profiling of additional market players (up to five)
Custom Market Research Services

We will customize the research for you, in case the report listed above does not meet with your exact requirements. Our custom research will comprehensively cover the business information you require to help you arrive at strategic and profitable business decisions.

Request Customization

Instant Answers with GPT - Ask Now!

Ask real questions. Get complete answers !
Report Code
AGI 3730
Published ON
Jun, 2024
Choose License Type
BUY NOW
  • SHARE
X
Request Customization
Speak to Analyst
Speak to Analyst
OR FACE-TO-FACE MEETING
PERSONALIZE THIS RESEARCH
  • Triangulate with your Own Data
  • Get Data as per your Format and Definition
  • Gain a Deeper Dive on a Specific Application, Geography, Customer or Competitor
  • Any level of Personalization
REQUEST A FREE CUSTOMIZATION
LET US HELP YOU!
  • What are the Known and Unknown Adjacencies Impacting the Drip Irrigation Market
  • What will your New Revenue Sources be?
  • Who will be your Top Customer; what will make them switch?
  • Defend your Market Share or Win Competitors
  • Get a Scorecard for Target Partners
CUSTOMIZED WORKSHOP REQUEST
  • Call Us
  • +1-888-600-6441 (Corporate office hours)
  • +1-888-600-6441 (US/Can toll free)
  • +44-800-368-9399 (UK office hours)
CONNECT WITH US
ABOUT TRUST ONLINE
©2024 MarketsandMarkets Research Private Ltd. All rights reserved
DMCA.com Protection Status Website Feedback