Bioprocess Validation Market by Test Type (Extractables and Leachables, Integrity Testing, Microbiology Testing), Process Component (Filter Element, Bioreactors), End-User (CDMO, Biotechnology & Pharmaceutical Companies) & Region - Global Forecasts to 2024


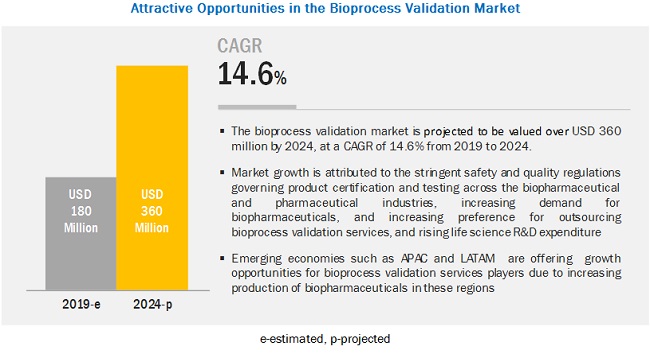
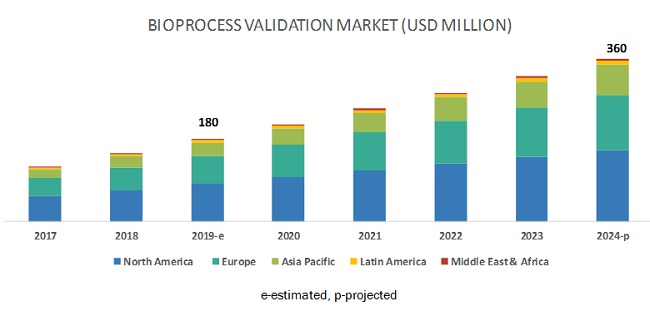
The global bioprocess validation market size is projected to reach USD 360 million by 2024, at a CAGR of 14.6%. Stringent safety and quality regulations governing product certification and testing across the biopharmaceutical and pharmaceutical industries, high demand for the outsourcing of bioprocess validation services, and regulatory mandates in the healthcare industry to maintain compliance with Good Manufacturing Practices (GMP) are the major factors driving the growth of this market.
Extractables/leachables testing services segment to account for the largest share of the bioprocess validation market, by test type, in 2019
The extractables/leachables testing services segment is expected to dominate the bioprocess validation market in 2019. The large share of this segment can be attributed to the presence of regulatory mandates and guidelines regarding the testing of extractables and leachables; increasing outsourcing of testing services by biopharmaceutical manufacturers; the growing requirement for product safety, identity, purity, and quality; and the increasing risk of product adulteration.
Pharmaceutical companies are estimated to be the largest end users of bioprocess validation in 2019
Pharmaceutical companies are expected to account for the largest share of the bioprocess validation market in 2019. The large share of this segment can majorly be attributed to increasing production of biopharmaceuticals and the corresponding increase in the number of impurities to be checked for, the stringency of standards and regulations regarding the quality and validity of bioprocesses involved in the production.
APAC market is estimated to grow at the highest CAGR during the forecast period
The bioprocess validation market in the APAC is estimated to grow at the highest CAGR during the forecast period. The growing biopharmaceutical manufacturing capabilities in Asian countries, increasing demand for outsourcing bioprocess validation, growing life science research specific to biologics and increasing investments by pharmaceutical and biotechnology companies is expected to drive market growth. Additionally, rising awareness about the advantages of biopharmaceutical drugs, and the growing number of CROs & CDMOs, and the favorable government initiatives to promote the growth of the pharmaceutical and biotechnology industries in several APAC countries.
Key Market Players
The prominent players operating in the global bioprocess validation market are Merck KGaA (Germany), SGS S.A. (Switzerland), Eurofins Scientific (Luxembourg), Sartorius Stedim Biotech (France), Pall Corporation (US), Cobetter Filtration Equipments Co., Ltd. (China), Toxikon Corporation (US), DOC S.r.l. (Italy), MEISSNER FILTRATION PRODUCTS, INC. (US), and Thermo Fisher Scientific (US).
Merck KGaA is one of the leading providers of bioprocess validation services across the globe. It provides a comprehensive portfolio of high-quality services for biopharmaceutical manufacturing. With a strong brand name and extensive geographic coverage in more than 60 countries, Merck has a well-established presence in the bioprocess validation market. In the market, the company focuses on strategies, such as expansions to increase its presence. With regard to this, the company opened an M Lab Collaboration Center in France in March 2019. This center will provide Merck’s bioprocessing customers with a shared, exploratory environment and support pharmaceuticals to develop validation services. With regard to delivering innovative products, Merck invests a significant amount of its sales revenue in R&D. In 2018, it invested around 15% of its sales revenue in R&D activities. This allows the company to extend its technological capabilities and provide superior-quality products, thereby helping it to achieve long-term growth
Pall Corporation is another leading provider of comprehensive bioprocess validation services for the biopharmaceutical industry. The company offers validation services for single-use and reusable process components used in bioprocessing. The company provides validation services to the biopharmaceutical industry through its strong distribution network across the globe. Pall’s business strategy includes selective expansion into new validation services applications. For instance, in December 2018, Pall opened its Biotech Integrated Solutions Center of Excellence (CoE) in Shanghai, China. However, the company could also focus on other strategies such as partnerships & agreements and acquisitions to further strengthen its position in the market.
Scope of the Report:
|
Report Metric |
Details |
|
Market size available for years |
2017–2024 |
|
Base year considered |
2018 |
|
Forecast period |
2019–2024 |
|
Forecast units |
Value (USD) |
|
Segments covered |
Test type, process component, and end-user |
|
Geographies covered |
North America, Europe, the Asia Pacific, Latin America, and the Middle East and Africa. |
|
Companies covered |
Merck KGaA (Germany), SGS S.A. (Switzerland), Eurofins Scientific (Luxembourg), Sartorius AG (France), Pall Corporation (US), Cobetter Filtration Equipments Co., Ltd. (China), Toxikon Corporation (US), DOC S.r.l. (Italy), MEISSNER FILTRATION PRODUCTS, INC. (US), and Thermo Fisher Scientific (US) |
This research report categorizes the market into the following segments and subsegments:
Bioprocess validation Market, by Test Type
- Extractables/Leachables Testing Services
-
Microbiological Testing Services
- Large-Scale Eukaryotic Cell Culture
- Virus Production And Purification
- Electron Microscopy
- Integrity Testing Services
- Physiochemical Testing Services
- Compatibility Testing Services
- Others Testing Services (Bacterial Retention Testing Services, and Adsorption Testing Services)
Bioprocess validation Market, by Process Component
- filter elements
- Media containers and bags
- freezing and thawing process bags
- mixing systems
- Bioreactors
- transfer systems
- others (Tubing, Connectors, Samplers)
Bioprocess validation Market, by End User
- Pharmaceutical Companies
- Biotechnology Companies
- Contract Development & Manufacturing Organizations
- Others (CROs, Research Laboratories and Institutes)
Bioprocess validation Market, by Region
-
North America
- US
- Canada
-
Europe
- Germany
- UK
- France
- Italy
- Spain
- Rest of Europe
-
Asia Pacific
- China
- Japan
- India
- Rest of Asia Pacific
-
Latin America
- Brazil
- Mexico
- Rest of Latin America
- Middle East & Africa
Recent Developments
- In August 2018, Merck KGaA launched the BioReliance Product Characterization Portfolio to enhance its service portfolio in the bioprocess validation market.
- In March 2017, Toxikon and SG Lab (Italy) entered into a partnership, to extend its analytical and extractable & leachable testing service portfolio to determine the drug integrity in the entire life cycle.
- In January 2019, SGS acquired LeanSis Expertos en Productividad S.L. (Spain). This acquisition provided SGS operational and manufacturing training and capacity building services to over 200 clients across Spain.
- In February 2018, Pall Corporation expanded its Hoegaarden office in Belgium with new R&D center, customer demonstration labs, and manufacturing space. This will help the company to establish its position in the Belgium market.
Critical questions the report answers:
- Where will all these developments take the industry in the medium-to-long-term?
- What are the major trends in bioprocess validation?
- Who are the major end-users of bioprocess validation?
- Which test types are used mainly for bioprocess validation?
- Which process component has a higher adoption rate of bioprocess validation?
To speak to our analyst for a discussion on the above findings, click Speak to Analyst
 Exclusive indicates content/data unique to MarketsandMarkets and not available with any competitors.
Table of Contents
1 Introduction (Page No. - 19)
1.1 Objectives of the Study
1.2 Market Definition
1.3 Market Scope
1.3.1 Markets Covered
1.3.2 Years Considered for the Study
1.4 Currency
1.5 Limitations
1.6 Stakeholders
2 Research Methodology (Page No. - 23)
2.1 Research Data
2.1.1 Secondary Data
2.1.1.1 Key Data From Secondary Sources
2.1.2 Primary Data
2.1.2.1 Key Data From Primary Sources
2.1.2.2 Key Industry Insights
2.2 Market Size Estimation
2.3 Market Breakdown and Data Triangulation
2.4 Assumptions for the Study
3 Executive Summary (Page No. - 33)
4 Premium Insights (Page No. - 38)
4.1 Bioprocess Validation Services: Market Overview
4.2 Asia Pacific: Bioprocess Validation Services Market, By End User (2018)
4.3 Geographical Snapshot of the Market
4.4 Regional Mix: Market
4.5 Bioprocess Validation Market: Developing vs Developed Countries
5 Market Overview (Page No. - 42)
5.1 Introduction
5.2 Market Dynamics: Impact Analysis
5.2.1 Drivers
5.2.1.1 Stringent Safety and Quality Regulations
5.2.1.2 Increasing Demand for Biopharmaceuticals
5.2.1.3 Increasing Demand for Outsourcing Bioprocess Validation
5.2.1.4 Rising Life Science R&D Expenditure
5.2.2 Restraints
5.2.2.1 Issues Related to Extractables & Leachables
5.2.3 Opportunities
5.2.3.1 Growth Opportunities in Asia Pacific and Latin American Countries
5.2.3.2 Patent Expiry
5.2.4 Challenges
5.2.4.1 Waste Disposal
5.2.4.2 Development of New Validation Methods for Next Generation Bioproducts
6 Industry Insights (Page No. - 48)
6.1 Industry Trends
6.1.1 Automation in Bioprocess Validation Services
6.1.2 Geographic Expansions By Market Players
6.2 Regulatory Guidelines for Bioprocess Validation
7 Bioprocess Validation Market, By Test Type (Page No. - 51)
7.1 Introduction
7.2 Extractables/Leachables Testing Services
7.2.1 Specifications and Guidelines for Extractables/ Leachables Testing have Ensured the Continued Demand for These Services
7.3 Microbiological Testing Services
7.3.1 Large-Scale Eukaryotic Cell Culture Testing Services
7.3.1.1 North America Shows the Highest Demand for Large-Scale Eukaryotic Cell Culture Testing Services
7.3.2 Virus Production & Purification Testing Services
7.3.2.1 Increased Concerns of Viral Contaminant Presence in Raw Materials are Driving the Adoption of Testing Services
7.3.3 Electron Microscopy Testing Services
7.3.3.1 Electron Microscopy Provides High-Resolution Images of Specimens Present in Bioprocesses
7.4 Physiochemical Testing Services
7.4.1 Need for Detection and Characterization of Impurities in the Final Product is Driving Market Growth
7.5 Integrity Testing Services
7.5.1 Integrity Testing is Vital to Detect Wear and Tear and Pressure-Caused Damage
7.6 Compatibility Testing Services
7.6.1 Demand for Evaluating Process Component-Formulation Interaction has Necessitated Compatibility Testing
7.7 Other Testing Services
8 Bioprocess Validation Market, By Process Component (Page No. - 66)
8.1 Introduction
8.2 Filter Elements
8.2.1 Stringent Regulations for Biopharmaceutical Products are Driving the Growth of This Segment
8.3 Media Containers and Bags
8.3.1 Validation and Qualification of Media Containers and Bags is Necessary to Maintain the Safety of the Final Biopharmaceutical Product
8.4 Freezing and Thawing Process Bags
8.4.1 The High Risk of Seal Leaks in the Pre-Freezing and Thawing Stage is Driving Market Growth
8.5 Mixing Systems
8.5.1 Growing Need to Meet FDA and Other Regulatory Guidelines During the Mixing of Ingredients to Maintain Product Quality is A Key Driver
8.6 Bioreactors
8.6.1 Biopharmaceutical Companies are Increasingly Adopting Bioprocess Validation Services for Bioreactors to Lower the Risk of Cross-Contamination
8.7 Transfer Systems
8.7.1 The Necessity to Maintain Sterile Conditions During Transfer is Driving the Market
8.8 Other Process Component
9 Bioprocess Validation Market, By End User (Page No. - 77)
9.1 Introduction
9.2 Pharmaceutical Companies
9.2.1 Increasing Production Volume has Enabled Pharma Companies to Dominate the End-User Market
9.3 Contract Development & Manufacturing Organizations
9.3.1 Emerging Countries have Become Key Hubs for the Outsourcing of Production and Validation Processes
9.4 Biotechnology Companies
9.4.1 Need for Regulatory Compliance has Driven the Demand for Bioprocess Validation in Biotech Companies
9.5 Other End Users
10 Bioprocess Validation Market, By Region (Page No. - 85)
10.1 Introduction
10.2 North America
10.2.1 US
10.2.1.1 US Dominated the North American Bioprocess Validation Market in 2018
10.2.2 Canada
10.2.2.1 Growing Investments in the Canadian Biopharmaceuticals Sector to Support Market Growth During the Forecast Period
10.3 Europe
10.3.1 Germany
10.3.1.1 Germany Accounted for the Largest Share of the European Bioprocess Validation Market in 2018
10.3.2 France
10.3.2.1 High Demand for Biologics and Implementation of Favorable Government Initiatives to Drive the Demand for Bioprocess Validation Services in France
10.3.3 UK
10.3.3.1 Growing Demand for Outsourcing Compliance-Related Testing Services in Biopharmaceutical Production to Support Market Growth in the UK
10.3.4 Italy
10.3.4.1 Growing Biopharmaceutical Manufacturing to Drive the Adoption of Bioprocess Validation Services in Italy
10.3.5 Spain
10.3.5.1 High Consumption of Biologics to Support the Growth of The Bioprocess Validation Market in Spain
10.3.6 Rest of Europe
10.4 Asia Pacific
10.4.1 China
10.4.1.1 China is One of the Most-Preferred Destinations for Leading Biopharmaceutical Companies for Biologics Production
10.4.2 Japan
10.4.2.1 Japan is One of the Largest and Most Established Markets for Pharmaceutical Products in the Asia Pacific
10.4.3 India
10.4.3.1 Rising Volume of Biopharmaceutical Production to Drive Market Growth in India
10.4.4 Rest of Asia Pacific
10.5 Latin America
10.5.1 Brazil
10.5.1.1 Growing Investments in Biopharmaceutical Research to Drive Market Growth in Brazil
10.5.2 Mexico
10.5.2.1 Strong Presence of Global Pharmaceutical Companies in the Country to Support Market Growth
10.5.3 Rest of Latin America
10.6 Middle East & Africa
11 Competitive Landscape (Page No. - 149)
11.1 Overview
11.2 Market Share Analysis
11.3 Competitive Leadership Mapping, 2018
11.4 Vendor Inclusion Criteria
11.5 Vendor Dive
11.5.1 Visionary Leaders
11.5.2 Innovators
11.5.3 Emerging Companies
11.5.4 Dynamic Differentiators
11.6 Competitive Situations and Trends
11.6.1 Acquisitions
11.6.2 Collaborations, Partnerships, and Agreements
11.6.3 Service Launches
11.7 Service Portfolio Analysis
11.7.1 Service Portfolio Analysis
12 Company Profiles (Page No. - 162)
(Business Overview, Services Offered, Recent Developments, MnM View, SWOT Analysis)*
12.1 Merck KGaA
12.2 Pall Corporation (A Part of Danaher Corporation)
12.3 Sartorius Stedim Biotech S.A.
12.4 SGS S.A.
12.5 Eurofins Scientific
12.6 Cobetter Filtration Equipment Co., Ltd.
12.7 Toxikon Corporation
12.8 Doc S.R.L.
12.9 Meissner Filtration Products, Inc.
12.10 Thermo Fisher Scientific, Inc.
12.11 Additional Company Profiles
12.11.1 Porvair PLC
12.11.2 Biozeen
12.11.3 Tianshan (Ts Filter) Precision Filter Material Co., Ltd.
12.11.4 Hangzhou Anow Microfiltration Co., Ltd.
12.11.5 Almac Group
*Business Overview, Services Offered, Recent Developments, MnM View, SWOT Analysis Might Not Be Captured in Case of Unlisted Companies.
13 Appendix (Page No. - 186)
13.1 Insights of Industry Experts
13.2 Discussion Guide
13.3 Knowledge Store: Marketsandmarkets’ Subscription Portal
13.4 Available Customizations
13.5 Related Reports
13.6 Author Details
List of Tables (137 Tables)
Table 1 Standard Currency Conversion Rates
Table 2 Bioprocess Validation Services Market Snapshot, 2019 vs 2024
Table 3 Typical Extractables for Acceptable Materials Used in Disposable Bioprocess Manufacturing Systems
Table 4 Comparison of Bioprocessing System Disposal Options
Table 5 Major Expansions in the Market (2016–2019)
Table 6 Regulations & Standards Governing Bioprocess Validation
Table 7 Market, By Test Type, 2017–2024 (USD Million)
Table 8 Key Providers of Extractables/Leachables Testing Services
Table 9 Extractables/Leachables Testing Services Market , By Country, 2017–2024 (USD Million)
Table 10 Key Providers of Microbiological Testing Services
Table 11 Microbiological Testing Services Market, By Type, 2017–2024 (USD Million)
Table 12 Microbiological Testing Services Market, By Country, 2017–2024 (USD Million)
Table 13 Large-Scale Eukaryotic Cell Culture Testing Services Market, By Country, 2017–2024 (USD Million)
Table 14 Virus Production & Purification Testing Services Market, By Country, 2017–2024 (USD Million)
Table 15 Electron Microscopy Testing Services Market, By Country, 2017–2024 (USD Million)
Table 16 Key Providers of Physiochemical Testing Services
Table 17 Physiochemical Testing Services Market , By Country, 2017–2024 (USD Million)
Table 18 Key Providers of Integrity Testing Services
Table 19 Integrity Testing Services Market, By Country, 2017–2024 (USD Million)
Table 20 Key Providers of Compatibility Testing Services
Table 21 Compatibility Testing Services Market , By Country, 2017–2024 (USD Million)
Table 22 Other Testing Services Market, By Country, 2017–2024 (USD Million)
Table 23 Bioprocess Validation Market, By Process Component, 2017–2024 (USD Million)
Table 24 Market for Filter Elements, By Country, 2017–2024 (USD Million)
Table 25 Market for Media Containers and Bags, By Country, 2017–2024 (USD Million)
Table 26 Market for Freezing and Thawing Process Bags, By Country, 2017–2024 (USD Million)
Table 27 Market for Mixing Systems, By Country, 2017–2024 (USD Million)
Table 28 Bioprocess Validation Market for Bioreactors, By Country, 2017–2024 (USD Million)
Table 29 Market for Transfer Systems, By Country, 2017–2024 (USD Million)
Table 30 Market for Other Process Components, By Country, 2017–2024 (USD Million)
Table 31 Market, By End User, 2017–2024 (USD Million)
Table 32 Bioprocess Validation Services Market for Pharmaceutical Companies, By Country, 2017–2024 (USD Million)
Table 33 Bioprocess Validation Market for Contract Development and Manufacturing Organization, By Country, 2017–2024 (USD Million)
Table 34 Bioprocess Validation Market for Biotechnology Companies, By Country, 2017–2024 (USD Million)
Table 35 Market for Other End Users, By Country, 2017–2024 (USD Million)
Table 36 Market, By Region, 2017–2024 (USD Million)
Table 37 North America: Market, By Country, 2017–2024 (USD Million)
Table 38 North America: Bioprocess Validation Market, By Test Type, 2017–2024 (USD Million)
Table 39 North America: Microbiological Testing Services Market, By Type, 2017–2024 (USD Million)
Table 40 North America: Market, By Process Component, 2017–2024 (USD Million)
Table 41 North America: Bioprocess Validation Services Market, By End User, 2017–2024 (USD Million)
Table 42 US: Key Macroindicators
Table 43 US: Market, By Test Type, 2017–2024 (USD Million)
Table 44 US: Microbiological Testing Services Market, By Type, 2017–2024 (USD Million)
Table 45 US: Market, By Process Component, 2017–2024 (USD Million)
Table 46 US: Market, By End User, 2017–2024 (USD Million)
Table 47 Canada: Key Macroindicators
Table 48 Canada: Market, By Test Type, 2017–2024 (USD Million)
Table 49 Canada: Microbiological Testing Services Market, By Type, 2017–2024 (USD Million)
Table 50 Canada: Market, By Process Component, 2017–2024 (USD Million)
Table 51 Canada: Market, By End User, 2017–2024 (USD Million)
Table 52 Europe: Market, By Country, 2017–2024 (USD Million)
Table 53 Europe: Market, By Test Type, 2017–2024 (USD Million)
Table 54 Europe: Microbiological Testing Services Market, By Type, 2017–2024 (USD Million)
Table 55 Europe: Market, By Process Component, 2017–2024 (USD Million)
Table 56 Europe: Market, By End User, 2017–2024 (USD Million)
Table 57 Germany: Key Macroindicators
Table 58 Germany: Bioprocess Validation Market, By Test Type, 2017–2024 (USD Million)
Table 59 Germany: Microbiological Testing Services Market, By Type, 2017–2024 (USD Million)
Table 60 Germany: Market, By Process Component, 2017–2024 (USD Million)
Table 61 Germany: Market, By End User, 2017–2024 (USD Million)
Table 62 France: Key Macroindicators
Table 63 France: Market, By Test Type, 2017–2024 (USD Million)
Table 64 France: Microbiological Testing Services Market, By Type, 2017–2024 (USD Million)
Table 65 France: Market, By Process Component, 2017–2024 (USD Million)
Table 66 France: Market, By End User, 2017–2024 (USD Million)
Table 67 UK: Key Macroindicators
Table 68 UK: Market, By Test Type, 2017–2024 (USD Million)
Table 69 UK: Microbiological Testing Services Market, By Type, 2017–2024 (USD Million)
Table 70 UK: Bioprocess Validation Market, By Process Component, 2017–2024 (USD Million)
Table 71 UK: Market, By End User, 2017–2024 (USD Million)
Table 72 Italy: Key Macroindicators
Table 73 Italy: Market, By Test Type, 2017–2024 (USD Million)
Table 74 Italy: Microbiological Testing Services Market, By Type, 2017–2024 (USD Million)
Table 75 Italy: Market, By Process Component, 2017–2024 (USD Million)
Table 76 Italy: Market, By End User, 2017–2024 (USD Million)
Table 77 Spain: Key Macroindicators
Table 78 Spain: Bioprocess Validation Services Market, By Test Type, 2017–2024 (USD Million)
Table 79 Spain: Microbiological Testing Services Market, By Type, 2017–2024 (USD Million)
Table 80 Spain: Market, By Process Component, 2017–2024 (USD Million)
Table 81 Spain: Market, By End User, 2017–2024 (USD Million)
Table 82 RoE: Bioprocess Validation Market, By Test Type, 2017–2024 (USD Million)
Table 83 RoE: Microbiological Testing Services Market, By Type, 2017–2024 (USD Million)
Table 84 RoE: Market, By Process Component, 2017–2024 (USD Million)
Table 85 RoE: Market, By End User, 2017–2024 (USD Million)
Table 86 APAC: Market, By Country, 2017–2024 (USD Million)
Table 87 APAC: Market, By Test Type, 2017–2024 (USD Million)
Table 88 APAC: Microbiological Testing Services Market, By Type, 2017–2024 (USD Million)
Table 89 APAC: Market, By Process Component, 2017–2024 (USD Million)
Table 90 APAC: Bioprocess Validation Market, By End User, 2017–2024 (USD Million)
Table 91 China: Key Macroindicators
Table 92 China: Market, By Test Type, 2017–2024 (USD Million)
Table 93 China: Microbiological Testing Services Market, By Type, 2017–2024 (USD Million)
Table 94 China: Market, By Process Component, 2017–2024 (USD Million)
Table 95 China: Market, By End User, 2017–2024 (USD Million)
Table 96 Japan: Key Macroindicators
Table 97 Japan: Market, By Test Type, 2017–2024 (USD Million)
Table 98 Japan: Microbiological Testing Services Market, By Type, 2017–2024 (USD Million)
Table 99 Japan: Market, By Process Component, 2017–2024 (USD Million)
Table 100 Japan: Bioprocess Validation Market, By End User, 2017–2024 (USD Million)
Table 101 India: Key Macroindicators
Table 102 India: Market, By Test Type, 2017–2024 (USD Million)
Table 103 India: Microbiological Testing Services Market, By Type, 2017–2024 (USD Million)
Table 104 India: Market, By Process Component, 2017–2024 (USD Million)
Table 105 India: Market, By End User, 2017–2024 (USD Million)
Table 106 RoAPAC: Market, By Test Type, 2017–2024 (USD Million)
Table 107 RoAPAC: Microbiological Testing Services Market, By Type, 2017–2024 (USD Million)
Table 108 RoAPAC: Market, By Process Component, 2017–2024 (USD Million)
Table 109 RoAPAC: Bioprocess Validation Market, By End User, 2017–2024 (USD Million)
Table 110 Latin America: Market, By Country, 2017–2024 (USD Million)
Table 111 Latin America: Market, By Test Type, 2017–2024 (USD Million)
Table 112 Latin America: Microbiological Testing Services Market, By Type, 2017–2024 (USD Million)
Table 113 Latin America: Market, By Process Component, 2017–2024 (USD Million)
Table 114 Latin America: Market, By End User, 2017–2024 (USD Million)
Table 115 Brazil: Key Macroindicators
Table 116 Brazil: Market, By Test Type, 2017–2024 (USD Million)
Table 117 Brazil: Microbiological Testing Services Market, By Type, 2017–2024 (USD Million)
Table 118 Brazil Market, By Process Component, 2017–2024 (USD Million)
Table 119 Brazil: Market, By End User, 2017–2024 (USD Million)
Table 120 Mexico: Key Macroindicators
Table 121 Mexico: Bioprocess Validation Market, By Test Type, 2017–2024 (USD Million)
Table 122 Mexico: Microbiological Testing Services Market, By Type, 2017–2024 (USD Million)
Table 123 Mexico: Market, By Process Component, 2017–2024 (USD Million)
Table 124 Mexico: Market, By End User, 2017–2024 (USD Million)
Table 125 RoLA: Market, By Test Type, 2017–2024 (USD Million)
Table 126 RoLA: Microbiological Testing Services Market, By Type, 2017–2024 (USD Million)
Table 127 RoLA: Market, By Process Component, 2017–2024 (USD Million)
Table 128 RoLA: Market, By End User, 2017–2024 (USD Million)
Table 129 MEA: Market, By Test Type, 2017–2024 (USD Million)
Table 130 MEA: Microbiological Testing Services Market, By Type, 2017–2024 (USD Million)
Table 131 MEA: Bioprocess Validation Market, By Process Component, 2017–2024 (USD Million)
Table 132 MEA: Market, By End User, 2017–2024 (USD Million)
Table 133 Growth Strategy Matrix (2015–2018)
Table 134 Expansions, 2016–2019
Table 135 Acquisitions, 2016–2019
Table 136 Collaborations, Partnerships, and Agreements, 2016–2019
Table 137 Service Launches, 2016–2019
List of Figures (35 Figures)
Figure 1 Research Design
Figure 2 Primary Sources
Figure 3 Breakdown of Primary Interviews (Supply Side): By Company Type, Designation, and Region
Figure 4 Breakdown of Primary Interviews (Demand Side): By End User and Region
Figure 5 Bottom-Up Approach
Figure 6 Top-Down Approach
Figure 7 Data Triangulation Methodology
Figure 8 Bioprocess Validation Market, By Test Type, 2019 vs 2024 (USD Million)
Figure 9 Microbiological Testing Services Market, By Type, 2019 vs 2024 (USD Million)
Figure 10 Market, By Process Component, 2019 vs 2024 (USD Million)
Figure 11 Market, By End User, 2019 vs 2024 (USD Million)
Figure 12 Geographical Snapshot of the Market
Figure 13 Increasing Number of Stringent Safety and Quality Regulations in the Biopharmaceutical Industry is Driving Market Growth
Figure 14 Pharmaceutical Companies Commanded the Largest Share of the APAC Market in 2018
Figure 15 China is Estimated to Grow at A Highest CAGR During the Forecast Period
Figure 16 Asia Pacific Market to Witness the Highest Growth in the Forecast Period
Figure 17 Developing Countries to Register Higher Growth During the Forecast Period
Figure 18 US: Biologics Going Off-Patent in the Coming Years
Figure 19 Extractables/Leachables Testing Services to Witness High Growth in the Market During the Forecast Period
Figure 20 Large-Scale Eukaryotic Cell Culture Services to Witness High Growth in the Market During the Forecast Period
Figure 21 Filter Elements Segment to Witness the Highest Growth in the Bioprocess Validation Services Market During the Forecast Period
Figure 22 Pharmaceutical Companies to Witness the Highest Growth During the Forecast Period
Figure 23 Geographic Snapshot: Markets in Asia Pacific are Emerging Hotspots
Figure 24 North America: Market Snapshot
Figure 25 Europe: Market Snapshot
Figure 26 APAC: Market Snapshot
Figure 27 Key Developments of Major Players Between January 2016 and February 2019
Figure 28 Market Share Analysis, By Key Player, 2018
Figure 29 Competitive Leadership Mapping, Market (2019)
Figure 30 Expansions Was the Key Growth Strategy Adopted By Major Players Between 2016 & 2019
Figure 31 Merck KGaA: Company Snapshot
Figure 32 Sartorius Stedim Biotech S.A.: Company Snapshot
Figure 33 SGS S.A.: Company Snapshot
Figure 34 Eurofins Scientific: Company Snapshot
Figure 35 Thermo Fisher Scientific: Company Snapshot
This study involved the extensive use of primary and secondary sources and involved an in-depth analysis of the various factors affecting the growth of the global bioprocess validation market. Both primary and secondary research was used to identify the segmentation types, trends, key players, key market dynamics, and key player strategies as well as derive the competitive leadership mapping and competitive landscape in this market.
Secondary Research
The secondary research process involved the widespread use of secondary sources, directories, databases (such as Bloomberg Businessweek, Factiva, and D&B Hoovers), white papers, annual reports, company house documents, investor presentations, and SEC filings of companies. Secondary research was used to identify and collect information useful for the extensive, technical, market-oriented, and commercial study of the bioprocess validation market. It was also used to obtain important information about the key players and market classification & segmentation according to industry trends to the bottom-most level, and key developments related to market and technology perspectives. A database of the key industry leaders was also prepared using secondary research.
Primary Research
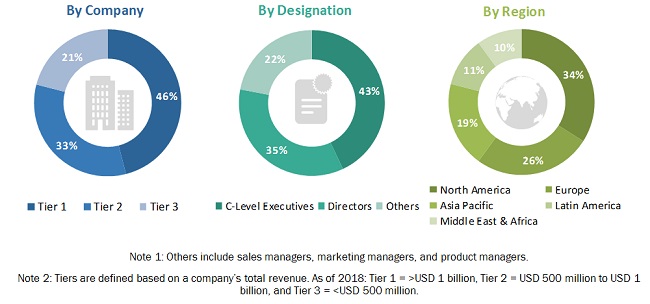
In the primary research process, industry experts from both the supply and demand sides were interviewed to obtain qualitative and quantitative information for this report. Industry experts from the supply side include suppliers, distributors, CEOs, vice presidents, marketing and sales directors, business development managers, and technology and innovation directors of bioprocess validation providers; whereas, industry experts from the demand side include company vice presidents, c-level executives, service managers, laboratory specialists, pharmaceutical & biotechnology manufacturers, pharmaceutical firm R&D heads, research scientists, and other-related key opinion leaders.
A breakdown of the primary respondents is provided below:
To know about the assumptions considered for the study, download the pdf brochure
Market Size Estimation
The market size estimates and forecasts provided in this study are derived through a mix of the bottom-up approach (revenue share analysis of leading players) and the top-down approach (assessment of utilization/adoption/penetration trends, by test type, process component, end-user, and region).
Data Triangulation
After arriving at the market size, the total bioprocess validation market was divided into several segments and subsegments. Data triangulation and market breakdown procedures were employed, wherever applicable, to complete the overall market engineering process and arrive at the exact statistics for all segments & subsegments.
Objectives of the Study
- To define, describe, and forecast the bioprocess validation services market based on test type, process component, end-user, and region.
- To provide detailed information regarding the factors influencing market growth (such as drivers, restraints, opportunities, challenges, and industry trends)
- To analyze micromarkets1 with respect to individual growth trends, prospects, and contributions to the overall bioprocess validation services market.
- To analyze market opportunities for stakeholders and provide details of the competitive landscape for key players operating in this market.
- To strategically profile the key players in the bioprocess validation services market and comprehensively analyze their market shares and core competencies2
- To strategically analyze five different geographical regions, namely, North America, Europe, Asia Pacific, Latin America, and the Middle East & Africa.
- To track and analyze competitive developments such as joint ventures & acquisitions; product developments and enhancements; agreements & partnerships; expansions; and funding activities in the bioprocess validation services market.
Available Customizations
With the given market data, MarketsandMarkets offers customizations as per the company’s specific needs. The following customization options are available for the report:
Company Information
- Detailed analysis and profiling of additional market players
Geographic Analysis
- A further breakdown of the Rest of Asia Pacific bioprocess validation market into South Korea, Australia, New Zealand, and others
- A further breakdown of the bioprocess validation market in the Rest of Latin America into Argentina, Chile, Peru, Colombia, and others

 Generating Response ...


Growth opportunities and latent adjacency in Bioprocess Validation Market