Thawing System Market by Type (Manual, Automated), Sample (Blood, Plasma, RBC, Platelets, Whole Blood, Embryo, Semen), End User (Blood Bank, Transfusion Center, Hospital, Tissue Bank, Biotechnology & Pharmaceutical) & Geography - Global Forecast to 2022


The global thawing system market is projected to grow at a CAGR of 12.6%. The market growth is primarily driven by the growing incidence of chronic diseases and technological advancements in thawing devices.
The objectives of this study are as follows:
- To define, describe, and forecast the thawing system market on the basis of type, sample type, end user, and region
- To forecast revenue of the market segments with respect to four main regional segments, namely, North America, Europe, Asia Pacific, and the Rest of the World (RoW)
- To identify the micromarkets with respect to drivers, restraints, industry-specific challenges, opportunities, and trends affecting the growth of the market
- To strategically analyze market segments and subsegments with respect to individual growth trends, prospects, and contributions to the overall market
- To analyze the opportunities in the market for stakeholders and provide details of the competitive landscape for market leaders
- To profile the key players and comprehensively analyze their market shares and core competencies in terms of market developments and growth strategies
- To track and analyze competitive developments such as partnerships, agreements, collaborations, and joint ventures; mergers and acquisitions; product launches; and research and development activities in the thawing system market
Research Methodology
Top-down and bottom-up approaches were used to estimate and validate the size of the market and to estimate the size of various other dependent submarkets. The overall market size was used in the top-down approach to estimate the sizes of other individual submarkets (mentioned in the market segmentation by type, sample type, end user, and region) through percentage splits from secondary and primary research. The bottom-up approach was also implemented (wherever applicable) for data extracted from secondary research to validate the market segment revenues obtained. Various secondary sources such as World Health Organization (WHO), National Center for Biotechnology Information (NCBI), National Institutes of Health (NIH), International Society for Biological and Environmental Repositories (ISBER), Biobanking and Molecular Resource Infrastructure - European Research Infrastructure Consortium (BBMRI-ERIC), Middle Eastern & African Society for Biopreservation and Biobanking (ESBB), Nature (Journal), World Bank, Genome Medicine, International Society of Blood Transfusion (ISBT), Cord Blood Industry Report, American Red Cross (ARC), AABB Publications, and PubMedhave been used to identify and collect information useful for this extensive commercial study of the thawing system market. Primary sources such as experts from related industries and suppliers have been interviewed to obtain and verify critical information as well as to assess prospects of the thawing system market. The breakdown of profiles of primaries is shown in the figure below:
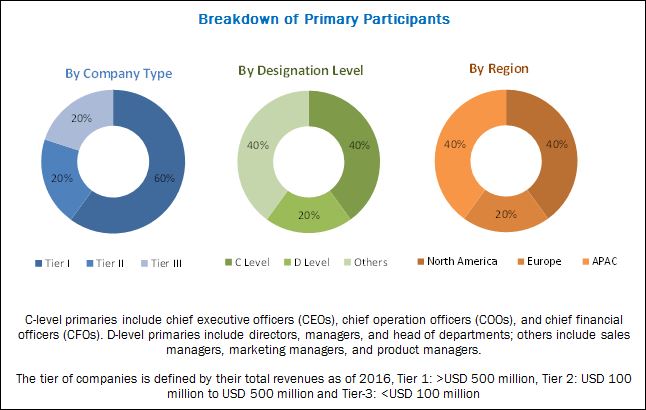
To know about the assumptions considered for the study, download the pdf brochure
The key players in the thawing system market include Helmer Scientific (US), Boekel Scientific (US), Sarstedt(Germany), Barkey (Germany), BioCision (US), Cardinal Health (US), Sartorius (Germany), GE Healthcare (US), Thermo Fisher Scientific (US), and CytoTherm (US).
Target Audience for this Report:
- Manufacturers and vendors of sample thawing devices
- Research associations related to blood-based diseases
- Pathologists and pathology laboratories
- Various research and consulting firms
- Distributors of sample thawing devices
- Contract research manufacturers of sample thawing devices
- Healthcare institutions
- Biobanks and blood transfusion centers
- In vitro fertilization (IVF) centers
- Research institutes
Scope of the Report:
This report categorizes the thawing system market into the following segments:
By Type
- Manual
- Automated
By Sample Type
-
Blood
- Plasma
- Stem Cells
- Whole Blood & RBCs
- Platelets
- Embryo
- Ovum
- Semen
- Other Samples
By End User
- Blood Banks & Transfusion Centers
- Hospitals & Diagnostic Laboratories
- Cord Blood & Stem Cell Banks
- Research & Academic Institutes
- Biotechnology & Pharmaceutical Companies
- Tissue Banks
By Region
-
North America
- US
- Canada
-
Europe
- Germany
- France
- UK
- Rest of Europe
-
Asia Pacific
- Japan
- China
- India
- Rest of Asia Pacific
- Rest of the World
Customization Options:
- Company Information: Detailed company profiles of five or more market players
- Opportunities Assessment: A detailed report underlining the various growth opportunities presented in the market
The global thawing system market is segmented by type, sample type, end user, and region. By type, the thawing system market is segmented into manual and automated devices. The manual devices segment is estimated to account for the largest market share of the global thawing system market in 2017. Factors driving the growth of this segment include the widespread use of manual devices and their low costs.
By sample type, the market is classified into blood, embryo, ovum, semen, and other samples. The blood segment is estimated to account for the largest share of the global thawing system market. The large share of this segment can be attributed to the increasing demand of blood and blood products and rising incidence of chronic diseases around the globe.
On the basis of end user, the thawing system market is segmented into blood banks and transfusion centers; hospitals and diagnostics laboratories; cord blood and stem cell banks; research and academic institutes; biotechnology and pharmaceutical companies; and tissue banks. The blood banks and transfusion centers segment is estimated to account for the largest share of the global thawing system market. Growth in the number of blood banks coupled with better accessibility and availability of blood samples in blood banks are major factors driving the growth of this end-user segment.
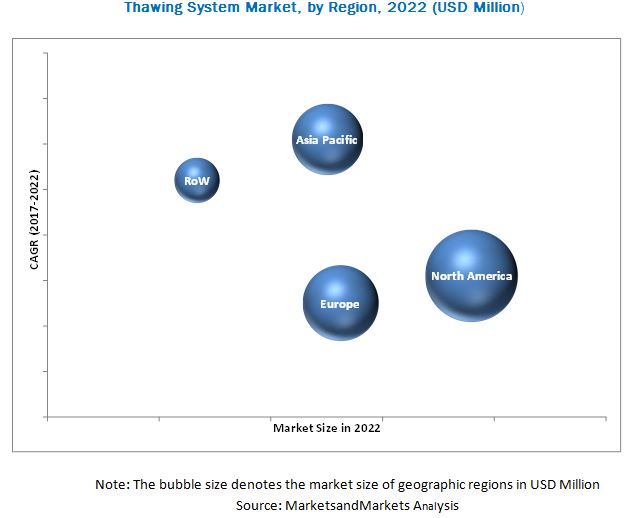
The global thawing system market is dominated by North America, followed by Europe. North America will continue to dominate the global thawing system market in the forecast period. However, Asia Pacific is expected to witness the highest CAGR, with the growth in this market centered in Japan, China, and India. Factors such as rising focus of major players in emerging Asian countries and government support are driving the growth of the thawing system market in this region.
The factors such as the high degree of consolidation, high cost of devices, and complex regulatory framework for the approval of new products may restrain the market’s growth to a certain extent.
Major industry players launched innovative products to maintain and improve their position in the thawing system market. Helmer Scientific (US), Sarstedt (Germany), Sartorius (Germany), BioCision (US), and Boekel Scientific (US) have been identified as the key players in this market. These companies have a broad product portfolio with comprehensive features and have also launched innovative products. These leaders also have products for all end users in this market, a strong geographical presence, and they focus on continuous product innovations.
To speak to our analyst for a discussion on the above findings, click Speak to Analyst
 Exclusive indicates content/data unique to MarketsandMarkets and not available with any competitors.
Table of Contents
1 Introduction (Page No. - 15)
1.1 Objectives of the Study
1.2 Market Definition
1.3 Market Scope
1.3.1 Markets Covered
1.3.2 Years Considered for the Study
1.4 Currency
1.5 Limitations
1.6 Stakeholders
2 Research Methodology (Page No. - 19)
2.1 Research Data
2.1.1 Secondary Data
2.1.1.1 Key Data From Secondary Sources
2.1.2 Primary Data
2.1.2.1 Key Data From Primary Sources
2.1.2.2 Breakdown of Primaries
2.2 Market Size Estimation
2.2.1 Bottom-Up Approach
2.2.2 Top-Down Approach
2.3 Market Breakdown and Data Triangulation
2.4 Assumptions for the Study
3 Executive Summary (Page No. - 27)
4 Premium Insights (Page No. - 32)
4.1 Sample Thawing Devices: Market Overview
4.2 Asia Pacific: Sample Thawing Devices Market, By Sample Type
4.3 Sample Thawing Devices Market, By End User
4.4 Geographical Snapshot of the Global Sample Thawing Devices Market
5 Market Overview (Page No. - 36)
5.1 Introduction
5.2 Market Dynamics
5.2.1 Drivers
5.2.1.1 Rising Focus of Biorepositories on Expanding Their Storage Capacities
5.2.1.2 Technological Advancements in Sample Thawing Devices
5.2.1.3 Rising Use of Thawed Cells in the Study and Treatment of Diabetes and Cancer
5.2.1.3.1 Applications in Diabetes Nonuclear Cells (PBMCS) are Used in Cell-Based Assays and Flow Cytometry Assays, Which Helps in Monitoring the Immune Response.
5.2.1.3.2 Applications in Cancer Treatment
5.2.1.4 Growing Number of Road Accidents, Emergencies, and Trauma Cases Necessitating Blood Transfusions and Cryopreserved Blood Products
5.2.2 Restraints
5.2.2.1 High Cost of Automation
5.2.3 Opportunities
5.2.3.1 Growing Focus on the Research and Development of Cell Therapies
5.2.3.2 Emerging Economies Present Significant Growth Opportunities
5.2.4 Challenges
5.2.4.1 Issues Related to Biospecimen Sample Procurement
5.2.5 Trends
5.2.5.1 Growing Trend of Conserving Cord Blood Stem Cells of Newborns
6 Industry Insights (Page No. - 44)
6.1 Sample Thawing Devices Regulatory Outlook
6.1.1 North America
6.1.1.1 US
6.1.1.2 Canada
6.1.2 Europe
6.1.3 Asia Pacific
6.1.3.1 Japan
6.1.3.2 China
6.1.3.3 India
6.1.3.4 South Korea
6.1.4 Rest of the World
6.1.4.1 Latin America
6.1.4.1.1 Mexico
6.1.4.1.2 Brazil
6.2 Sample Thawing Devices Pricing Analysis
6.3 Number of End User Facilities, By Type
6.4 List of Major End Users
6.4.1 North America
6.4.1.1 Blood Banks & Transfusion Centers
6.4.1.2 Hospitals & Healthcare Facilities
6.4.1.3 Cord Blood & Stem Cell Banks
6.4.2 Europe
6.4.2.1 Blood Banks & Transfusion Centers
6.4.2.2 Hospitals & Healthcare Facilities
6.4.2.3 Cord Blood & Stem Cell Banks
6.4.3 Asia Pacific
6.4.3.1 Blood Banks & Transfusion Centers
6.4.3.2 Hospitals & Healthcare Facilities
6.4.3.3 Cord Blood & Stem Cell Banks
7 Sample Thawing Devices Market, By Type (Page No. - 60)
7.1 Introduction
7.2 Manual Devices
7.3 Automated Devices
8 Sample Thawing Devices Market, By Sample Type (Page No. - 64)
8.1 Introduction
8.2 Blood
8.2.1 Plasma
8.2.2 Stem Cells
8.2.3 Whole Blood & Red Blood Cells
8.2.4 Platelets
8.3 Embryos
8.4 Ovum
8.5 Semen
8.6 Other Samples
9 Sample Thawing Devices Market, By End User (Page No. - 76)
9.1 Introduction
9.2 Blood Banks & Transfusion Centers
9.3 Hospitals & Diagnostic Laboratories
9.4 Cord Blood and Stem Cell Banks
9.5 Research & Academic Institutes
9.6 Biotechnology & Pharmaceutical Companies
9.7 Tissue Banks
10 Sample Thawing Devices Market, By Region (Page No. - 84)
10.1 Introduction
10.2 North America
10.2.1 US
10.2.2 Canada
10.3 Europe
10.3.1 France
10.3.2 Germany
10.3.3 UK
10.3.4 Rest of Europe (RoE)
10.4 Asia Pacific
10.4.1 China
10.4.2 India
10.4.3 Japan
10.4.4 Rest of Asia Pacific (RoAPAC)
10.5 Rest of the World (RoW)
11 Competitive Landscape (Page No. - 134)
11.1 Overview
11.2 Market Ranking Analysis
11.3 Competitive Scenario
11.3.1 Agreements, Collaborations, and Partnerships
11.3.2 Geographical Expansions
11.3.3 Product Launches
11.3.4 Acquisitions
12 Company Profiles (Page No. - 138)
(Overview, Strength of Product Portfolio, Business Strategy Excellence, Products Offering, and Recent Developments)*
12.1 Helmer Scientific
12.2 Sarstedt
12.3 Sartorius
12.4 Biocision
12.5 Boekel Scientific
12.6 Barkey
12.7 Cardinal Health
12.8 GE Healthcare
12.9 Thermo Fisher Scientific
12.10 Cytotherm
*Details on Overview, Strength of Product Portfolio, Business Strategy Excellence, Products Offering, and Recent Developments Might Not Be Captured in Case of Unlisted Companies.
13 Appendix (Page No. - 157)
13.1 Industry Insights
13.2 Discussion Guide
13.3 Knowledge Store: Marketsandmarkets’ Subscription Portal
13.4 Introducing RT: Real-Time Market Intelligence
13.5 Available Customizations
13.6 Related Reports
13.7 Author Details
List of Tables (98 Tables)
Table 1 Sample Thawing Devices: Market Snapshot
Table 2 Stored Samples in Major Biorepositories Till Date
Table 3 Global Cancer Cases, By Type (2012, 2015, & 2035)
Table 4 Cell & Gene Therapy Products in Clinical Trials, 2016
Table 5 Prices of Sample Thawing Devices, Price/Unit/USD
Table 6 Number of End User Facilities, By Type - 2016
Table 7 Number of Blood Banks and Transfusion Centers, By Region - 2016
Table 8 Number of Hospitals & Healthcare Facilities, By Region - 2016
Table 9 Number of Cord Blood & Stem Cell Banks, By Region - 2016
Table 10 List of Major Blood Banks & Transfusion Centers
Table 11 List of Major Blood Banks & Transfusion Centers & Agencies
Table 12 List of Major Blood Banks & Transfusion Centers & Agencies
Table 13 Sample Thawing Devices Market, By Type, 2015–2022 (USD Million)
Table 14 Manual Sample Thawing Devices Market, By Region, 2015–2022 (USD Million)
Table 15 Automated Sample Thawing Devices Market, By Region, 2015–2022 (USD Million)
Table 16 Sample Thawing Devices Market, By Sample Type, 2015–2022 (USD Million)
Table 17 Blood Thawing Devices Market, By Sample Type, 2015–2022 (USD Million)
Table 18 Blood Thawing Devices Market, By Region, 2015–2022 (USD Million)
Table 19 Plasma Thawing Devices Market, By Region, 2015–2022 (USD Million)
Table 20 Stem Cell Thawing Devices Market, By Region, 2015–2022 (USD Million)
Table 21 Whole Blood & Red Blood Cell Thawing Devices Market, By Region, 2015–2022 (USD Million)
Table 22 Platelet Thawing Devices Market, By Region, 2015–2022 (USD Million)
Table 23 Embryo Thawing Devices Market, By Region, 2015–2022 (USD Million)
Table 24 Ovum Thawing Devices Market, By Region, 2015–2022 (USD Million)
Table 25 Semen Thawing Devices Market, By Region, 2015–2022 (USD Million)
Table 26 Other Sample Thawing Devices Market, By Region, 2015–2022 (USD Million)
Table 27 Sample Thawing Devices Market, By End User, 2015–2022 (USD Million)
Table 28 Sample Thawing Devices Market for Blood Banks and Transfusion Centers, By Region, 2015–2022 (USD Million)
Table 29 Sample Thawing Devices Market for Hospitals & Diagnostic Laboratories, By Region, 2015–2022 (USD Million)
Table 30 Sample Thawing Devices Market for Cord Blood and Stem Cell Banks, By Region, 2015–2022 (USD Million)
Table 31 Sample Thawing Devices Market for Research & Academic Institutes, By Region, 2015–2022 (USD Million)
Table 32 Sample Thawing Devices Market for Biotechnology and Pharmaceutical Companies, By Region, 2015–2022 (USD Million)
Table 33 Sample Thawing Devices Market for Tissue Banks, By Region, 2015–2022 (USD Million)
Table 34 Sample Thawing Devices Market, By Region, 2015–2022 (USD Million)
Table 35 North America: Sample Thawing Devices Market, By Country, 2015–2022 (USD Million)
Table 36 North America: Sample Thawing Devices Market, By Type, 2015–2022 (USD Million)
Table 37 North America: Sample Thawing Devices Market, By Sample Type, 2015–2022 (USD Million)
Table 38 North America: Blood Thawing Devices Market, By Sample Type, 2015–2022 (USD Million)
Table 39 North America: Sample Thawing Devices Market, By End User, 2015–2022 (USD Million)
Table 40 US: Sample Thawing Devices Market, By Type, 2015–2022 (USD Million)
Table 41 US: Sample Thawing Devices Market, By Sample Type, 2015–2022 (USD Million)
Table 42 US: Blood Thawing Devices Market, By Sample Type, 2015–2022 (USD Million)
Table 43 US: Sample Thawing Devices Market, By End User, 2015–2022 (USD Million)
Table 44 Canada: Sample Thawing Devices Market, By Type, 2015–2022 (USD Million)
Table 45 Canada: Sample Thawing Devices Market, By Sample Type, 2015–2022 (USD Million)
Table 46 Canada: Blood Thawing Devices Market, By Sample Type, 2015–2022 (USD Million)
Table 47 Canada: Sample Thawing Devices Market, By End User, 2015–2022 (USD Million)
Table 48 Europe: Sample Thawing Devices Market, By Country/Region, 2015–2022 (USD Million)
Table 49 Europe: Sample Thawing Devices Market, By Type, 2015–2022 (USD Million)
Table 50 Europe: Sample Thawing Devices Market, By Sample Type, 2015–2022 (USD Million)
Table 51 Europe: Blood Thawing Devices Market, By Sample Type, 2015–2022 (USD Million)
Table 52 Europe: Sample Thawing Devices Market, By End User, 2015–2022 (USD Million)
Table 53 France: Sample Thawing Devices Market, By Type, 2015–2022 (USD Million)
Table 54 France: Sample Thawing Devices Market, By Sample Type, 2015–2022 (USD Million)
Table 55 France: Blood Thawing Devices Market, By Sample Type, 2015–2022 (USD Million)
Table 56 France: Sample Thawing Devices Market, By End User, 2015–2022 (USD Million)
Table 57 Germany: Sample Thawing Devices Market, By Type, 2015–2022 (USD Million)
Table 58 Germany: Sample Thawing Devices Market, By Sample Type, 2015–2022 (USD Million)
Table 59 Germany: Blood Thawing Devices Market, By Sample Type, 2015–2022 (USD Million)
Table 60 Germany: Sample Thawing Devices Market, By End User, 2015–2022 (USD Million)
Table 61 UK: Sample Thawing Devices Market, By Type, 2015–2022 (USD Million)
Table 62 UK: Sample Thawing Devices Market, By Sample Type, 2015–2022 (USD Million)
Table 63 UK: Blood Thawing Devices Market, By Sample Type, 2015–2022 (USD Million)
Table 64 UK: Sample Thawing Devices Market, By End User, 2015–2022 (USD Million)
Table 65 RoE: Sample Thawing Devices Market, By Type, 2015–2022 (USD Million)
Table 66 RoE: Sample Thawing Devices Market, By Sample Type, 2015–2022 (USD Million)
Table 67 RoE: Blood Thawing Devices Market, By Sample Type, 2015–2022 (USD Million)
Table 68 RoE: Sample Thawing Devices Market, By End User, 2015–2022 (USD Million)
Table 69 Asia Pacific: Sample Thawing Devices Market, By Country/Region, 2015–2022 (USD Million)
Table 70 Asia Pacific: Sample Thawing Devices Market, By Type, 2015–2022 (USD Million)
Table 71 Asia Pacific: Sample Thawing Devices Market, By Sample Type, 2015–2022 (USD Million)
Table 72 Asia Pacific: Blood Thawing Devices Market, By Sample Type, 2015–2022 (USD Million)
Table 73 Asia Pacific: Sample Thawing Devices Market, By End User, 2015–2022 (USD Million)
Table 74 China: Sample Thawing Devices Market, By Type, 2015–2022 (USD Million)
Table 75 China: Sample Thawing Devices Market, By Sample Type, 2015–2022 (USD Million)
Table 76 China: Blood Thawing Devices Market, By Sample Type, 2015–2022 (USD Million)
Table 77 China: Sample Thawing Devices Market, By End User, 2015–2022 (USD Million)
Table 78 India: Sample Thawing Devices Market, By Type, 2015–2022 (USD Million)
Table 79 India: Sample Thawing Devices Market, By Sample Type, 2015–2022 (USD Million)
Table 80 India: Blood Thawing Devices Market, By Sample Type, 2015–2022 (USD Million)
Table 81 India: Sample Thawing Devices Market, By End User, 2015–2022 (USD Million)
Table 82 Japan: Sample Thawing Devices Market, By Type, 2015–2022 (USD Million)
Table 83 Japan: Sample Thawing Devices Market, By Sample Type, 2015–2022 (USD Million)
Table 84 Japan: Blood Thawing Devices Market, By Sample Type, 2015–2022 (USD Million)
Table 85 Japan: Sample Thawing Devices Market, By End User, 2015–2022 (USD Million)
Table 86 RoAPAC: Sample Thawing Devices Market, By Type, 2015–2022 (USD Million)
Table 87 RoAPAC: Sample Thawing Devices Market, By Sample Type, 2015–2022 (USD Million)
Table 88 RoAPAC: Blood Thawing Devices Market, By Sample Type, 2015–2022 (USD Million)
Table 89 RoAPAC: Sample Thawing Devices Market, By End User, 2015–2022 (USD Million)
Table 90 RoW: Sample Thawing Devices Market, By Type, 2015–2022 (USD Million)
Table 91 RoW: Sample Thawing Devices Market, By Sample Type, 2015–2022 (USD Million)
Table 92 RoW: Blood Thawing Devices Market, By Sample Type, 2015–2022 (USD Million)
Table 93 RoW: Sample Thawing Devices Market, By End User, 2015–2022 (USD Million)
Table 94 Top 5 Companies in Sample Thawing Devices Market
Table 95 Agreements, Collaboration, and Partnerships, 2014–2017
Table 96 Geographical Expansions, 2014–2017
Table 97 Product Launches, 2014–2017
Table 98 Acquisitions, 2014–2017
List of Figures (31 Figures)
Figure 1 Research Design
Figure 2 Market Size Estimation Methodology: Bottom-Up Approach
Figure 3 Market Size Estimation Methodology: Top-Down Approach
Figure 4 Data Triangulation Methodology
Figure 5 Sample Thawing Devices Market, By Type, 2017 vs 2022 (USD Million)
Figure 6 Sample Thawing Devices Market, By Sample Type, 2017 vs 2022 (USD Million)
Figure 7 Sample Thawing Devices Market, By End User, 2017 vs 2022 (USD Million)
Figure 8 Sample Thawing Devices Market, By Region, 2017 vs 2022 (USD Million)
Figure 9 Rising Focus of Biorepositories on Expanding Their Storage Capacities to Drive the Growth of the Sample Thawing Devices Market During the Forecast Period
Figure 10 Blood Samples to Account for the Largest Market Share in 2017
Figure 11 Blood Banks & Transfusion Centers to Register the Highest CAGR During the Forecast Period
Figure 12 India to Register the Highest CAGR During the Forecast Period
Figure 13 Sample Thawing Devices Market: Drivers, Restraints, Opportunities, Challenges, and Trends
Figure 14 Global Diabetes Cases, 2015 vs 2040 (Million)
Figure 15 Manual Devices Segment to Dominate the Global Sample Thawing Devices Market in 2017
Figure 16 Blood Samples to Register the Highest Growth Rate During the Forecast Period
Figure 17 Plasma Samples Segment Will Continue to Dominate the Blood Thawing Devices Market in 2022
Figure 18 Blood Banks & Transfusion Centers to Dominate the Global Sample Thawing Devices Market in 2017
Figure 19 North America: Sample Thawing Devices Market Snapshot
Figure 20 Blood Samples to Dominate the North American Sample Thawing Devices Market in 2017
Figure 21 Europe: Sample Thawing Devices Market Snapshot
Figure 22 Blood Banks & Transfusion Centers to Register the Highest Growth Rate in the European Sample Thawing Devices Market Between 2017 & 2022
Figure 23 Asia Pacific: Sample Thawing Devices Market Snapshot
Figure 24 Manual Devices to Account for A Larger Share of the Asia Pacific Sample Thawing Devices Market in 2017
Figure 25 RoW: Sample Thawing Devices Market Snapshot
Figure 26 Plasma Samples to Account for the Largest Share of the RoW Blood Thawing Devices Market in 2022
Figure 27 Organic & Inorganic Strategies Adopted By Leading Players From January 2014 to October 2017
Figure 28 SartoriUS: Company Snapshot - 2016
Figure 29 Cardinal Health: Company Snapshot - 2017
Figure 30 GE: Company Snapshot - 2016
Figure 31 Thermo Fisher Scientific: Company Snapshot - 2016

 Generating Response ...


Growth opportunities and latent adjacency in Thawing System Market