Food Blenders and Mixers Market

Food Blenders and Mixers Market by Type (High Shear, Shaft, Ribbon Mixer, Double Cone, Planetary Mixer, Screw Mixers & Blenders), Application (Bakery, Dairy, Beverages, Confectionery), Technology, Mode of Operation and Region - Global Forecast to 2027

Report Code: FB 3444 Jan, 2023, by marketsandmarkets.com

Food Blenders and Mixers Market Analysis

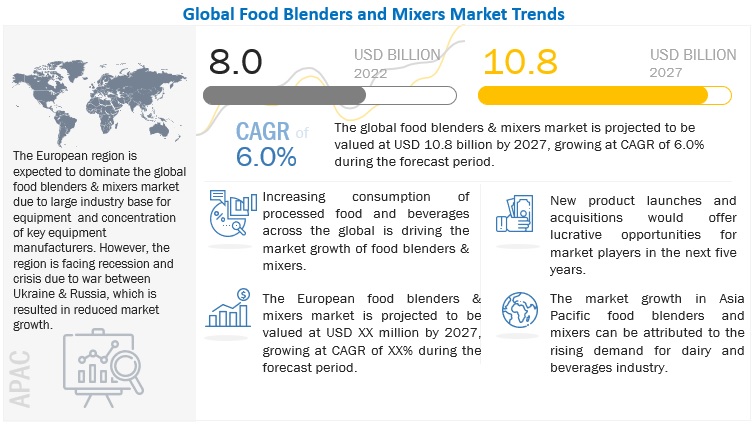
The food blenders and mixers market size was valued at around USD 8.0 billion in 2022 and is estimated to reach USD 10.8 billion by 2027 owing to increased customer demand for convenience meals and ready-to-eat goods. The primary factor anticipated to propel market growth for food blenders and mixers over the long run is the expanding food processing industry along with rising consumption of bread and dairy food products in developing nations.
Food Blenders and Mixers Market

To know about the assumptions considered for the study, Request for Free Sample Report

Food Blenders and Mixers Market Dynamics

Driver: Changing consumer expectations have propelled the food processing industry

Food & beverage processing converts raw materials and various ingredients, by physical or chemical means, into food or other forms. Earlier, food & beverage industry manufacturers used traditional techniques and extensive human labor to process and manufacture food & beverage products. However, these traditional processing practices have the potential to deliver only a limited amount of output, which involves high costs, owing to the number of human resources involved, costs of wastages & spillovers, and the relatively long time taken to produce the required output. Mixing is the primary operation required in transforming raw ingredients into food for human consumption. To overcome such challenges, there have been multiple advancements in the food & beverage processing industry, including the adoption of food blenders & mixers equipment that helps in processing various food & beverage products belonging to the bakery, dairy, confectionery, and other industries. Their use and application are determined by the phases being mixed (liquid-liquid, solid-liquid, or solid-solid) as well as the physical characteristics of the end product (such as viscosity and density). Thus, the blenders & mixers industry has a positive outlook due to high food & beverage processing growth.

Rising per capita income and the increasing trend of snacking between meals are accelerating the demand for R.T.E products, nutrition bars, extruded snacks, bakery products, batter-coated products, and soups & sauces. Consumer preferences in emerging economies, such as China, India, Brazil, and the Middle East, have gradually transitioned from traditional homemade breakfasts and snacking meals to ready-to-eat products over the last couple of decades. To cater to the rising demands of end consumers, the companies have been increasingly investing and focusing on increasing their production volumes. Thus, they have adapted to modern mixing and blending techniques to help them eliminate the excess time required, human capital expenditure, and wastage. This, in turn, delivers better-finished products at relatively lower costs, thereby leading to better sustainability. Recent advances in food processing and packaging are not just to meet the productivity demands but to adopt sophisticated automation, control, and monitoring methods and techniques. A majority of global players have upgraded their old production facilities with multifunctional equipment, thereby propelling the food processing equipment industry and ultimately accelerating the demand for blending & mixing equipment as well.

Restraint: Increase in the cost of power and energy

Manufacturing of food & beverage products consumes a tremendous amount of energy and power, especially where large and automated equipment is involved. The entire manufacturing of food & beverage products is concluded in the following stages: agriculture, processing, handling, and transporting. The handling and processing stages involve various types of machinery and technology, which consume massive energy and power.

Food blending and mixing is the initial stage in food processing and involves automated and semi-automated machinery for carrying out the processing of food & beverage products. Rising costs of power and energy required for the operation of mixing & blending equipment is the key restraint for the food blenders and mixers market for food & beverages. Large and established companies can afford to incur such heavy costs for operating this machinery. The high cost of running this equipment and the scarcity of non-renewable energy sources prevents small food manufacturers from installing these systems. Energy efficiency is the major attribute food processors are looking at when choosing blending & mixing equipment. As blending and mixing are vital parts of food processing, installing such systems is mandatory for a smooth and large-scale process. However, blenders & mixers are high-power-consuming equipment, making it difficult for the food processing companies to cope with rising energy costs.

Opportunity: Increase in demand for innovative blenders & mixers for special ingredients

Blenders & mixers are used to mix almost every ingredient in the food & beverage industry. However, certain ingredients are difficult to mix with water. For instance, xanthan gum is commonly used for its thickening and stabilizing effect on emulsions and suspensions. However, xanthan gum forms a gel structure in water, which is shear thinning and can be used in combination with other rheology modifiers, such as guar gum, as the two provide better effects. However, xanthan gum has certain difficulties in terms of mixing. When mixed with water, the powder has a strong tendency to form lumps. Several dispersion and hydration methods are used to overcome this. Thus, an advanced high-shear mixer can be a solution for this, as it can produce an agglomerate-free dispersion and fully hydrate Xanthan gum in a fraction of the time compared to conventional methods. This type of advanced blender & mixer equipment provides opportunities for manufacturers to function in niche markets.

Challenge: Increasing competition in the global market due to competitive pricing

Companies producing and marketing equipment exist in the market, which established global players dominate. However, in recent years, the market has seen the entry of local companies or SMEs designing, producing, and offering an array of food blenders and mixers in the respective local markets at a relatively lower price. This leads to market disruptions, resulting in competitive pricing, as the SMEs do not incur higher costs of manufacturing these equipment types due to limited product offerings and operations, which ultimately helps them offer their product portfolio at lower price points. But these companies might fail to offer after-sales service and assistance due to limited expertise or human resources, possibly leading to reducing the impact of these players as a challenger in the global food blenders and mixers market.

By technology, the batch mixer subsegment is estimated to account for the largest share of the market.

The use of batch technology gives precise control of mix quality, batch traceability, the flexibility of production, and easy pre-mixing of minor ingredients. These factors are contributing to the growth of the segment.

By type, the high-shear mixer segment is projected to achieve the highest CAGR in the food blenders and mixers market during the forecast period.

As high-shear mixers are widely used as fluid-based product mixing, the growing beverage industry is ultimately driving the growth of high-shear mixers.

The automatic mode of operation segment is projected to grow at the highest rate in the food blenders and mixers market.

Fully automated mixers & blenders contribute to accurate mixing & blending, quick and reliable production processes, optimum time utilization, reduced labor costs, and controlled operations. These factors have impacted the growth of automatic food blenders and mixers.

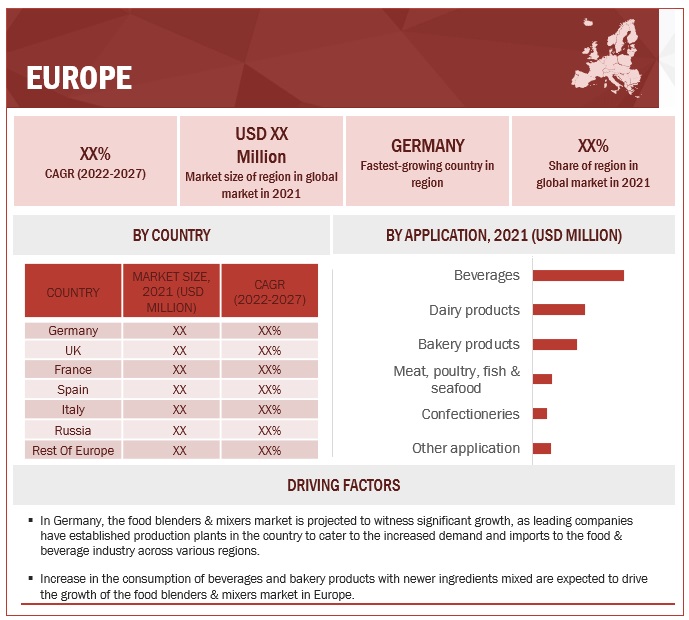
Europe is projected to account for the largest market share of the market during the forecast period.

Food manufacturers are adopting advanced food processing machinery that helps to reduce processing time and enhance the efficiency of manufacturing operations. The food processing sectors in this region are also witnessing automation transformation, which is further providing opportunities for the food blender & mixer manufacturers. Also, the food processing sector in this region is growing exponentially every year, thus creating more business opportunities for food blender and mixer manufacturers.
Food Blenders and Mixers Market Size, and Share

To know about the assumptions considered for the study, download the pdf brochure

Key Players in Food Blenders and Mixers Market 

The key players in this market include GEA Group (Germany), Tetra Laval (Switzerland), SPX Flow (US), Alfa Laval (Sweden), Marel (Iceland), Krones AG (Germany), Sulzer Ltd (Switzerland), Buhler (Switzerland), JBT (US), KHS Group (Germany), Hosokawa Micron Group (Japan), Amixon GmbH (Germany), Technosilos AP (Italy), Admix Inc. (US), and Nano Pharm Technology Machinery Equipment Co. Ltd. (China). To strengthen their market position in the global food blenders and mixers market, these players focus on strategies such as recent developments, acquisitions, collaborations, and partnerships.

Food Blenders and Mixers Market Report Scope

Report Metric

Details

Food Blenders and Mixers Market Estimated Size (2022) US $8.0 Billion
Projected Market Valuation (2027) US $10.8 Billion
Value-based CAGR (2022-2027) 6.0%

Number of Pages

351 Pages Report

Forecast period

2022-2027

Units considered

Value (USD)

Segments covered

Type, Application, Technology, Mode of Operation and Region

Regions covered

North America, Asia Pacific, Europe, South America and RoW

Companies studied

The major market players include GEA Group (Germany), Tetra Laval (Switzerland), SPX Flow (US), Alfa Laval (Sweden), Marel (Iceland), Krones AG (Germany), Sulzer Ltd (Switzerland), Buhler (Switzerland), JBT (US), KHS Group (Germany), Hosokawa Micron Group (Japan), Amixon GmbH (Germany), Technosilos AP (Italy), Admix Inc. (US), and Nano Pharm Technology Machinery Equipment Co. Ltd. (China)

Recent Developments

  • In January 2020, Tetra Pak unveiled the food and beverage (F&B) industry’s first full-scale virtual marketplace. The new platform, created using Mirakl SaaS Marketplace solutions, will bring convenience and ease to the food and beverage industry players by making purchasing products faster, more convenient, and simpler for producers, which will initially include over 300,000 spare parts & consumables and over 200,000 products for maintenance, repairs, and operations.
  • The company acquired other mixing technology companies, such as Philadelphia Mixing Solutions (US) in April 2021 and UTG Mixing Group (Germany) in December 2020, as a strategic move to expand its businesses geographically.
  • In October 2020, the company opened its new application & innovation center in Denmark to accelerate the development of new product innovations within the hygienic fluid handling technology (including pumps, valves, cleaning and mixing equipment). This center will allow customers to experience Alfa Laval equipment under actual operating conditions. The 1,600-square-metre center located at Alfa Laval’s site in Kolding will also be a global test facility for food and pharmaceutical application equipment. This expansion will allow the company to interact with more customers and increase sales.
  • In April 2021, Marel opened a new office and demo center in Brazil. As a part of the expansion and upgrade decision, the company relocated its corporate office from Piracicaba to Campinas. The company is also opening a new Progress Point demonstration and training center at the same location, which will help the company to connect with its clients and strengthen its ability to support Latin American food processors.

Frequently Asked Questions (FAQ):

To speak to our analyst for a discussion on the above findings, click Speak to Analyst

TABLE OF CONTENTS
 
1 INTRODUCTION (Page No. - 44)
    1.1 STUDY OBJECTIVES 
    1.2 MARKET DEFINITION 
    1.3 STUDY SCOPE 
           1.3.1 MARKET SEGMENTATION
    1.4 INCLUSIONS & EXCLUSIONS 
           1.4.1 GEOGRAPHIC SCOPE
           1.4.2 PERIOD CONSIDERED
    1.5 CURRENCY CONSIDERED 
           TABLE 1 USD EXCHANGE RATES, 2018–2021
    1.6 STAKEHOLDERS 
    1.7 SUMMARY OF CHANGES 
 
2 RESEARCH METHODOLOGY (Page No. - 50)
    2.1 RESEARCH DATA 
           FIGURE 1 FOOD BLENDERS & MIXERS MARKET: RESEARCH DESIGN
           2.1.1 SECONDARY DATA
                    2.1.1.1 Key data from secondary sources
           2.1.2 PRIMARY DATA
                    2.1.2.1 Breakdown of primaries
    2.2 MARKET SIZE ESTIMATION 
           2.2.1 BOTTOM-UP APPROACH
                    FIGURE 2 MARKET SIZE ESTIMATION METHODOLOGY: BOTTOM-UP APPROACH
           2.2.2 TOP-DOWN APPROACH
                    FIGURE 3 MARKET SIZE ESTIMATION METHODOLOGY: TOP-DOWN APPROACH
           2.2.3 SUPPLY-SIDE ANALYSIS
                    FIGURE 4 DATA TRIANGULATION: SUPPLY SIDE
           2.2.4 DEMAND SIDE ANALYSIS
                    FIGURE 5 DATA TRIANGULATION: DEMAND-SIDE
    2.3 GROWTH RATE FORECAST ASSUMPTIONS 
    2.4 DATA TRIANGULATION 
           FIGURE 6 DATA TRIANGULATION METHODOLOGY
    2.5 ASSUMPTIONS/HYPOTHESIS 
    2.6 LIMITATIONS & ASSOCIATED RISK 
 
3 EXECUTIVE SUMMARY (Page No. - 60)
    TABLE 2 FOOD BLENDERS & MIXERS MARKET SNAPSHOT, 2022 VS. 2027 
    FIGURE 7 FOOD BLENDERS AND MIXERS MARKET SIZE, BY TECHNOLOGY, 2022 VS. 2027 (USD MILLION) 
    FIGURE 8 MARKET SIZE, BY MODE OF OPERATION, 2022 VS. 2027 (USD MILLION) 
    FIGURE 9 MARKET SIZE, BY APPLICATION, 2022 VS. 2027 (USD MILLION) 
    FIGURE 10 MARKET SIZE, BY TYPE, 2022 VS. 2027 (USD MILLION) 
    FIGURE 11 MARKET SHARE & GROWTH (VALUE), BY REGION 
 
4 PREMIUM INSIGHTS (Page No. - 66)
    4.1 ATTRACTIVE OPPORTUNITIES IN FOOD BLENDERS & MIXERS MARKET 
           FIGURE 12 GROWING DEMAND FOR PROCESSED FOOD & BEVERAGES INDUSTRY TO PROPEL MARKET GROWTH OF FOOD BLENDERS & MIXERS
    4.2 ASIA PACIFIC: MARKET, BY KEY TYPE AND COUNTRY 
           FIGURE 13 HIGH SHEAR MIXER SEGMENT AND CHINA TO ACCOUNT FOR LARGEST SHARES IN ASIA PACIFIC, IN 2021
    4.3 FOOD BLENDERS & MIXERS MARKET: MAJOR REGIONAL SUBMARKETS 
           FIGURE 14 INDIA TO GROW AT HIGHEST CAGR DURING FORECAST PERIOD
    4.4 MARKET, BY TYPE AND REGION 
           FIGURE 15 HIGH SHEAR MIXER SEGMENT TO DOMINATE MARKET
    4.5 FOOD BLENDERS & MIXERS MARKET, BY TECHNOLOGY 
           FIGURE 16 CONTINUOUS TECHNOLOGY SEGMENT TO GROW AT HIGHER CAGR DURING FORECAST PERIOD
    4.6 MARKET, BY APPLICATION 
           FIGURE 17 BEVERAGES SEGMENT TO GROW AT LARGER MARKET SIZE DURING FORECAST PERIOD
    4.7 FOOD BLENDERS AND MIXERS MARKET, BY MODE OF OPERATION 
           FIGURE 18 SEMI-AUTOMATIC MODE OF OPERATION EQUIPMENT TO ACCOUNT FOR LARGER MARKET SIZE DURING FORECAST PERIOD
 
5 MARKET OVERVIEW (Page No. - 72)
    5.1 INTRODUCTION 
    5.2 MACROECONOMIC INDICATORS 
           5.2.1 FAST GROWING PROCESSED FOOD INDUSTRY
                    FIGURE 19 INCREASING SALES FOR CONVENIENCE FOODS, 2020 (CHANGE IN SALES)
                    FIGURE 20 FAST FOOD POPULARITY BY MEAL TYPE IN US, 2019
                    FIGURE 21 PERCENTAGE OF ADULTS WHO CONSUME FAST FOOD BY INCOME LEVEL IN US, 2019
                    FIGURE 22 TOP FAST FOOD CHAINS BY BRAND VALUE (IN MILLIONS) IN US, 2019
    5.3 MARKET DYNAMICS 
           FIGURE 23 DRIVERS, RESTRAINTS, OPPORTUNITIES, AND CHALLENGES: FOOD BLENDERS & MIXERS MARKET
           5.3.1 DRIVERS
                    5.3.1.1 Development of new technologies for food & beverage blending
                    5.3.1.2 Automation and robotics in blending and mixing equipment
                    5.3.1.3 Growing demand for innovative blenders & mixers for special ingredients
                    5.3.1.4 Increasing consumption of bakery and dairy products in developing countries to boost growth of machinery
                               FIGURE 24 SALES GROWTH OF BAKED GOODS
           5.3.2 RESTRAINTS
                    5.3.2.1 High power and energy costs
                               FIGURE 25 US: ENERGY CONSUMPTION IN FOOD PRODUCTION, 2018
           5.3.3 OPPORTUNITIES
                    5.3.3.1 Government initiatives
                               5.3.3.1.1 Funds for SMEs
                               5.3.3.1.2 Rising initiatives for promoting food processing and processed & convenience foods
           5.3.4 CHALLENGES
                    5.3.4.1 High capital investment
 
6 INDUSTRY TRENDS (Page No. - 85)
    6.1 INTRODUCTION 
    6.2 VALUE CHAIN ANALYSIS 
           FIGURE 26 VALUE CHAIN: FOOD BLENDERS & MIXERS MARKET
    6.3 TRENDS/DISRUPTIONS IMPACTING CUSTOMER BUSINESS 
           FIGURE 27 TRENDS/DISRUPTIONS IMPACTING CUSTOMERS IN FOOD BLENDERS AND MIXERS MARKET
    6.4 TECHNOLOGY ANALYSIS 
    6.5 PATENT ANALYSIS 
           FIGURE 28 PATENTS GRANTED FOR FOOD BLENDERS & MIXERS MARKET, 2011–2021
           FIGURE 29 REGIONAL ANALYSIS OF PATENTS GRANTED FOR MARKET, 2011–2021
           TABLE 3 KEY PATENTS PERTAINING TO MARKET, 2021
    6.6 MARKET/ECOSYSTEM MAP 
           6.6.1 UPSTREAM
                    6.6.1.1 Equipment manufacturers
                    6.6.1.2 Startups/emerging companies
           6.6.2 DOWNSTREAM
                    6.6.2.1 Regulatory bodies
                    6.6.2.2 End users
                               FIGURE 30 FOOD BLENDERS & MIXERS MARKET: MARKET MAP
                               TABLE 4 MARKET: ECOSYSTEM
    6.7 TRADE SCENARIO 
           TABLE 5 EXPORT DATA OF INDUSTRIAL FOOD PREPARATION MACHINERY FOR KEY COUNTRIES, 2019 (VALUE)
           TABLE 6 IMPORT DATA OF INDUSTRIAL FOOD PREPARATION MACHINERY FOR KEY COUNTRIES, 2019 (VALUE)
    6.8 KEY CONFERENCES & EVENTS IN 2022–2023 
           TABLE 7 FOOD BLENDERS & MIXERS MARKET: DETAILED LIST OF CONFERENCES & EVENTS, 2022–2023
    6.9 TARIFF AND REGULATORY LANDSCAPE 
           6.9.1 REGULATORY BODIES, GOVERNMENT AGENCIES, AND OTHER ORGANIZATIONS
                    TABLE 8 NORTH AMERICA: LIST OF REGULATORY BODIES, GOVERNMENT AGENCIES, AND OTHER ORGANIZATIONS
                    TABLE 9 EUROPE: LIST OF REGULATORY BODIES, GOVERNMENT AGENCIES, AND OTHER ORGANIZATIONS
                    TABLE 10 ASIA PACIFIC: LIST OF REGULATORY BODIES, GOVERNMENT AGENCIES, AND OTHER ORGANIZATIONS
                    TABLE 11 SOUTH AMERICA: LIST OF REGULATORY BODIES, GOVERNMENT AGENCIES, AND OTHER ORGANIZATIONS
                    TABLE 12 REST OF THE WORLD: LIST OF REGULATORY BODIES, GOVERNMENT AGENCIES, AND OTHER ORGANIZATIONS
           6.9.2 REGULATORY FRAMEWORK
                    6.9.2.1 Organizations/regulations governing food blenders & mixers market
                               6.9.2.1.1 Regulations of food processing equipment
                                             6.9.2.1.1.1 European Union (EU)
                                             6.9.2.1.1.2 North America (US and Canada)
                                                6.9.2.1.1.2.1 USFDA–US Food and Drug Administration inspection guide
                                                6.9.2.1.1.2.2 Canada
                                             6.9.2.1.1.3 Asia Pacific (Japan and China)
                               6.9.2.1.2 Regulations for food blender & mixer equipment
                                             6.9.2.1.2.1 Europe
                                                6.9.2.1.2.1.1 UK
                               TABLE 13 LIST OF SOME IMPORTANT STANDARD/REGULATION CODES FOR FOOD BLENDERS & MIXERS, 2017–2020
    6.1 PORTER’S FIVE FORCES ANALYSIS 
           TABLE 14 FOOD BLENDERS & MIXERS MARKET: PORTER’S FIVE FORCES ANALYSIS
           6.10.1 INTENSITY OF COMPETITIVE RIVALRY
           6.10.2 BARGAINING POWER OF SUPPLIERS
           6.10.3 BARGAINING POWER OF BUYERS
           6.10.4 THREAT OF SUBSTITUTES
           6.10.5 THREAT OF NEW ENTRANTS
    6.11 CASE STUDY ANALYSIS 
           6.11.1 SILVERSON HELPED SOLVE MIXING ISSUES WITH COMPLEX INGREDIENTS, SUCH AS XANTHAN GUM
           6.11.2 FRISTAM POWDER MIXER REDUCED PROCESSING TIME BY 67% AND IMPROVED PRODUCT QUALITY
 
7 FOOD BLENDERS & MIXERS MARKET, BY BRAND (Page No. - 110)
    7.1 INTRODUCTION 
    7.2 SPEEDMIX DFML 
    7.3 SANIMIX MRMA 
    7.4 GEA UNIMIX 
    7.5 VITOMIX VX 
    7.6 STEIN PROMIX 
    7.7 INNOPRO PARAMIX C 
    7.8 CONTIFLOW, CARBOFLOW, AND SYPRO B 
    7.9 FLEX-MIX 
    7.10 SALOMIX 
    7.11 TETRA ALMIX, ALBATCH, HOYER PROMIX, AND ALFAST 
    7.12 LEVIMAG 
    7.13 SPEEDMIX AND SOFTMIX 
    7.14 ALB, ALS, ALT, AND ALTB 
 
8 FOOD BLENDERS & MIXERS MARKET, BY TECHNOLOGY (Page No. - 115)
    8.1 INTRODUCTION 
           FIGURE 31 FOOD BLENDERS & MIXERS MARKET, BY TECHNOLOGY, 2022 VS. 2027
           TABLE 15 FOOD BLENDERS AND MIXERS MARKET, BY TECHNOLOGY, 2018–2021 (USD MILLION)
           TABLE 16 MARKET, BY TECHNOLOGY, 2022–2027 (USD MILLION)
    8.2 BATCH 
           8.2.1 DESIRED QUALITY LEVELS IN OUTPUT TO DRIVE DEMAND FOR BATCH MIXING TECHNOLOGY
                    TABLE 17 BATCH TECHNOLOGY: FOOD BLENDERS & MIXERS MARKET, BY REGION, 2018–2021 (USD MILLION)
                    TABLE 18 BATCH TECHNOLOGY: MARKET, BY REGION, 2022–2027 (USD MILLION)
    8.3 CONTINUOUS 
           8.3.1 IMPROVED EFFICIENCY AND HIGH OUTPUT AT SMALL SIZES TO DRIVE GROWTH OF CONTINUOUS MIXING TECHNOLOGY EQUIPMENT
                    TABLE 19 CONTINUOUS TECHNOLOGY: FOOD BLENDERS & MIXERS MARKET, BY REGION, 2018–2021 (USD MILLION)
                    TABLE 20 CONTINUOUS TECHNOLOGY: MARKET, BY REGION, 2022–2027 (USD MILLION)
 
9 FOOD BLENDERS & MIXERS MARKET, BY TYPE (Page No. - 122)
    9.1 INTRODUCTION 
           FIGURE 32 FOOD BLENDERS & MIXERS MARKET, BY TYPE, 2022 VS. 2027 (USD MILLION)
           TABLE 21 MARKET, BY TYPE, 2018–2021 (USD MILLION)
           TABLE 22 FOOD BLENDERS & MIXERS MARKET, BY TYPE, 2022–2027 (USD MILLION)
    9.2 HIGH SHEAR MIXERS 
           9.2.1 GROWING BEVERAGE AND DAIRY INDUSTRY TO DRIVE DEMAND FOR HIGH-SHEAR MIXERS
                    TABLE 23 HIGH SHEAR MIXERS: FOOD BLENDERS & MIXERS MARKET, BY REGION, 2018–2021 (USD MILLION)
                    TABLE 24 HIGH SHEAR MIXERS: FOOD BLENDERS AND MIXERS MARKET, BY REGION, 2022–2027 (USD MILLION)
    9.3 SHAFT MIXERS 
           9.3.1 MULTI-FUNCTIONALITY OF SHAFT MIXERS TO DRIVE GROWTH IN END-USE INDUSTRY APPLICATIONS
                    TABLE 25 SHAFT MIXERS: FOOD BLENDERS & MIXERS MARKET, BY REGION, 2018–2021 (USD MILLION)
                    TABLE 26 SHAFT MIXERS: MARKET, BY REGION, 2022–2027 (USD MILLION)
    9.4 RIBBON BLENDERS 
           9.4.1 GROWING NUMBER OF APPLICATIONS CATERED TO BY RIBBON BLENDERS TO BOOST ITS GROWTH
                    TABLE 27 RIBBON BLENDERS: FOOD BLENDERS & MIXERS MARKET, BY REGION, 2018–2021 (USD MILLION)
                    TABLE 28 RIBBON BLENDERS: MARKET, BY REGION, 2022–2027 (USD MILLION)
    9.5 DOUBLE CONE BLENDERS 
           9.5.1 RISING DEMAND FROM CONFECTIONERY INDUSTRY TO PROPEL GROWTH OF DOUBLE CONE BLENDERS
                    TABLE 29 DOUBLE CONE BLENDERS: FOOD BLENDERS & MIXERS MARKET, BY REGION, 2018–2021 (USD MILLION)
                    TABLE 30 DOUBLE CONE BLENDERS: MARKET, BY REGION, 2022–2027 (USD MILLION)
    9.6 PLANETARY MIXERS 
           9.6.1 GROWING BEVERAGE INDUSTRY AND DEMAND FOR PREPARED FOODS TO PROPEL MARKET FOR PLANETARY MIXERS
                    TABLE 31 PLANETARY MIXERS: FOOD BLENDERS & MIXERS MARKET, BY REGION, 2018–2021 (USD MILLION)
                    TABLE 32 PLANETARY MIXERS: MARKET, BY REGION, 2022–2027 (USD MILLION)
    9.7 SCREW BLENDERS & MIXERS 
           9.7.1 INCREASING DEMAND FOR DAIRY AND BAKERY PRODUCTS TO ENCOURAGE GROWTH OF SCREW BLENDERS AND MIXERS
                    TABLE 33 SCREW MIXERS & BLENDERS: FOOD BLENDERS & MIXERS MARKET, BY REGION, 2018–2021 (USD MILLION)
                    TABLE 34 SCREW MIXERS & BLENDERS: FOOD BLENDERS AND MIXERS MARKET, BY REGION, 2022–2027 (USD MILLION)
    9.8 OTHER TYPES 
           TABLE 35 OTHER TYPES: FOOD BLENDERS & MIXERS MARKET, BY REGION, 2018–2021 (USD MILLION)
           TABLE 36 OTHER TYPES: MARKET, BY REGION, 2022–2027 (USD MILLION)
 
10 FOOD BLENDERS & MIXERS MARKET, BY MODE OF OPERATION (Page No. - 137)
     10.1 INTRODUCTION 
               FIGURE 33 FOOD BLENDERS & MIXERS MARKET, BY MODE OF OPERATION, 2022 VS. 2027
               TABLE 37 MARKET, BY MODE OF OPERATION, 2018–2021 (USD MILLION)
               TABLE 38 FOOD BLENDERS & MIXERS MARKET, BY MODE OF OPERATION, 2022–2027 (USD MILLION)
     10.2 SEMI-AUTOMATIC 
             10.2.1 SEMI-AUTOMATIC EQUIPMENT ENABLING SMALL AND MEDIUM-SCALE MANUFACTURERS TO SUPPORT HIGH YIELD WITH CONSISTENT QUALITY
                       TABLE 39 SEMI-AUTOMATIC: FOOD BLENDERS & MIXERS MARKET, BY REGION, 2018–2021 (USD MILLION)
                       TABLE 40 SEMI-AUTOMATIC: MARKET, BY REGION, 2022–2027 (USD MILLION)
     10.3 AUTOMATIC 
             10.3.1 INCREASING USAGE OF AUTOMATIC FOOD BLENDERS & MIXERS TO INCREASE PRODUCTIVITY AND EFFICIENCY AND DECREASE OPERATING EXPENSES
                       TABLE 41 AUTOMATIC: FOOD BLENDERS & MIXERS MARKET, BY REGION, 2018–2021 (USD MILLION)
                       TABLE 42 AUTOMATIC: FOOD BLENDERS AND MIXERS MARKET, BY REGION, 2022–2027 (USD MILLION)
 
11 FOOD BLENDERS & MIXERS MARKET, BY APPLICATION (Page No. - 142)
     11.1 INTRODUCTION 
               FIGURE 34 FOOD BLENDERS & MIXERS MARKET SIZE, BY APPLICATION, 2022 VS. 2027
                       TABLE 43 FOOD BLENDERS & MIXERS MARKET, BY APPLICATION, 2018–2021 (USD MILLION)
               TABLE 44 MARKET, BY APPLICATION, 2022–2027 (USD MILLION)
     11.2 BAKERY PRODUCTS 
             11.2.1 CHANGING LIFESTYLES AND INCREASING DEMAND FOR BREAD & BAKERY PRODUCTS TO DRIVE MARKET
                       TABLE 45 BAKERY PRODUCTS: FOOD BLENDERS & MIXERS MARKET, BY REGION, 2018–2021 (USD MILLION)
                       TABLE 46 BAKERY PRODUCTS: MARKET, BY REGION, 2022–2027 (USD MILLION)
     11.3 DAIRY PRODUCTS 
             11.3.1 ADVANCEMENTS AND INNOVATIONS IN DAIRY PROCESSING EQUIPMENT TO BOOST MARKET
                       TABLE 47 DAIRY PRODUCTS: FOOD BLENDERS & MIXERS MARKET, BY REGION, 2018–2021 (USD MILLION)
                       TABLE 48 DAIRY PRODUCTS: MARKET, BY REGION, 2022–2027 (USD MILLION)
                       TABLE 49 DAIRY PRODUCTS: FOOD BLENDERS & MIXERS MARKET, BY SUB-TYPE, 2018–2021 (USD MILLION)
                       TABLE 50 DAIRY PRODUCTS: FOOD BLENDERS AND MIXERS MARKET, BY SUB-TYPE, 2022–2027 (USD MILLION)
             11.3.2 MILK
                       TABLE 51 MILK: FOOD BLENDERS & MIXERS MARKET, BY REGION, 2018–2021 (USD MILLION)
                       TABLE 52 MILK: FOOD BLENDERS & MIXERS MARKET, BY REGION, 2022–2027 (USD MILLION)
             11.3.3 ICE CREAM AND FROZEN DESSERTS
                       TABLE 53 ICE CREAM AND FROZEN DESSERTS: FOOD BLENDERS & MIXERS MARKET, BY REGION, 2018–2021 (USD MILLION)
                       TABLE 54 ICE CREAM AND FROZEN DESSERTS: MARKET, BY REGION, 2022–2027 (USD MILLION)
             11.3.4 YOGURT
                       TABLE 55 YOGURT: FOOD BLENDERS & MIXERS MARKET, BY REGION, 2018–2021 (USD MILLION)
                       TABLE 56 YOGURT: MARKET, BY REGION, 2022–2027 (USD MILLION)
             11.3.5 OTHER DAIRY PRODUCTS
                       TABLE 57 OTHER DAIRY PRODUCTS: FOOD BLENDERS & MIXERS MARKET, BY REGION, 2018–2021 (USD MILLION)
                       TABLE 58 OTHER DAIRY PRODUCTS: MARKET, BY REGION, 2022–2027 (USD MILLION)
     11.4 BEVERAGES 
             11.4.1 RISING DEMAND FOR FUNCTIONAL AND ALCOHOLIC BEVERAGES TO BOOST DEMAND FOR FOOD BLENDERS & MIXERS
                       TABLE 59 BEVERAGES: FOOD BLENDERS & MIXERS MARKET, BY REGION, 2018–2021 (USD MILLION)
                       TABLE 60 BEVERAGES: MARKET, BY REGION, 2022–2027 (USD MILLION)
                       TABLE 61 BEVERAGES: FOOD BLENDERS AND MIXERS MARKET, BY SUB-TYPE, 2018–2021 (USD MILLION)
                       TABLE 62 BEVERAGES: FOOD BLENDERS & MIXERS MARKET, BY SUB-TYPE, 2022–2027 (USD MILLION)
             11.4.2 ALCOHOLIC BEVERAGES
                       TABLE 63 ALCOHOLIC BEVERAGES: FOOD BLENDERS & MIXERS MARKET, BY REGION, 2018–2021 (USD MILLION)
                       TABLE 64 ALCOHOLIC BEVERAGES: MARKET, BY REGION, 2022–2027 (USD MILLION)
             11.4.3 NON-ALCOHOLIC BEVERAGES
                       TABLE 65 NON-ALCOHOLIC BEVERAGES: FOOD BLENDERS & MIXERS MARKET, BY REGION, 2018–2021 (USD MILLION)
                       TABLE 66 NON-ALCOHOLIC BEVERAGES: MARKET, BY REGION, 2022–2027 (USD MILLION)
     11.5 MEAT, POULTRY, FISH & SEAFOOD 
             11.5.1 SHIFT IN CONSUMPTION PATTERNS AND PREFERENCE FOR PROCESSED AND FROZEN PRODUCTS TO DRIVE DEMAND
                       TABLE 67 MEAT, POULTRY, FISH & SEAFOOD: FOOD BLENDERS & MIXERS MARKET, BY REGION, 2018–2021 (USD MILLION)
                       TABLE 68 MEAT, POULTRY, FISH & SEAFOOD: MARKET, BY REGION, 2022–2027 (USD MILLION)
     11.6 CONFECTIONERIES 
             11.6.1 INCREASED PRODUCTION OF SNACK BARS AND SWEET GOODS TO BOOST DEMAND FOR FOOD BLENDERS & MIXERS
                       TABLE 69 CONFECTIONERIES: FOOD BLENDERS & MIXERS MARKET, BY REGION, 2018–2021 (USD MILLION)
                       TABLE 70 CONFECTIONERIES: MARKET, BY REGION, 2022–2027 (USD MILLION)
     11.7 OTHER APPLICATIONS 
               TABLE 71 OTHER APPLICATIONS: FOOD BLENDERS & MIXERS MARKET, BY REGION, 2018–2021 (USD MILLION)
               TABLE 72 OTHER APPLICATIONS: FOOD BLENDERS AND MIXERS MARKET, BY REGION, 2022–2027 (USD MILLION)
 
12 FOOD BLENDERS & MIXERS MARKET, BY REGION (Page No. - 161)
     12.1 INTRODUCTION 
               FIGURE 35 GEOGRAPHIC SNAPSHOT: MARKETS IN ASIA PACIFIC TO EMERGE AS NEW HOTSPOTS
               TABLE 73 FOOD BLENDERS & MIXERS MARKET, BY REGION, 2018–2021 (USD MILLION)
               TABLE 74 FOOD BLENDERS & MIXERS MARKET, BY REGION, 2022–2027 (USD MILLION)
     12.2 NORTH AMERICA 
               TABLE 75 NORTH AMERICA: FOOD BLENDERS & MIXERS MARKET, BY COUNTRY, 2018–2021 (USD MILLION)
               TABLE 76 NORTH AMERICA: MARKET, BY COUNTRY, 2022–2027 (USD MILLION)
               TABLE 77 NORTH AMERICA: FOOD BLENDERS & MIXERS MARKET, BY APPLICATION, 2018–2021 (USD MILLION)
               TABLE 78 NORTH AMERICA: MARKET, BY APPLICATION, 2022–2027 (USD MILLION)
               TABLE 79 NORTH AMERICA: FOOD BLENDERS & MIXERS MARKET FOR DAIRY PRODUCTS, BY SUB-TYPE, 2018–2021 (USD MILLION)
               TABLE 80 NORTH AMERICA: MARKET FOR DAIRY PRODUCTS, BY SUB-TYPE, 2022–2027 (USD MILLION)
               TABLE 81 NORTH AMERICA: FOOD BLENDERS & MIXERS MARKET FOR BEVERAGES, BY SUB-TYPE, 2018–2021 (USD MILLION)
               TABLE 82 NORTH AMERICA: MARKET FOR BEVERAGES, BY SUB-TYPE, 2022–2027 (USD MILLION)
               TABLE 83 NORTH AMERICA: FOOD BLENDERS AND MIXERS MARKET, BY MODE OF OPERATION, 2018–2021 (USD MILLION)
               TABLE 84 NORTH AMERICA: FOOD BLENDERS & MIXERS MARKET, BY MODE OF OPERATION, 2022–2027 (USD MILLION)
               TABLE 85 NORTH AMERICA: MARKET, BY TECHNOLOGY, 2018–2021 (USD MILLION)
               TABLE 86 NORTH AMERICA: MARKET, BY TECHNOLOGY, 2022–2027 (USD MILLION)
               TABLE 87 NORTH AMERICA: FOOD BLENDERS & MIXERS MARKET, BY TYPE, 2018–2021 (USD MILLION)
               TABLE 88 NORTH AMERICA: MARKET, BY TYPE, 2022–2027 (USD MILLION)
             12.2.1 US
                       12.2.1.1 Increasing number of established food processors and rising bakery industry to boost market
                                   TABLE 89 US: FOOD BLENDERS & MIXERS MARKET, BY APPLICATION, 2018–2021 (USD MILLION)
                                   TABLE 90 US: FOOD BLENDERS & MIXERS MARKET, BY APPLICATION, 2022–2027 (USD MILLION)
                                   TABLE 91 US: FOOD BLENDERS & MIXERS MARKET, BY TECHNOLOGY, 2018–2021 (USD MILLION)
                                   TABLE 92 US: FOOD BLENDERS & MIXERS MARKET, BY TECHNOLOGY, 2022–2027 (USD MILLION)
                                   TABLE 93 US: FOOD BLENDERS & MIXERS MARKET, BY TYPE, 2018–2021 (USD MILLION)
                                   TABLE 94 US: FOOD BLENDERS & MIXERS MARKET, BY TYPE, 2022–2027 (USD MILLION)
             12.2.2 CANADA
                       12.2.2.1 Increasing demand for food blenders & mixers from small-to-large scale manufacturers to offer immense growth potential
                                   TABLE 95 CANADA: FOOD BLENDERS & MIXERS MARKET, BY APPLICATION, 2018–2021 (USD MILLION)
                                   TABLE 96 CANADA: MARKET, BY APPLICATION, 2022–2027 (USD MILLION)
                                   TABLE 97 CANADA: FOOD BLENDERS & MIXERS MARKET, BY TECHNOLOGY, 2018–2021 (USD MILLION)
                                   TABLE 98 CANADA: FOOD BLENDERS AND MIXERS MARKET, BY TECHNOLOGY, 2022–2027 (USD MILLION)
                                   TABLE 99 CANADA: FOOD BLENDERS & MIXERS MARKET, BY TYPE, 2018–2021 (USD MILLION)
                                   TABLE 100 CANADA: MARKET, BY TYPE, 2022–2027 (USD MILLION)
             12.2.3 MEXICO
                       12.2.3.1 Growing trade relations between Mexico and other developed countries to drive market for blenders & mixers
                                   TABLE 101 MEXICO: FOOD BLENDERS & MIXERS MARKET, BY APPLICATION, 2018–2021 (USD MILLION)
                                   TABLE 102 MEXICO: FOOD BLENDERS & MIXERS MARKET, BY APPLICATION, 2022–2027 (USD MILLION)
                                   TABLE 103 MEXICO: FOOD BLENDERS & MIXERS MARKET, BY TECHNOLOGY, 2018–2021 (USD MILLION)
                                   TABLE 104 MEXICO: FOOD BLENDERS & MIXERS MARKET, BY TECHNOLOGY, 2022–2027 (USD MILLION)
                                   TABLE 105 MEXICO: FOOD BLENDERS & MIXERS MARKET, BY TYPE, 2018–2021 (USD MILLION)
                                   TABLE 106 MEXICO: FOOD BLENDERS & MIXERS MARKET, BY TYPE, 2022–2027 (USD MILLION)
     12.3 EUROPE 
               FIGURE 36 EUROPE: MARKET SNAPSHOT
               TABLE 107 EUROPE: FOOD BLENDERS & MIXERS MARKET, BY COUNTRY, 2018–2021 (USD MILLION)
               TABLE 108 EUROPE: FOOD BLENDERS & MIXERS MARKET, BY COUNTRY, 2022–2027 (USD MILLION)
               TABLE 109 EUROPE: FOOD BLENDERS & MIXERS MARKET, BY APPLICATION, 2018–2021 (USD MILLION)
               TABLE 110 EUROPE: FOOD BLENDERS & MIXERS MARKET, BY APPLICATION, 2022–2027 (USD MILLION)
               TABLE 111 EUROPE: FOOD BLENDERS & MIXERS MARKET FOR DAIRY PRODUCTS, BY SUB-TYPE 2018–2021 (USD MILLION)
               TABLE 112 EUROPE: FOOD BLENDERS & MIXERS MARKET FOR DAIRY PRODUCTS, BY SUB-TYPE 2022–2027 (USD MILLION)
               TABLE 113 EUROPE: FOOD BLENDERS & MIXERS MARKET FOR BEVERAGES, BY SUB-TYPE, 2018–2021 (USD MILLION)
               TABLE 114 EUROPE: FOOD BLENDERS & MIXERS MARKET FOR BEVERAGES, BY SUB-TYPE, 2022–2027 (USD MILLION)
               TABLE 115 EUROPE: FOOD BLENDERS & MIXERS MARKET, BY MODE OF OPERATION, 2018–2021 (USD MILLION)
               TABLE 116 EUROPE: FOOD BLENDERS & MIXERS MARKET, BY MODE OF OPERATION, 2022–2027 (USD MILLION)
               TABLE 117 EUROPE: FOOD BLENDERS & MIXERS MARKET, BY TECHNOLOGY, 2018–2021 (USD MILLION)
               TABLE 118 EUROPE: FOOD BLENDERS & MIXERS MARKET, BY TECHNOLOGY, 2022–2027 (USD MILLION)
               TABLE 119 EUROPE: FOOD BLENDERS & MIXERS MARKET, BY TYPE, 2018–2021 (USD MILLION)
               TABLE 120 EUROPE: FOOD BLENDERS & MIXERS MARKET, BY TYPE, 2022–2027 (USD MILLION)
             12.3.1 ITALY
                       12.3.1.1 Rising investment in processing industries to drive market for blenders and mixers
                                   TABLE 121 ITALY: FOOD BLENDERS & MIXERS MARKET, BY APPLICATION, 2018–2021 (USD MILLION)
                                   TABLE 122 ITALY: FOOD BLENDERS & MIXERS MARKET, BY APPLICATION, 2022–2027 (USD MILLION)
                                   TABLE 123 ITALY: FOOD BLENDERS & MIXERS MARKET, BY TECHNOLOGY, 2018–2021 (USD MILLION)
                                   TABLE 124 ITALY: FOOD BLENDERS & MIXERS MARKET, BY TECHNOLOGY, 2022–2027 (USD MILLION)
                                   TABLE 125 ITALY: FOOD BLENDERS & MIXERS MARKET, BY TYPE, 2018–2021 (USD MILLION)
                                   TABLE 126 ITALY: FOOD BLENDERS & MIXERS MARKET, BY TYPE, 2022–2027 (USD MILLION)
             12.3.2 UK
                       12.3.2.1 Higher consumption of bakery, dairy, and confectionery products among local consumers to drive market
                                   FIGURE 37 UK: DAIRY IMPORT, 2021 VS. 2022 (JANUARY–SEPTEMBER)
                                   FIGURE 38 UK: DAIRY EXPORT, 2021 VS. 2022 (JANUARY–SEPTEMBER)
                                   TABLE 127 UK: FOOD BLENDERS & MIXERS MARKET, BY APPLICATION, 2018–2021 (USD MILLION)
                                   TABLE 128 UK: FOOD BLENDERS & MIXERS MARKET, BY APPLICATION, 2022–2027 (USD MILLION)
                                   TABLE 129 UK: FOOD BLENDERS & MIXERS MARKET, BY TECHNOLOGY, 2018–2021 (USD MILLION)
                                   TABLE 130 UK: FOOD BLENDERS & MIXERS MARKET, BY TECHNOLOGY, 2022–2027 (USD MILLION)
                                   TABLE 131 UK: FOOD BLENDERS & MIXERS MARKET, BY TYPE, 2018–2021 (USD MILLION)
                                   TABLE 132 UK: FOOD BLENDERS & MIXERS MARKET, BY TYPE, 2022–2027 (USD MILLION)
             12.3.3 GERMANY
                       12.3.3.1 Increasing food and beverage manufacturing to drive demand for food blenders & mixers
                                   FIGURE 39 PRODUCTION VALUE OF GERMAN FOOD & BEVERAGE INDUSTRY, BY SEGMENT, 2020 (IN PERCENT)
                                   TABLE 133 GERMANY: FOOD BLENDERS & MIXERS MARKET, BY APPLICATION, 2018–2021 (USD MILLION)
                                   TABLE 134 GERMANY: FOOD BLENDERS & MIXERS MARKET, BY APPLICATION, 2022–2027 (USD MILLION)
                                   TABLE 135 GERMANY: FOOD BLENDERS & MIXERS MARKET, BY TECHNOLOGY, 2018–2021 (USD MILLION)
                                   TABLE 136 GERMANY: FOOD BLENDERS & MIXERS MARKET, BY TECHNOLOGY, 2022–2027 (USD MILLION)
                                   TABLE 137 GERMANY: FOOD BLENDERS & MIXERS MARKET, BY TYPE, 2018–2021 (USD MILLION)
                                   TABLE 138 GERMANY: FOOD BLENDERS & MIXERS MARKET, BY TYPE, 2022–2027 (USD MILLION)
             12.3.4 FRANCE
                       12.3.4.1 Established alcoholic beverage and dairy industries to drive market for blenders and mixers
                                   FIGURE 40 FRANCE: WINE PRODUCTION, 2017–2021 (MHL)
                                   TABLE 139 FRANCE: FOOD BLENDERS & MIXERS MARKET, BY APPLICATION, 2018–2021 (USD MILLION)
                                   TABLE 140 FRANCE: FOOD BLENDERS & MIXERS MARKET, BY APPLICATION, 2022–2027 (USD MILLION)
                                   TABLE 141 FRANCE: FOOD BLENDERS & MIXERS MARKET, BY TECHNOLOGY, 2018–2021 (USD MILLION)
                                   TABLE 142 FRANCE: FOOD BLENDERS & MIXERS MARKET, BY TECHNOLOGY, 2022–2027 (USD MILLION)
                                   TABLE 143 FRANCE: FOOD BLENDERS & MIXERS MARKET, BY TYPE, 2018–2021 (USD MILLION)
                                   TABLE 144 FRANCE: FOOD BLENDERS & MIXERS MARKET, BY TYPE, 2022–2027 (USD MILLION)
             12.3.5 SPAIN
                       12.3.5.1 Growing demand for beer beverages and other food products to propel demand for blenders and mixers
                                   TABLE 145 SPAIN: FOOD BLENDERS & MIXERS MARKET, BY APPLICATION, 2018–2021 (USD MILLION)
                                   TABLE 146 SPAIN: FOOD BLENDERS & MIXERS MARKET, BY APPLICATION, 2022–2027 (USD MILLION)
                                   TABLE 147 SPAIN: FOOD BLENDERS & MIXERS MARKET, BY TECHNOLOGY, 2018–2021 (USD MILLION)
                                   TABLE 148 SPAIN: FOOD BLENDERS & MIXERS MARKET, BY TECHNOLOGY, 2022–2027 (USD MILLION)
                                   TABLE 149 SPAIN: FOOD BLENDERS & MIXERS MARKET, BY TYPE, 2018–2021 (USD MILLION)
                                   TABLE 150 SPAIN: FOOD BLENDERS & MIXERS MARKET, BY TYPE, 2022–2027 (USD MILLION)
             12.3.6 RUSSIA
                       12.3.6.1 Shift in consumer preference for products with longer shelf life to boost demand for blenders and mixers
                                   TABLE 151 RUSSIA: FOOD BLENDERS & MIXERS MARKET, BY APPLICATION, 2018–2021 (USD MILLION)
                                   TABLE 152 RUSSIA: FOOD BLENDERS & MIXERS MARKET, BY APPLICATION, 2022–2027 (USD MILLION)
                                   TABLE 153 RUSSIA: FOOD BLENDERS & MIXERS MARKET, BY TECHNOLOGY, 2018–2021 (USD MILLION)
                                   TABLE 154 RUSSIA: FOOD BLENDERS & MIXERS MARKET, BY TECHNOLOGY, 2022–2027 (USD MILLION)
                                   TABLE 155 RUSSIA: FOOD BLENDERS & MIXERS MARKET, BY TYPE, 2018–2021 (USD MILLION)
                                   TABLE 156 RUSSIA: FOOD BLENDERS & MIXERS MARKET, BY TYPE, 2022–2027 (USD MILLION)
             12.3.7 REST OF EUROPE
                       TABLE 157 REST OF EUROPE: FOOD BLENDERS & MIXERS MARKET, BY APPLICATION, 2018–2021 (USD MILLION)
                       TABLE 158 REST OF EUROPE: FOOD BLENDERS & MIXERS MARKET, BY APPLICATION, 2022–2027 (USD MILLION)
                       TABLE 159 REST OF EUROPE: FOOD BLENDERS & MIXERS MARKET, BY TECHNOLOGY, 2018–2021 (USD MILLION)
                       TABLE 160 REST OF EUROPE: FOOD BLENDERS & MIXERS MARKET, BY TECHNOLOGY, 2022–2027 (USD MILLION)
                       TABLE 161 REST OF EUROPE: FOOD BLENDERS & MIXERS MARKET, BY TYPE, 2018–2021 (USD MILLION)
                       TABLE 162 REST OF EUROPE: FOOD BLENDERS & MIXERS MARKET, BY TYPE, 2022–2027 (USD MILLION)
     12.4 ASIA PACIFIC 
               FIGURE 41 ASIA PACIFIC: MARKET SNAPSHOT
               TABLE 163 ASIA PACIFIC: FOOD BLENDERS & MIXERS MARKET, BY COUNTRY, 2018–2021 (USD MILLION)
               TABLE 164 ASIA PACIFIC: FOOD BLENDERS & MIXERS MARKET, BY COUNTRY, 2022–2027 (USD MILLION)
               TABLE 165 ASIA PACIFIC: FOOD BLENDERS & MIXERS MARKET, BY APPLICATION, 2018–2021 (USD MILLION)
               TABLE 166 ASIA PACIFIC: FOOD BLENDERS & MIXERS MARKET, BY APPLICATION, 2022–2027 (USD MILLION)
               TABLE 167 ASIA PACIFIC: FOOD BLENDERS & MIXERS MARKET FOR DAIRY PRODUCTS, BY SUB-TYPE, 2018–2021 (USD MILLION)
               TABLE 168 ASIA PACIFIC: FOOD BLENDERS & MIXERS MARKET FOR DAIRY PRODUCTS, BY SUB-TYPE, 2022–2027 (USD MILLION)
               TABLE 169 ASIA PACIFIC: FOOD BLENDERS & MIXERS MARKET FOR BEVERAGES, BY SUB-TYPE, 2018–2021 (USD MILLION)
               TABLE 170 ASIA PACIFIC: FOOD BLENDERS & MIXERS MARKET FOR BEVERAGES, BY SUB-TYPE, 2022–2027 (USD MILLION)
               TABLE 171 ASIA PACIFIC: FOOD BLENDERS & MIXERS MARKET, BY MODE OF OPERATION, 2018–2021 (USD MILLION)
               TABLE 172 ASIA PACIFIC: FOOD BLENDERS & MIXERS MARKET, BY MODE OF OPERATION, 2022–2027 (USD MILLION)
               TABLE 173 ASIA PACIFIC: FOOD BLENDERS & MIXERS MARKET, BY TECHNOLOGY, 2018–2021 (USD MILLION)
               TABLE 174 ASIA PACIFIC: FOOD BLENDERS & MIXERS MARKET, BY TECHNOLOGY, 2022–2027 (USD MILLION)
               TABLE 175 ASIA PACIFIC: FOOD BLENDERS & MIXERS MARKET, BY TYPE, 2018–2021 (USD MILLION)
               TABLE 176 ASIA PACIFIC: FOOD BLENDERS & MIXERS MARKET, BY TYPE, 2022–2027 (USD MILLION)
             12.4.1 CHINA
                       12.4.1.1 Increasing machinery and equipment business and growing beverage and dairy industry to drive growth
                                   FIGURE 42 CHINA: FOOD PROCESSING PROFIT GROWTH BY SECTOR, JANUARY TO MAY 2018
                                   TABLE 177 CHINA: FOOD BLENDERS & MIXERS MARKET, BY APPLICATION, 2018–2021 (USD MILLION)
                                   TABLE 178 CHINA: FOOD BLENDERS & MIXERS MARKET, BY APPLICATION, 2022–2027 (USD MILLION)
                                   TABLE 179 CHINA: FOOD BLENDERS & MIXERS MARKET, BY TECHNOLOGY, 2018–2021 (USD MILLION)
                                   TABLE 180 CHINA: FOOD BLENDERS & MIXERS MARKET, BY TECHNOLOGY, 2022–2027 (USD MILLION)
                                   TABLE 181 CHINA: FOOD BLENDERS & MIXERS MARKET, BY TYPE, 2018–2021 (USD MILLION)
                                   TABLE 182 CHINA: FOOD BLENDERS & MIXERS MARKET, BY TYPE, 2022–2027 (USD MILLION)
             12.4.2 JAPAN
                       12.4.2.1 Availability of advanced technology equipment and growing implementation of food safety measures to drive market
                                   FIGURE 43 JAPAN: FROZEN FOOD PRODUCTION, 2016–2020 (MT)
                                   FIGURE 44 JAPAN: FOOD PROCESSING INDUSTRY, 2018–2020
                                   TABLE 183 JAPAN: FOOD BLENDERS & MIXERS MARKET, BY APPLICATION, 2018–2021 (USD MILLION)
                                   TABLE 184 JAPAN: FOOD BLENDERS & MIXERS MARKET, BY APPLICATION, 2022–2027 (USD MILLION)
                                   TABLE 185 JAPAN: FOOD BLENDERS & MIXERS MARKET, BY TECHNOLOGY, 2018–2021 (USD MILLION)
                                   TABLE 186 JAPAN: FOOD BLENDERS & MIXERS MARKET, BY TECHNOLOGY, 2022–2027 (USD MILLION)
                                   TABLE 187 JAPAN: FOOD BLENDERS & MIXERS MARKET, BY TYPE, 2018–2021 (USD MILLION)
                                   TABLE 188 JAPAN: FOOD BLENDERS & MIXERS MARKET, BY TYPE, 2022–2027 (USD MILLION)
             12.4.3 INDIA
                       12.4.3.1 Rising dairy industry to exhibit great potential for growth of blenders and mixers
                                   TABLE 189 INDIA: FOOD BLENDERS & MIXERS MARKET, BY APPLICATION, 2018–2021 (USD MILLION)
                                   TABLE 190 INDIA: FOOD BLENDERS & MIXERS MARKET, BY APPLICATION, 2022–2027 (USD MILLION)
                                   TABLE 191 INDIA: FOOD BLENDERS & MIXERS MARKET, BY TECHNOLOGY, 2018–2021 (USD MILLION)
                                   TABLE 192 INDIA: FOOD BLENDERS & MIXERS MARKET, BY TECHNOLOGY, 2022–2027 (USD MILLION)
                                   TABLE 193 INDIA: FOOD BLENDERS & MIXERS MARKET, BY TYPE, 2018–2021 (USD MILLION)
                                   TABLE 194 INDIA: FOOD BLENDERS & MIXERS MARKET, BY TYPE, 2022–2027 (USD MILLION)
             12.4.4 AUSTRALIA & NEW ZEALAND
                       12.4.4.1 Increasing acceptance of packaged and RTE products to drive growth of blenders and mixers
                                   TABLE 195 AUSTRALIA & NEW ZEALAND: FOOD BLENDERS & MIXERS MARKET, BY APPLICATION, 2018–2021 (USD MILLION)
                                   TABLE 196 AUSTRALIA & NEW ZEALAND: FOOD BLENDERS & MIXERS MARKET, BY APPLICATION, 2022–2027 (USD MILLION)
                                   TABLE 197 AUSTRALIA & NEW ZEALAND: FOOD BLENDERS & MIXERS MARKET, BY TECHNOLOGY, 2018–2021 (USD MILLION)
                                   TABLE 198 AUSTRALIA & NEW ZEALAND: FOOD BLENDERS & MIXERS MARKET, BY TECHNOLOGY, 2022–2027 (USD MILLION)
                                   TABLE 199 AUSTRALIA & NEW ZEALAND: FOOD BLENDERS & MIXERS MARKET, BY TYPE, 2018–2021 (USD MILLION)
                                   TABLE 200 AUSTRALIA & NEW ZEALAND: FOOD BLENDERS & MIXERS MARKET, BY TYPE, 2022–2027 (USD MILLION)
             12.4.5 REST OF ASIA PACIFIC
                       TABLE 201 REST OF ASIA PACIFIC: FOOD BLENDERS & MIXERS MARKET, BY APPLICATION, 2018–2021 (USD MILLION)
                       TABLE 202 REST OF ASIA PACIFIC: FOOD BLENDERS & MIXERS MARKET, BY APPLICATION, 2022–2027 (USD MILLION)
                       TABLE 203 REST OF ASIA PACIFIC: FOOD BLENDERS & MIXERS MARKET, BY TECHNOLOGY, 2018–2021 (USD MILLION)
                       TABLE 204 REST OF ASIA PACIFIC:FOOD BLENDERS AND MIXERS MARKET, BY TECHNOLOGY, 2022–2027 (USD MILLION)
                       TABLE 205 REST OF ASIA PACIFIC: FOOD BLENDERS & MIXERS MARKET, BY TYPE, 2018–2021 (USD MILLION)
                       TABLE 206 REST OF ASIA PACIFIC: FOOD BLENDERS & MIXERS MARKET, BY TYPE, 2022–2027 (USD MILLION)
     12.5 SOUTH AMERICA 
               TABLE 207 SOUTH AMERICA: FOOD BLENDERS & MIXERS MARKET, BY COUNTRY, 2018–2021 (USD MILLION)
               TABLE 208 SOUTH AMERICA: FOOD BLENDERS & MIXERS MARKET, BY COUNTRY, 2022–2027 (USD MILLION)
               TABLE 209 SOUTH AMERICA: FOOD BLENDERS & MIXERS MARKET, BY APPLICATION, 2018–2021 (USD MILLION)
               TABLE 210 SOUTH AMERICA: FOOD BLENDERS & MIXERS MARKET, BY APPLICATION, 2022–2027 (USD MILLION)
               TABLE 211 SOUTH AMERICA: MARKET FOR DAIRY PRODUCTS, BY SUB-TYPE, 2018–2021 (USD MILLION)
               TABLE 212 SOUTH AMERICA: FOOD BLENDERS & MIXERS MARKET FOR DAIRY PRODUCTS, BY SUB-TYPE, 2022–2027 (USD MILLION)
               TABLE 213 SOUTH AMERICA: FOOD BLENDERS & MIXERS MARKET FOR BEVERAGES, BY SUB-TYPE, 2018–2021 (USD MILLION)
               TABLE 214 SOUTH AMERICA: FOOD BLENDERS & MIXERS MARKET FOR BEVERAGES, BY SUB-TYPE, 2022–2027 (USD MILLION)
               TABLE 215 SOUTH AMERICA: FOOD BLENDERS & MIXERS MARKET, BY MODE OF OPERATION, 2018–2021 (USD MILLION)
               TABLE 216 SOUTH AMERICA: FOOD BLENDERS & MIXERS MARKET, BY MODE OF OPERATION, 2022–2027 (USD MILLION)
               TABLE 217 SOUTH AMERICA: FOOD BLENDERS & MIXERS MARKET, BY TECHNOLOGY, 2018–2021 (USD MILLION)
               TABLE 218 SOUTH AMERICA: FOOD BLENDERS & MIXERS MARKET, BY TECHNOLOGY, 2022–2027 (USD MILLION)
               TABLE 219 SOUTH AMERICA: FOOD BLENDERS & MIXERS MARKET, BY TYPE, 2018–2021 (USD MILLION)
               TABLE 220 SOUTH AMERICA: FOOD BLENDERS & MIXERS MARKET, BY TYPE, 2022–2027 (USD MILLION)
             12.5.1 BRAZIL
                       12.5.1.1 Increasing consumption of processed and frozen foods and usage in new applications to bolster growth prospects
                                   TABLE 221 BRAZIL: FOOD BLENDERS & MIXERS MARKET, BY APPLICATION, 2018–2021 (USD MILLION)
                                   TABLE 222 BRAZIL: FOOD BLENDERS & MIXERS MARKET, BY APPLICATION, 2022–2027 (USD MILLION)
                                   TABLE 223 BRAZIL: FOOD BLENDERS & MIXERS MARKET, BY TECHNOLOGY, 2018–2021 (USD MILLION)
                                   TABLE 224 BRAZIL: FOOD BLENDERS AND MIXERS MARKET, BY TECHNOLOGY, 2022–2027 (USD MILLION)
                                   TABLE 225 BRAZIL: FOOD BLENDERS & MIXERS MARKET, BY TYPE, 2018–2021 (USD MILLION)
                                   TABLE 226 BRAZIL: FOOD BLENDERS & MIXERS MARKET, BY TYPE, 2022–2027 (USD MILLION)
             12.5.2 ARGENTINA
                       12.5.2.1 Growing investments and government initiatives to encourage growth of food blenders & mixers
                                   TABLE 227 ARGENTINA: FOOD BLENDERS & MIXERS MARKET, BY APPLICATION, 2018–2021 (USD MILLION)
                                   TABLE 228 ARGENTINA: FOOD BLENDERS & MIXERS MARKET, BY APPLICATION, 2022–2027 (USD MILLION)
                                   TABLE 229 ARGENTINA: FOOD BLENDERS AND MIXERS MARKET, BY TECHNOLOGY, 2018–2021 (USD MILLION)
                                   TABLE 230 ARGENTINA: FOOD BLENDERS & MIXERS MARKET, BY TECHNOLOGY, 2022–2027 (USD MILLION)
                                   TABLE 231 ARGENTINA: FOOD BLENDERS & MIXERS MARKET, BY TYPE, 2018–2021 (USD MILLION)
                                   TABLE 232 ARGENTINA: FOOD BLENDERS & MIXERS MARKET, BY TYPE, 2022–2027 (USD MILLION)
             12.5.3 REST OF SOUTH AMERICA
                       TABLE 233 REST OF SOUTH AMERICA: FOOD BLENDERS & MIXERS MARKET, BY APPLICATION, 2018–2021 (USD MILLION)
                       TABLE 234 REST OF SOUTH AMERICA: FOOD BLENDERS & MIXERS MARKET, BY APPLICATION, 2022–2027 (USD MILLION)
                       TABLE 235 REST OF SOUTH AMERICA: FOOD BLENDERS & MIXERS MARKET, BY TECHNOLOGY, 2018–2021 (USD MILLION)
                       TABLE 236 REST OF SOUTH AMERICA: FOOD BLENDERS & MIXERS MARKET, BY TECHNOLOGY, 2022–2027 (USD MILLION)
                       TABLE 237 REST OF SOUTH AMERICA: FOOD BLENDERS & MIXERS MARKET, BY TYPE, 2018–2021 (USD MILLION)
                       TABLE 238 REST OF SOUTH AMERICA: FOOD BLENDERS & MIXERS MARKET, BY TYPE, 2022–2027 (USD MILLION)
     12.6 REST OF THE WORLD 
               TABLE 239 REST OF THE WORLD: FOOD BLENDERS & MIXERS MARKET, BY SUB-REGION, 2018–2021 (USD MILLION)
               TABLE 240 REST OF THE WORLD: FOOD BLENDERS & MIXERS MARKET, BY SUB-REGION, 2022–2027 (USD MILLION)
               TABLE 241 REST OF THE WORLD: FOOD BLENDERS & MIXERS MARKET, BY APPLICATION, 2018–2021 (USD MILLION)
               TABLE 242 REST OF THE WORLD: MARKET, BY APPLICATION, 2022–2027 (USD MILLION)
               TABLE 243 REST OF THE WORLD: FOOD BLENDERS & MIXERS MARKET FOR DAIRY PRODUCTS, BY SUB-TYPE, 2018–2021 (USD MILLION)
               TABLE 244 REST OF THE WORLD: FOOD BLENDERS & MIXERS MARKET FOR DAIRY PRODUCTS, BY SUB-TYPE, 2022–2027 (USD MILLION)
               TABLE 245 REST OF THE WORLD: FOOD BLENDERS & MIXERS MARKET FOR BEVERAGES, BY SUB-TYPE, 2018–2021 (USD MILLION)
               TABLE 246 REST OF THE WORLD: FOOD BLENDERS & MIXERS MARKET FOR BEVERAGES, BY SUB-TYPE, 2022–2027 (USD MILLION)
               TABLE 247 REST OF THE WORLD: FOOD BLENDERS & MIXERS MARKET, BY MODE OF OPERATION, 2018–2021 (USD MILLION)
               TABLE 248 REST OF THE WORLD: FOOD BLENDERS & MIXERS MARKET, BY MODE OF OPERATION, 2022–2027 (USD MILLION)
               TABLE 249 REST OF THE WORLD: FOOD BLENDERS AND MIXERS MARKET, BY TECHNOLOGY, 2018–2021 (USD MILLION)
               TABLE 250 REST OF THE WORLD: FOOD BLENDERS & MIXERS MARKET, BY TECHNOLOGY, 2022–2027 (USD MILLION)
               TABLE 251 REST OF THE WORLD: FOOD BLENDERS & MIXERS MARKET, BY TYPE, 2018–2021 (USD MILLION)
               TABLE 252 REST OF THE WORLD: FOOD BLENDERS & MIXERS MARKET, BY TYPE, 2022–2027 (USD MILLION)
             12.6.1 MIDDLE EAST
                       12.6.1.1 Rising investments from food processing industry players and government initiatives to drive market
                                   TABLE 253 MIDDLE EAST: FOOD BLENDERS & MIXERS MARKET, BY APPLICATION, 2018–2021 (USD MILLION)
                                   TABLE 254 MIDDLE EAST: FOOD BLENDERS & MIXERS MARKET, BY APPLICATION, 2022–2027 (USD MILLION)
                                   TABLE 255 MIDDLE EAST: FOOD BLENDERS & MIXERS MARKET, BY TECHNOLOGY, 2018–2021 (USD MILLION)
                                   TABLE 256 MIDDLE EAST: FOOD BLENDERS & MIXERS MARKET, BY TECHNOLOGY, 2022–2027 (USD MILLION)
                                   TABLE 257 MIDDLE EAST: FOOD BLENDERS & MIXERS MARKET, BY TYPE, 2018–2021 (USD MILLION)
                                   TABLE 258 MIDDLE EAST: FOOD BLENDERS & MIXERS MARKET, BY TYPE, 2022–2027 (USD MILLION)
             12.6.2 AFRICA
                       12.6.2.1 Increasing trade agreements to bolster food processing industry to drive demand for blenders and mixers
                                   TABLE 259 AFRICA: FOOD BLENDERS & MIXERS MARKET, BY APPLICATION, 2018–2021 (USD MILLION)
                                   TABLE 260 AFRICA: FOOD BLENDERS & MIXERS MARKET, BY APPLICATION, 2022–2027 (USD MILLION)
                                   TABLE 261 AFRICA: FOOD BLENDERS & MIXERS MARKET, BY TECHNOLOGY, 2018–2021 (USD MILLION)
                                   TABLE 262 AFRICA: FOOD BLENDERS & MIXERS MARKET, BY TECHNOLOGY, 2022–2027 (USD MILLION)
                                   TABLE 263 AFRICA: FOOD BLENDERS & MIXERS MARKET, BY TYPE, 2018–2021 (USD MILLION)
                                   TABLE 264 AFRICA: FOOD BLENDERS & MIXERS MARKET, BY TYPE, 2022–2027 (USD MILLION)
 
13 COMPETITIVE LANDSCAPE (Page No. - 255)
     13.1 OVERVIEW 
     13.2 MARKET SHARE ANALYSIS 
               TABLE 265 FOOD BLENDERS & MIXERS MARKET: DEGREE OF COMPETITION (COMPETITIVE)
     13.3 KEY PLAYER STRATEGIES 
               TABLE 266 KEY PLAYER STRATEGIES
     13.4 SEGMENTAL REVENUE ANALYSIS OF KEY PLAYERS 
               FIGURE 45 SEGMENTAL REVENUE ANALYSIS OF KEY PLAYERS IN MARKET, 2017–2021 (USD BILLION)
     13.5 COMPANY EVALUATION QUADRANT (KEY PLAYERS) 
             13.5.1 STARS
             13.5.2 EMERGING LEADERS
             13.5.3 PERVASIVE PLAYERS
             13.5.4 PARTICIPANTS
                       FIGURE 46 FOOD BLENDERS & MIXERS MARKET: COMPANY EVALUATION QUADRANT, 2021 (KEY PLAYERS)
             13.5.5 PRODUCT FOOTPRINT
                       TABLE 267 COMPANY TYPE FOOTPRINT
                       TABLE 268 COMPANY APPLICATION FOOTPRINT
                       TABLE 269 COMPANY REGIONAL FOOTPRINT
                       TABLE 270 OVERALL COMPANY FOOTPRINT
     13.6 FOOD BLENDERS & MIXERS MARKET, EVALUATION QUADRANT FOR STARTUPS/SMES 
             13.6.1 PROGRESSIVE COMPANIES
             13.6.2 STARTING BLOCKS
             13.6.3 RESPONSIVE COMPANIES
             13.6.4 DYNAMIC COMPANIES
                       FIGURE 47 FOOD BLENDERS & MIXERS MARKET: COMPANY EVALUATION QUADRANT, 2021 (STARTUPS/SMES)
             13.6.5 COMPETITIVE BENCHMARKING
                       TABLE 271 FOOD BLENDERS & MIXERS MARKET: DETAILED LIST OF KEY STARTUP/SMES
                       TABLE 272 FOOD BLENDERS & MIXERS MARKET: COMPETITIVE BENCHMARKING OF KEY STARTUPS/SMES
     13.7 COMPETITIVE SCENARIO AND TRENDS 
             13.7.1 PRODUCT LAUNCHES, 2022–2019
             13.7.2 DEALS, 2022
             13.7.3 OTHERS, 2022–2019
 
14 COMPANY PROFILES (Page No. - 274)
     14.1 INTRODUCTION 
     14.2 KEY COMPANIES 
(Business overview, Products/Solutions/Services offered, Recent Developments, MNM view)*
             14.2.1 GEA GROUP
                       TABLE 273 GEA GROUP: BUSINESS OVERVIEW
                       FIGURE 48 GEA GROUP: COMPANY SNAPSHOT
                       TABLE 274 GEA GROUP: PRODUCTS/SOLUTIONS/SERVICES OFFERED
             14.2.2 TETRA LAVAL
                       TABLE 275 TETRA LAVAL: BUSINESS OVERVIEW
                       FIGURE 49 TETRA LAVAL: COMPANY SNAPSHOT
                       TABLE 276 TETRA LAVAL: PRODUCTS/SOLUTIONS/SERVICES OFFERED
                       TABLE 277 TETRA LAVAL: OTHERS
             14.2.3 SPX FLOW
                       TABLE 278 SPX FLOW: BUSINESS OVERVIEW
                       FIGURE 50 SPX FLOW: COMPANY SNAPSHOT
                       TABLE 279 SPX FLOW: PRODUCTS/SOLUTIONS/SERVICES OFFERED
                       TABLE 280 SPX FLOW: DEALS
             14.2.4 ALFA LAVAL
                       TABLE 281 ALFA LAVAL: BUSINESS OVERVIEW
                       FIGURE 51 ALFA LAVAL: COMPANY SNAPSHOT
                       TABLE 282 ALFA LAVAL: PRODUCTS/SOLUTIONS/SERVICES OFFERED
                       TABLE 283 ALFA LAVAL: OTHERS
             14.2.5 MAREL
                       TABLE 284 MAREL: BUSINESS OVERVIEW
                       FIGURE 52 MAREL: COMPANY SNAPSHOT
                       TABLE 285 MAREL: PRODUCTS/SOLUTIONS/SERVICES OFFERED
                       TABLE 286 MAREL: OTHERS
             14.2.6 KRONES AG
                       TABLE 287 KRONES AG: BUSINESS OVERVIEW
                       FIGURE 53 KRONES AG: COMPANY SNAPSHOT
                       TABLE 288 KRONES AG: PRODUCTS/SOLUTIONS/SERVICES OFFERED
             14.2.7 SULZER LTD
                       TABLE 289 SULZER LTD: BUSINESS OVERVIEW
                       FIGURE 54 SULZER LTD: COMPANY SNAPSHOT
                       TABLE 290 SULZER LTD: PRODUCTS/SOLUTIONS/SERVICES OFFERED
                       TABLE 291 SULZER LTD: PRODUCT LAUNCHES
                       TABLE 292 SULZER LTD: OTHERS
             14.2.8 BÜHLER
                       TABLE 293 BÜHLER: BUSINESS OVERVIEW
                       FIGURE 55 BÜHLER: COMPANY SNAPSHOT
                       TABLE 294 BÜHLER: PRODUCTS/SOLUTIONS/SERVICES OFFERED
                       TABLE 295 BÜHLER: DEALS
                       TABLE 296 BÜHLER: OTHERS
             14.2.9 JBT
                       TABLE 297 JBT: BUSINESS OVERVIEW
                       FIGURE 56 JBT: COMPANY SNAPSHOT
                       TABLE 298 JBT: PRODUCTS/SOLUTIONS/SERVICES OFFERED
                       TABLE 299 JBT: OTHERS
             14.2.10 KHS GROUP
                       TABLE 300 KHS GROUP: BUSINESS OVERVIEW
                       TABLE 301 KHS GROUP: PRODUCTS/SOLUTIONS/SERVICES OFFERED
                       TABLE 302 KHS GROUP: OTHERS
             14.2.11 HOSOKAWA MICRON GROUP
                       TABLE 303 HOSOKAWA MICRON GROUP: BUSINESS OVERVIEW
                       FIGURE 57 HOSOKAWA MICRON GROUP: COMPANY SNAPSHOT
                       TABLE 304 HOSOKAWA MICRON GROUP: PRODUCTS/SOLUTIONS/SERVICES OFFERED
                       TABLE 305 HOSOKAWA MICRON GROUP: OTHERS
             14.2.12 AMIXON GMBH
                       TABLE 306 AMIXON GMBH: BUSINESS OVERVIEW
                       TABLE 307 AMIXON GMBH: PRODUCTS/SOLUTIONS/SERVICES OFFERED
             14.2.13 TECHNOSILOS AP
                       TABLE 308 TECHNOSILOS AP: BUSINESS OVERVIEW
                       TABLE 309 TECHNOSILOS AP: PRODUCTS/SOLUTIONS/SERVICES OFFERED
             14.2.14 ADMIX, INC.
                       TABLE 310 ADMIX, INC.: BUSINESS OVERVIEW
                       TABLE 311 ADMIX, INC.: PRODUCTS/SOLUTIONS/SERVICES OFFERED
                       TABLE 312 ADMIX, INC.: PRODUCT LAUNCHES
                       TABLE 313 ADMIX, INC.: DEALS
             14.2.15 NANO PHARM TECH MACHINERY EQUIPMENT CO LTD
                       TABLE 314 NANO PHARM TECH MACHINERY EQUIPMENT CO LTD: BUSINESS OVERVIEW
                       TABLE 315 NANO PHARM TECH MACHINERY EQUIPMENT CO LTD: PRODUCTS/SOLUTIONS/SERVICES OFFERED
     14.3 OTHER PLAYERS 
             14.3.1 TGD MAKINE SAN. VE TIC. LTD. STI.
                       TABLE 316 TGD MAKINE SAN. VE TIC. LTD. STI.: BUSINESS OVERVIEW
                       TABLE 317 TGD MAKINE SAN. VE TIC. LTD. STI.: PRODUCTS/SOLUTIONS/SERVICES OFFERED
             14.3.2 AUTOMATED PROCESS EQUIPMENT CORPORATION
                       TABLE 318 AUTOMATED PROCESS EQUIPMENT CORPORATION: BUSINESS OVERVIEW
                       TABLE 319 AUTOMATED PROCESS EQUIPMENT CORPORATION: PRODUCTS/SOLUTIONS/SERVICES OFFERED
             14.3.3 STK MAKINA
                       TABLE 320 STK MAKINA: BUSINESS OVERVIEW
                       TABLE 321 STK MAKINA: PRODUCTS/SOLUTIONS/SERVICES OFFERED
             14.3.4 SILVERSON MACHINES, INC.
                       TABLE 322 SILVERSON MACHINES, INC.: BUSINESS OVERVIEW
                       TABLE 323 SILVERSON MACHINES, INC.: PRODUCTS/SOLUTIONS/SERVICES OFFERED
             14.3.5 CHARLES ROSS & SON COMPANY
                       TABLE 324 CHARLES ROSS & SON COMPANY: BUSINESS OVERVIEW
                       TABLE 325 CHARLES ROSS & SON COMPANY: PRODUCTS/SOLUTIONS/SERVICES OFFERED
                       TABLE 326 CHARLES ROSS & SON COMPANY: PRODUCT LAUNCHES
                       TABLE 327 CHARLES ROSS & SON COMPANY: OTHERS
             14.3.6 LASER S.R.L
             14.3.7 DIOSNA
             14.3.8 GEMCO
             14.3.9 ARDE BARINCO INC.
               14.3.10 EKATO HOLDING GMBH
*Details on Business overview, Products/Solutions/Services offered, Recent Developments, MNM view might not be captured in case of unlisted companies.
 
15 ADJACENT & RELATED MARKETS (Page No. - 335)
     15.1 INTRODUCTION 
     15.2 LIMITATIONS 
     15.3 FOOD PROCESSING AND HANDLING EQUIPMENT MARKET 
             15.3.1 MARKET DEFINITION
             15.3.2 MARKET OVERVIEW
             15.3.3 FOOD PROCESSING AND HANDLING EQUIPMENT MARKET, BY TYPE
                       15.3.3.1 Introduction
                                   TABLE 328 FOOD PROCESSING AND HANDLING EQUIPMENT MARKET, BY TYPE, 2017–2020 (USD MILLION)
                                   TABLE 329 FOOD PROCESSING AND HANDLING EQUIPMENT MARKET, BY TYPE, 2021–2026 (USD MILLION)
             15.3.4 FOOD PROCESSING AND HANDLING EQUIPMENT MARKET, BY REGION
                       15.3.4.1 Introduction
                                   TABLE 330 FOOD PROCESSING AND HANDLING EQUIPMENT MARKET, BY REGION, 2017–2020 (USD MILLION)
                                   TABLE 331 FOOD PROCESSING AND HANDLING EQUIPMENT MARKET, BY REGION, 2021–2026 (USD MILLION)
     15.4 BEVERAGE PROCESSING EQUIPMENT MARKET 
             15.4.1 MARKET DEFINITION
             15.4.2 MARKET OVERVIEW
             15.4.3 BEVERAGE PROCESSING EQUIPMENT MARKET, BY TYPE
                       15.4.3.1 Introduction
                                   TABLE 332 BEVERAGE PROCESSING EQUIPMENT MARKET, BY TYPE, 2017–2020 (USD MILLION)
                                   TABLE 333 BEVERAGE PROCESSING EQUIPMENT MARKET, BY TYPE, 2021–2026 (USD MILLION)
             15.4.4 BEVERAGE PROCESSING EQUIPMENT MARKET, BY REGION
                       15.4.4.1 Introduction
                                   TABLE 334 BEVERAGE PROCESSING EQUIPMENT MARKET, BY REGION, 2017–2020 (USD MILLION)
                                   TABLE 335 BEVERAGE PROCESSING EQUIPMENT MARKET, BY REGION, 2021–2026 (USD MILLION)
 
16 APPENDIX (Page No. - 343)
     16.1 DISCUSSION GUIDE 
     16.2 KNOWLEDGESTORE: MARKETSANDMARKETS’ SUBSCRIPTION PORTAL 
     16.3 CUSTOMIZATION OPTIONS 
     16.4 RELATED REPORTS 
     16.5 AUTHOR DETAILS 

The study involved four major steps in estimating the size of the food blenders and mixers market. Exhaustive secondary research was done to collect information on the market and the parent market. The next step was to validate these findings, assumptions, and sizing with industry experts across the value chain through primary research. The top-down and bottom-up approaches were employed to estimate the complete market size. After that, market breakdown and data triangulation were used to estimate the market size of segments and subsegments.

Secondary Research

In the secondary research process, various sources, such as the International Safety Equipment Association (ISEA) and the Association of Equipment Manufacturers, were referred to, to identify and collect information for this study. It also includes clinical studies and journals, press releases, investor presentations of companies, white papers, certified publications, articles by recognized authors and regulatory bodies, trade directories, and paid databases.

Secondary research was mainly conducted to obtain key information about the industry’s supply chain, the total pool of key players, market classification & segmentation according to the industry trends to the bottom-most level, and geographical markets. It was also used to obtain information about the key developments from a market-oriented perspective.

Primary Research

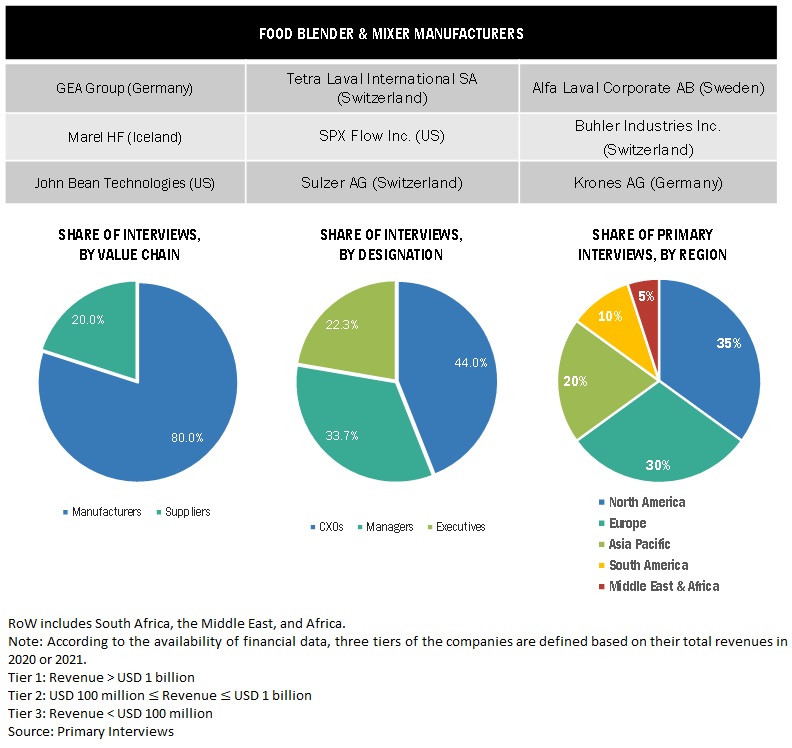
The market comprises several stakeholders in the supply chain, which include raw material suppliers and food blender & mixer manufacturers. Various primary sources from both the supply and demand sides of the market were interviewed to obtain qualitative and quantitative information. The primary interviewees from the supply side include food blender & mixer manufacturers. The primary sources from the demand side include distributors, importers, exporters, and end-users.

The primary interviewees from the supply side include food blender and mixer manufacturers. The primary sources from the demand side include distributors, importers, exporters, and end-use sectors.
Food Blenders and Mixers Market Size, and Share

To know about the assumptions considered for the study, download the pdf brochure

Market Size Estimation

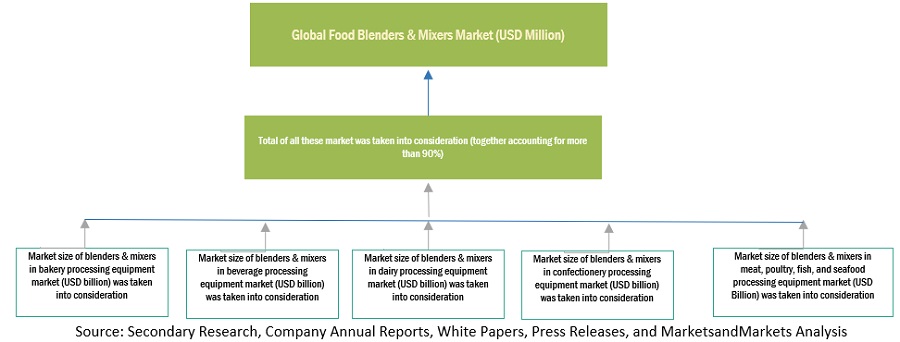
The top-down and bottom-up approaches have been used to estimate and validate the total size of the food blender and mixers market. These approaches have also been used extensively to determine the size of the various sub-segments in the market. The research methodology used to estimate the market size includes the following details:

  • The key players in the industry and market have been identified through extensive secondary research.
  • The food blenders and mixers value chain and market size in terms of value have been determined through primary and secondary research.
  • All percentage shares, splits, and breakdowns were determined using secondary sources and verified through primary sources.
  • All macroeconomic and microeconomic factors affecting the growth of the food blender and mixers market were considered while estimating the market size.
  • All the possible parameters that affect the market covered in this research study have been accounted for, viewed in extensive detail, verified through primary research, and analyzed to obtain the final quantitative and qualitative data.

The following sections (bottom-up & top-down) depict the overall market size estimation process employed for the purpose of this study.

Bottom-up

  • With the bottom-up approach, food blenders and mixers for technology, application, type, mode of operation, and region were added to arrive at the global and regional market size and CAGR.
  • The bottom-up procedure has been employed to arrive at the overall size of the food blender and mixers market from the revenues of key players (companies) and their product share in the market.
  • The market share was then estimated for each company to verify the revenue share used earlier in the bottom-up procedure. With the data triangulation procedure and data validation through primaries, the exact values of the overall parent and each market have been determined and confirmed in this study. The data triangulation procedure implemented for this study is explained in the next section.
Food Blenders and Mixers Market Size, and Share

To know about the assumptions considered for the study, Request for Free Sample Report

Top-Down

In the top-down approach, the overall market size was used to estimate the size of individual markets (technology, application, type, mode of operation, and region) through percentage splits from secondary and primary research. The most appropriate and immediate parent market size was used to calculate each specific market segment to implement the top-down approach. The data obtained was further validated by conducting primary interviews with industry experts, key suppliers, and manufacturers of food blenders and mixers.
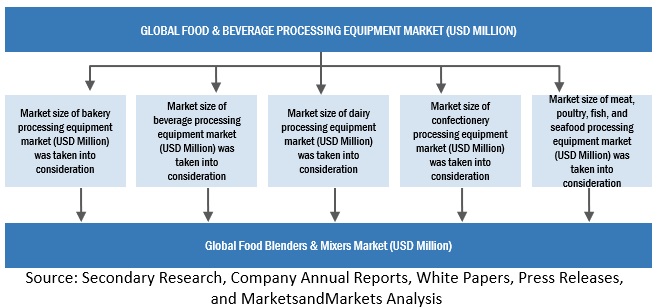
Food Blenders and Mixers Market Size, and Share

Data Triangulation

After arriving at the overall market size from the estimation process explained above, the total market was split into several segments and subsegments. Data triangulation and market breakdown procedures were employed to estimate the overall food blenders & mixers market and arrive at the exact statistics for all segments and subsegments. The data was triangulated by studying various factors and trends from the demand and supply sides. Also, the market size was validated using both the top-down and bottom-up approaches.

Report Objectives:

Market Intelligence

  • Determining and projecting the size of the food blenders and mixers market with respect to target technology, application, type, mode of operation, and region, over five years, ranging from 2022 to 2027
  • Identifying the attractive opportunities in the market by determining the largest and fastest-growing segments across the key regions
    • Analyzing the demand-side factors based on the following:
  • Impact of macro- and micro-economic factors on the market
  • Shifts in demand patterns across different subsegments and regions

Competitive Intelligence

  • Identifying and profiling the key market players in the food blenders and mixers market
  • Determining the market share of key players operating in the food blender and mixers market
  • Providing a comparative analysis of the market leaders on the basis of the following:
    • Service offerings
    • Business strategies
    • Strengths and weaknesses
    • Key financials
  • Understanding the competitive landscape and identifying the major growth strategies adopted by players across the key regions
  • Providing insights on the trade scenario

Customization Options

With the given market data, MarketsandMarkets offers customizations according to the company’s specific scientific needs.

The following customization options are available for the report:

Segment Analysis

  • A further breakdown of food blenders and mixers by type.

Geographic Analysis

  • Further breakdown and customization are available for the South American food blender and mixers market by key countries, such as Colombia, Venezuela, and Peru.
  • Further analysis of the South American market can be included in the market analysis for food blenders and mixers.

Company Information

  • Detailed analyses and profiling of additional market players (up to five)
Custom Market Research Services

We will customize the research for you, in case the report listed above does not meet with your exact requirements. Our custom research will comprehensively cover the business information you require to help you arrive at strategic and profitable business decisions.

Request Customization

Instant Answers with GPT - Ask Now!

Ask real questions. Get complete answers !
Report Code
FB 3444
Published ON
Jan, 2023
Choose License Type
BUY NOW
  • SHARE
X
Request Customization
Speak to Analyst
Speak to Analyst
OR FACE-TO-FACE MEETING
PERSONALIZE THIS RESEARCH
  • Triangulate with your Own Data
  • Get Data as per your Format and Definition
  • Gain a Deeper Dive on a Specific Application, Geography, Customer or Competitor
  • Any level of Personalization
REQUEST A FREE CUSTOMIZATION
LET US HELP YOU!
  • What are the Known and Unknown Adjacencies Impacting the Food Blenders and Mixers Market
  • What will your New Revenue Sources be?
  • Who will be your Top Customer; what will make them switch?
  • Defend your Market Share or Win Competitors
  • Get a Scorecard for Target Partners
CUSTOMIZED WORKSHOP REQUEST
+1-888-600-6441
  • Call Us
  • +1-888-600-6441 (Corporate office hours)
  • +1-888-600-6441 (US/Can toll free)
  • +44-800-368-9399 (UK office hours)
CONNECT WITH US
ABOUT TRUST ONLINE
©2024 MarketsandMarkets Research Private Ltd. All rights reserved
DMCA.com Protection Status Website Feedback