Building Management System Market by Software (Facility, Security, Energy, Emergency, Infrastructure Management), Service (Professional, Managed), Application (Residential, Commercial, Industrial), and Geography - Global Forecast to 2036


 Exclusive indicates content/data unique to MarketsandMarkets and not available with any competitors.
Table of Contents
1 Introduction (Page No. - 13)
1.1 Study Objectives
1.2 Market Definition
1.3 Study Scope
1.3.1 Markets Covered
1.3.2 Geographic Scope
1.3.3 Years Considered for the Study
1.4 Currency
1.5 Limitations
1.6 Market Stakeholders
2 Research Methodology (Page No. - 17)
2.1 Research Data
2.1.1 Secondary Data
2.1.1.1 List of Major Secondary Sources
2.1.1.2 Secondary Sources
2.1.2 Primary Data
2.1.2.1 Primary Interviews With Experts
2.1.2.2 Breakdown of Primaries
2.1.2.3 Key Data From Primary Sources
2.1.3 Secondary and Primary Research
2.1.3.1 Key Industry Insights
2.2 Market Size Estimation
2.2.1 Bottom-Up Approach
2.2.1.1 Approach for Capturing the Market Share By Bottom-Up Analysis (Demand Side)
2.2.2 Top-Down Approach
2.2.2.1 Approach for Capturing the Market Share By Top-Down Analysis (Supply Side)
2.3 Market Breakdown and Data Triangulation
2.4 Research Assumptions
3 Executive Summary (Page No. - 28)
4 Premium Insights (Page No. - 32)
4.1 Attractive Market Opportunities in the Global Building Management System Market
4.2 Market, By Software
4.3 Market in Europe, By Software/Service Type and Application
4.4 Analysis of Market Based on Country
4.5 Market Size, By Application
5 Market Overview (Page No. - 36)
5.1 Introduction
5.2 Value Chain Analysis
5.3 Market Dynamics
5.3.1 Drivers
5.3.1.1 Significant Cost Benefits to Industrial, Commercial, and Residential Users
5.3.1.2 Simplified Building Operation and Maintenance
5.3.1.3 Increasing Demand for Energy-Efficient and Eco-Friendly Buildings
5.3.1.4 Growing Integration of Iot
5.3.2 Restraints
5.3.2.1 High Implementation Costs
5.3.2.2 Lack of Technically Skilled Workers
5.3.3 Opportunities
5.3.3.1 Integration of Analytics in Building Management
5.3.3.2 Growing Demand From the Emerging Economies
5.3.4 Challenges
5.3.4.1 Lack of Awareness Regarding the Bms in Various Geographies
6 Market, By Software (Page No. - 44)
6.1 Introduction
6.2 Facility Management
6.2.1 Lighting Control
6.2.2 HVAC Control
6.3 Security Management
6.3.1 Video Surveillance
6.3.2 Access Control
6.4 Energy Management
6.5 Emergency Management
6.6 Infrastructure Management
7 Market, By Service Type (Page No. - 54)
7.1 Introduction
7.2 Professional Services
7.3 Managed Services
8 Market, By Application (Page No. - 60)
8.1 Introduction
8.2 Residential
8.3 Commercial
8.3.1 Office Buildings
8.3.2 Retail and Public Buildings
8.3.3 Educational Institutes
8.3.4 Hospitals and Healthcare Facilities
8.3.5 Airports and Railways
8.3.6 Others
8.4 Industrial
9 Geographic Analysis (Page No. - 67)
9.1 Introduction
9.2 Americas
9.2.1 US
9.2.2 Canada
9.2.3 Mexico
9.2.4 Rest of the Americas
9.3 Europe
9.3.1 France
9.3.2 Germany
9.3.3 Italy
9.3.4 UK
9.3.5 Rest of Europe
9.4 APAC
9.4.1 Japan
9.4.2 China
9.4.3 India
9.4.4 Rest of APAC
9.5 RoW
9.5.1 Middle East
9.5.2 Africa
10 Competitive Landscape (Page No. - 89)
10.1 Overview
10.2 Market Ranking Analysis
10.3 Competitive Scenario
10.4 Vendor Dive Overview
10.4.1 Vanguards
10.4.2 Dynamic
10.4.3 Innovator
10.4.4 Emerging
10.5 Competitive Benchmarking
10.5.1 Analysis of Business Strategy Parameters for Major Players in Market (25 Companies)
10.5.2 Analysis of Product Offering Parameters for Major Players in Market (25 Companies)
Top 25 Companies Analyzed for This Study are - Honeywell International Inc.; Johnson Controls International PLC; Schneider Electric SE; Siemens AG; United Technologies Corp.; ABB Ltd.; Azbil Corporation; Delta Controls; Larsen & Toubro Limited.; Mitsubishi Electric Corporation; Robert Bosch GmbH; Singapore Technologies Electronics Limited; Dexma Sensors, S.L.; Eagle Technology; Legrand Sa; Lutron Electronics Co., Inc.; Technovator International Limited.; Airedale International Air Conditioning Ltd; Buildingiq, Inc.; Distech Controls Inc.; Gridpoint, Inc.; Lucid
11 Company Profiles (Page No. - 96)
(Business Overview, Products Offered & Services Strategies, Key Insights, Recent Developments, MnM View)*
11.1 Introduction
11.2 Johnson Controls International PLC
11.3 Honeywell International Inc.
11.4 Siemens AG
11.5 Schneider Electric SE
11.6 United Technologies Corp.
11.7 IBM Corporation
11.8 Ingersoll-Rand PLC
11.9 Delta Controls
11.10 Crestron Electronics, Inc.
11.11 Buildingiq, Inc.
11.12 Startup Ecosystem
11.12.1 Introduction
11.12.2 Lucid
11.12.3 Distech Controls Inc.
11.12.4 Gridpoint, Inc.
*Details on Business Overview, Products Offered & Services Strategies, Key Insights, Recent Developments, MnM View Might Not Be Captured in Case of Unlisted Companies.
12 Appendix (Page No. - 128)
12.1 Insights of Industry Experts
12.2 Discussion Guide
12.3 Knowledge Store: Marketsandmarkets’ Subscription Portal
12.4 Introducing RT: Real-Time Market Intelligence
12.5 Available Customizations
12.6 Related Reports
12.7 Author Details
List of Tables (61 Tables)
Table 1 Building Management System Market, By Software and Service Type, 2014-2023 (USD Billion)
Table 2 Market, By Software, 2014–2023 (USD Million)
Table 3 Market for Software, By Region, 2014–2023 (USD Million)
Table 4 Market for Software, By Application, 2014–2023 (USD Million)
Table 5 Market for Facility Management, By Region, 2014–2023 (USD Million)
Table 6 Market for Facility Management, By Type, 2014–2023 (USD Million)
Table 7 Market for Facility Management for Lighting Control, By Region, 2014–2023 (USD Million)
Table 8 Market for Facility Management for HVAC Control, By Region, 2014–2023 (USD Million)
Table 9 Market for Security Management, By Region, 2014–2023 (USD Million)
Table 10 Market for Security Management, By Type, 2014–2023 (USD Million)
Table 11 Market for Security Management for Video Surveillance, By Region, 2014–2023 (USD Million)
Table 12 Market for Security Management for Access Control, By Region, 2014–2023 (USD Million)
Table 13 Market for Energy Management, By Region, 2014–2023 (USD Million)
Table 14 Market for Emergency Management, By Region, 2014–2023 (USD Million)
Table 15 Market for Infrastructure Management, By Region, 2014–2023 (USD Million)
Table 16 Market, By Service Type, 2014–2023 (USD Million)
Table 17 Market for Service Type, By Region, 2014–2023 (USD Million)
Table 18 Market for Service Type, By Application, 2014–2023 (USD Million)
Table 19 Market for Professional Services, By Type, 2014–2023 (USD Million)
Table 20 Market for Professional Services, By Region, 2014–2023 (USD Million)
Table 21 Market for Professional Services, By Application, 2014–2023 (USD Million)
Table 22 Market for Managed Services, By Region, 2014–2023 (USD Million)
Table 23 Market for Managed Services, By Application, 2014–2023 (USD Million)
Table 24 Market, By Application, 2014–2023 (USD Billion)
Table 25 Market for Residential, By Software and Service Type, 2014–2023 (USD Million)
Table 26 Market for Residential Application, By Region, 2014–2023 (USD Million)
Table 27 Market for Commercial, By Type, 2014–2023 (USD Million)
Table 28 Market for Commercial, By Software and Service Type, 2014–2023 (USD Million)
Table 29 Market for Commercial, By Region, 2014–2023 (USD Million)
Table 30 Market for Industrial, By Software and Service Type, 2014–2023 (USD Million)
Table 31 Market for Industrial, By Region, 2014–2023 (USD Million)
Table 32 Market, By Geography, 2014–2023 (USD Billion)
Table 33 Market in Americas, By Country, 2014–2023 (USD Million)
Table 34 Market in Americas, By Software and Service Type, 2014–2023 (USD Million)
Table 35 Market in Americas, By Application, 2014–2023 (USD Million)
Table 36 Market in Americas, By Software, 2014–2023 (USD Million)
Table 37 Market in Americas, By Service Type, 2014–2023 (USD Million)
Table 38 Market in Americas for Facility Management, By Type, 2014–2023 (USD Million)
Table 39 Market in Americas for Security Management Software, By Type, 2014–2023 (USD Million)
Table 40 Market in Europe, By Country, 2014–2023 (USD Million)
Table 41 Market in Europe, By Software and Service Type, 2014–2023 (USD Million)
Table 42 Market in Europe, By Application, 2014–2023 (USD Million)
Table 43 Market in Europe, By Software, 2014–2023 (USD Million)
Table 44 Market in Europe, By Service Type, 2014–2023 (USD Million)
Table 45 Market in Europe for Facility Management, By Type, 2014–2023 (USD Million)
Table 46 Market in Europe for Security Management, By Type, 2014–2023 (USD Million)
Table 47 Market in APAC, By Country, 2014–2023 (USD Million)
Table 48 Market in APAC, By Software and Service Type, 2014–2023 (USD Million)
Table 49 Market in APAC, By Application, 2014–2023 (USD Million)
Table 50 Market in APAC, By Software, 2014–2023 (USD Million)
Table 51 Market in APAC, By Service Type, 2014–2023 (USD Million)
Table 52 Market in APAC for Facility Management, By Type, 2014–2023 (USD Million)
Table 53 Market in APAC for Security Management, By Type, 2014–2023 (USD Million)
Table 54 Market in RoW, By Country, 2014–2023 (USD Million)
Table 55 Market in RoW, By Software and Service Type, 2014–2023 (USD Million)
Table 56 Market in RoW, By Application, 2014–2023 (USD Million)
Table 57 Market in RoW, By Software, 2014–2023 (USD Million)
Table 58 Market in RoW, By Service Type, 2014–2023 (USD Million)
Table 59 Market in RoW for Facility Management, By Type, 2014–2023 (USD Million)
Table 60 Building Management System Security Market in RoW for Management Software, By Type, 2014–2023 (USD Million)
Table 61 Market Ranking of the Top Players in Market, 2016
List of Figures (37 Figures)
Figure 1 Building Management System Market: Research Design
Figure 2 Process Flow of Market Size Estimation
Figure 3 Market Size Estimation Methodology: Bottom-Up Approach
Figure 4 Market Size Estimation Methodology: Top-Down Approach
Figure 5 Data Triangulation
Figure 6 Commercial Application Expected to Hold the Largest Size of Market By 2023
Figure 7 Professional Services to Hold Largest Share of Market Till 2023
Figure 8 Market for Energy Management Software to Exhibit Strongest Growth Potential During Forecast Period
Figure 9 Market in APAC to Grow at Highest CAGR During Forecast Period
Figure 10 Significant Cost Benefits and Growing Demand From Emerging Economies Expected to Boost Demand for Building Management Systems During Forecast Period
Figure 11 Facility Management Software to Hold Largest Size of Market By 2023
Figure 12 Market Expected to Be Dominated By Software and Commercial Application in 2016
Figure 13 US to Hold Largest Share of Market in 2017
Figure 14 Market for Residential Application Expected to Witness Highest CAGR During the Forecast Period
Figure 15 Value Chain Analysis: Major Value Added By Software Developers
Figure 16 Significant Cost Benefits to Industrial, Commercial, and Residential Users Drive Building Management Market
Figure 17 Market for Energy Management to Grow at Highest CAGR During the Forecast Period
Figure 18 Market for Managed Services to Grow at Higher CAGR Between 2017 and 2023
Figure 19 Commercial Application to Hold Largest Size of Market By 2023
Figure 20 Market, By Geography
Figure 21 Market in China to Grow at Highest CAGR During Forecast Period
Figure 22 Americas: BMS Snapshot (2016)
Figure 23 Europe: BMS Market Snapshot (2016)
Figure 24 APAC: BMS Market Snapshot (2016)
Figure 25 RoW: BMS Market Snapshot (2016)
Figure 26 New Product Launches as the Key Growth Strategy Adopted By Companies Between January 2016 and April 2017
Figure 27 Market: Market Evaluation Framework
Figure 28 Companies Adopted Product Launches as Key Strategy to Increase Market Share
Figure 29 Dive Chart
Figure 30 Johnson Controls International PLC: Company Snapshot
Figure 31 Honeywell International Inc.: Company Snapshot
Figure 32 Siemens AG: Company Snapshot
Figure 33 Schneider Electric SE: Company Snapshot
Figure 34 United Technologies Corp.: Company Snapshot
Figure 35 IBM Corporation: Company Snapshot
Figure 36 Ingersoll-Rand PLC: Company Snapshot
Figure 37 Buildingiq, Inc.: Company Snapshot
The sizing of the building management system market has been done by the top-down and bottom-up approaches. The bottom-up approach has been employed to arrive at the overall size of the building management systems market from the revenues of key players (companies) and their share in the market. Calculations based on the number of different building management systems that are installed in different premises and the demand from all major countries is further added, and finally the volume is multiplied by the average selling price of each building management system subscription/license to arrive the overall market size. In the top-down approach, the overall market size has been used to estimate the size of the individual markets (mentioned in the market segmentation), through percentage splits from secondary and primary researches. For the calculation of specific market segments, the most appropriate parent market size has been used to implement the top-down approach.
In the process of determining and verifying the building management systems market size for several segments and subsegments gathered through secondary research, extensive primary interviews have been conducted with key opinion leaders. The break-up of the profiles of primary participants is given in the chart below.
BREAKDOWN OF PRIMARY PARTICIPANTS
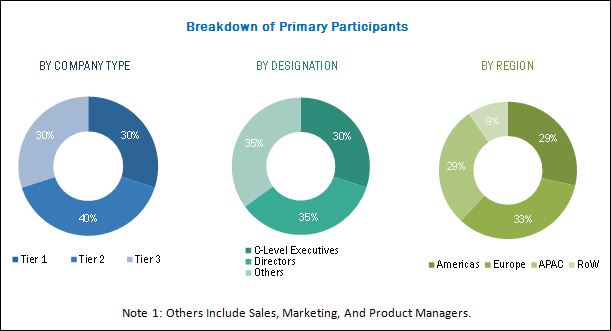
Note 1: Others include sales, marketing, and product managers.
“To know about the assumptions considered for the study, please download the pdf brochure.”
The building management system ecosystem comprises major players such as Honeywell International Inc. (US), Siemens AG (Germany), Johnson Controls International PLC (Ireland), Schneider Electric SE (France), United Technologies Corp. (US), IBM Corporation (US), Ingersoll-Rand Plc (Ireland), and Delta Controls (Canada).
Please visit 360Quadrants to see the vendor listing of Building Management System
Building Management System Market Report Scope:
|
Report Metric |
Details |
|
Report Name |
Building Management System Market |
|
Base year |
2016 |
|
Forecast period |
2017–2023 |
|
Forecast units |
Value in terms of USD million and billion |
|
Segments covered |
Product, System Type, Software & Services, Function, Industry, and Region |
|
Geographic regions covered |
North America, APAC, Europe, and RoW |
|
Companies covered |
Honeywell International Inc. (US), Siemens AG (Germany), Johnson Controls International PLC (Ireland), Schneider Electric SE (France), United Technologies Corp. (US), IBM Corporation (US), Ingersoll-Rand Plc (Ireland), and Delta Controls. |
All these companies have their own R&D facilities and extensive sales offices and distribution channels. The products of these companies can be used across various industries for respective applications. The report provides the competitive landscape of the key players, which indicates their growth strategies in the building management systems market.
Major Market Developments
- In October 2018, Honeywell announced its plan to acquire Transnorm, leading provider of warehouse automation solutions
- In April 2018, Johnson Controls acquired the assets of Triatek, a leading manufacturer of innovative airflow solutions for critical environments across the globe.
- In March 2018, Schneider Electric and AVEVA created a joint venture to form a global leader in engineering and industrial software with scale and relevance in key markets as well as an unmatched set of solutions covering all aspects of digital asset management from process simulation to design, construction and manufacturing operations management and optimization.
Target Audience:
- Raw material suppliers
- BMS designers, developers, and suppliers
- BAS equipment integrators, suppliers, and service providers
- Application software providers
- Government bodies such as regulating authorities and policy makers
- BMS-related associations, organizations, forums, and alliances
- Research institutes and organizations
- Market research and consulting firms
“The study answers several questions for the stakeholders, primarily which market segments to focus on in the next two to five years (depending on the range of the forecast period) for prioritizing the efforts and investments.”
Scope of the Report:
The markets covered in this report has been segmented as follows:
By Software
- Facility Management
- Security Management
- Energy Management
- Infrastructure Management
- Emergency Management
By Service Type
- Professional Services
- Managed Services
By Application
- Residential
- Commercial
- Industrial
Geographic Analysis
Americas
- US
- Canada
- Mexico
- Rest of Americas (Brazil, Argentina, Colombia, and Chile)
Europe
- Germany
- UK
- France
- Italy
- Rest of Europe (Ireland, Poland, Switzerland, Sweden, the Netherlands, and Austria)
APAC
- China
- Japan
- India
- Rest of APAC (Australia, South Korea, the Philippines, and Thailand)
RoW
-
Middle East
- Africa


Growth opportunities and latent adjacency in Building Management System Market
Get the PAM for BMS for Mexico, calculated 130 million, including all services and software and hardware, and engineering
I want Data on BMS market in Africa.
I'd like to know more about facility management software, and also about the trends in USA and outside Europe
All about Building Management System market trend worldwide or specifically in Asia Pacific or ASEAN countries.
BMS, BAS, KNX, Fire Alarm, HVAC, Cooling Towers, Lighting Control, ACMV, Pressurized Fans, AHUs, Dampers & etc.