Calcium Carbonate Market by Type (GCC and PCC), End-Use Industry (Paper, Plastic, Paints & Coatings, Adhesive & Sealants), and Region (APAC, North America, Europe, South America, Middle East & Africa) - Global Forecast to 2024


Updated on : February 15, 2023
Calcium Carbonate Market Analysis
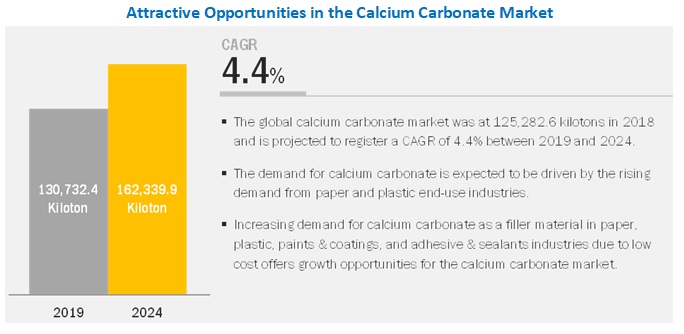
The calcium carbonate market was valued at USD 21.2 billion in 2019 and is projected to reach USD 28.3 billion by 2024, growing at a cagr 6.0% from 2019 to 2024. Also, the global calcium market was at 125,282.6 kilotons in 2018 and is projected to register a cagr 4.4% between 2019 and 2024.
Calcium carbonate is a chemical compound represented by the chemical formula CaCO3. It is estimated that about 4 percent of the earth's crust is made up of calcium carbonate. It is found naturally in the form of minerals and rocks, some of which include calcite, limestone, chalk, marble, and aragonite. Calcium carbonate is used either in its naturally occurring state or in the pure form. Pure calcium carbonate is extracted from natural sources by various techniques such as mining and quarrying. At present, calcium carbonate used is widely used for multiple functions, including as a mineral filler, whitening agent, and an alkalizing agent.
Plastic to be the fastest-growing end-use industry of calcium carbonate during the forecast period.
In terms of value, plastic is projected to be the fastest-growing end-use industry of calcium carbonate during the forecast period. This is due to the increasing demand for calcium carbonate-reinforced polypropylene from the automotive industry and the ability of calcium carbonate to enhance the properties of plastics and help in improved heat dissipation. Also, the increasing use of plastics in various end-use industries such as packaging, building & construction, and electrical & electronics has increased the demand for plastics. These factors contribute to the growth of the calcium carbonate market in the plastic industry.
APAC to dominate the calcium carbonate market during the forecast period.
The growth in the APAC region can be attributed to the growing demand for calcium carbonate from various end-use industries such as paper, plastic, adhesives & sealants, and paints & coatings.
Market Dynamics
Driver: Increasing demand from paper and plastic industries in APAC
Calcium carbonate is a critical raw material for paper and plastics. The demand for paper is increasing in APAC as digital transformation is relatively slow. The economic growth witnessed in the developing countries of APAC has led to an increase in the use of paper packaging. China, India, and South Asian countries are the largest consumers of paper in the region. Moreover, the growth of the e-commerce industry in India and China has led to an increase in the demand for corrugated packaging solutions. Paper packaging is also used in industries such as food, healthcare, education & stationery, and personal care. All these factors are increasing the demand for paper in the region.
The plastic industry in APAC is also growing at a fast rate. The region is witnessing a high demand for plastics for various applications in packaging, automotive, construction, electrical & electronics, and other industries. The increasing use of plastics in these industries for multiple purposes, such as decreasing costs in packaging and construction industries, reducing weight in automotive parts, and as an insulator in electronic products, is driving the demand for calcium carbonate in APAC.
Restraints: Increasing cost due to high transportation charges
One of the significant factors affecting the calcium carbonate processor is the assured availability of the raw material at any time in the required quantity. To ensure the desired quantities are available, the production facility has to be built in the required magnitude, including a reserve capacity, which can be deployed for production in the event of technical difficulties. To ensure supply reliability, a logistics system has to be set up, which permits rapid switching of supply from one production site to the other. At the same time, the transport costs must be kept within economically acceptable bounds. The logistic costs for calcium carbonate are at an average of 25% of the selling price, but they can vary considerably. In recent times, various companies have increased the amount of their calcium carbonate products, as an increase in the transportation cost of the raw materials is one of the factors contributing to the pricing. For instance, the increased cost of transporting PCC from the manufacturing location to the paper mill increases the overall transportation cost. Hence, one of the leading companies, Mineral Technologies, is setting up satellite plants near paper mill manufacturing facilities to reduce cost. Certain companies also transport calcium carbonate in slurry form to reduce cost, although this might affect the quality of the product. Hence, the increasing cost of transporting calcium carbonate from one site to another acts as a restraint for the market.
Opportunity: Potential applications
Currently, calcium carbonate is majorly used in the paper, plastic, paints & coatings and adhesives & sealants industries. In addition, there are some potential applications of nano calcium carbonate. Nano calcium carbonate has attracted interest among researchers, especially for therapeutic applications. Calcium carbonate-based materials have biodegradable and biocompatible properties, which are ideal as a smart carrier to deliver genes, enzymes, and drugs. Studies are being conducted to implement these nanoparticles in therapeutic applications, including as an antibacterial agent, for gene delivery to target cancer cells, and for cancer drug delivery. These potential applications present various opportunities for the growth of the calcium carbonate market in the future.
Challenge: Declining paper industry due to increasing digitization
The paper industry has been severely affected by increasing digitalization and electronic publishing. The global paper industry has reduced over the past five years due to the shift to paperless communication and digital media across most developed economies. The demand for newsprint paper has also severely declined in recent years due to oversupply issues. The increasing use of digital media is progressively replacing paper, thereby hampering the market for office paper and newsprint paper, which is shrinking by about 5% per year. As calcium carbonate is widely used as a filler in writing & printing paper, newsprint paper, and paper packaging applications, the increasing digitalization acts a challenge for the market.
Scope of the Report
|
Report Metric |
Details |
|
Market size available for years |
2017-2024 |
|
Base year considered |
2018 |
|
Forecast period |
2019-2024 |
|
Forecast units |
Value (USD Million) and Volume (Kiloton) |
|
Segments covered |
Type, End-use Industry, and Region |
|
Geographies covered |
APAC, Europe, North America, Middle East & Africa, and South America |
|
Companies covered |
Imerys (France), Omya AG (Switzerland), Minerals Technologies Inc. (US), Huber Engineered Materials (US), Mississippi Lime Company (US), Carmeuse (Belgium), Sibelco (Belgium), Midwest Calcium Carbonate (US), Calcinor SA (Spain), Excalibar Minerals LLC (US), among others, total 25 key players of calcium carbonate market are covered. |
The research report categorizes the market to forecast the revenues and analyze the trends in each of the following sub-segments:
Calcium carbonate market, by type:
- Ground calcium carbonate (GCC)
- Precipitated calcium carbonate (PCC)
Calcium carbonate market, by end-use industry:
- Paper
- Plastic
- Paints & Coatings
- Adhesives & Sealants
- Others (rubber, environment, pharmaceutical, cosmetic, food, oil & gas, and others)
Calcium carbonate market, by region:
- APAC
- Europe
- North America
- Middle East & Africa
- South America
Key Market Players
Imerys (France), Omya AG (Switzerland), Minerals Technologies Inc. (US), Huber Engineered Materials (US), Mississippi Lime Company (US).
Recent Developments
- In November 2018, Omya AG introduced a new functionalized calcium carbonate for use in biopolymers under the brand name, Omya Smartfill 55– OM. The new calcium carbonate is particularly used as filler material for polylactic acid (PLA) as this demonstrates almost no hydrolysis when processed at filler loads of up to 40%.
- In June 2018, Omya AG launched a new generation of recrystallized mineral particles for use in decorative cosmetic applications under the brand name, Omyaskin. This product is used in pigments of cosmetic products as it helps to improve the effectiveness of end-products.
- In July 2015, Imerys Carbonates, a business segment of Imerys, introduced a new Life Elements product line, which is designed to positively impact the effectiveness and longevity of food and pharmaceutical products. Through this product line, the company is offering I-Blum Calcium Carbonate and Calcius Calcium Carbonate for functional foods and beverages and as an active ingredient in mineral supplement tablets, respectively.
- In April 2015, Imerys Carbonates, a business segment of Imerys, launched a product line of micronized ground calcium carbonate for South America under the brand name, SUPERMICRO. This product is used for market segments such as plastics (PVC, EVA), adhesives & sealants, rubber, and thermoplastics.
Critical questions the report answers:
- What are the upcoming trends for the Calcium Carbonate market?
- Which segment provides the most opportunity for growth?
- Who are the leading vendors operating in this market?
- What are the opportunities for new market entrants?
Frequently Asked Questions (FAQ):
What are the factors driving thecalcium carbonate market?
Growing demand for cost effective product inpaper and plastic industry in APAC region.
What is the major restraint for high calcium carbonate market?
Increasing transportation cost is one of the biggest restraining factor for the calcium carbonate market.
What was the market size of calcium carbonatein 2018 and how is it estimated to grow?
The market size for calcium carbonate marketwas 20,595.5 million in 2018. It is projected to reach USD 28,301.8 million by 2024.
Which are the different type of calcium carbonate market?
The calcium carbonate market is segmented on the basis of type into ground calcium carbonate (GCC) and precipitated calcium carbonate (PCC).
To speak to our analyst for a discussion on the above findings, click Speak to Analyst
 Exclusive indicates content/data unique to MarketsandMarkets and not available with any competitors.
Table of Contents
1 Introduction (Page No. - 16)
1.1 Objectives of the Study
1.2 Market Definition
1.3 Market Scope
1.3.1 Calcium Carbonate Market Segmentation
1.3.2 Regions Covered
1.3.3 Years Considered for the Study
1.4 Currency
1.5 Unit Considered
1.6 Limitation
1.7 Stakeholders
2 Research Methodology (Page No. - 20)
2.1 Research Data
2.1.1 Secondary Data
2.1.1.1 Key Data From Secondary Sources
2.1.2 Primary Data
2.1.2.1 Key Data From Primary Sources
2.1.2.2 Key Industry Insights
2.1.2.3 Breakdown of Primary Interviews
2.2 Market Size Estimation
2.3 Data Triangulation
2.4 Assumptions
3 Executive Summary (Page No. - 28)
4 Premium Insights (Page No. - 31)
4.1 Attractive Opportunities in the Calcium Carbonate Market
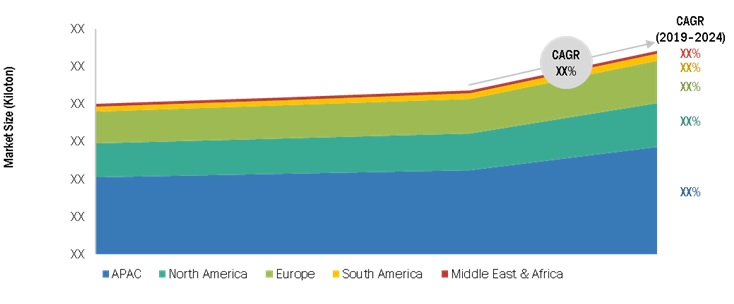
4.2 Market of Calcium Carbonate, By Region
4.3 Market of Calcium Carbonate, By End-Use Industry
4.4 Global Market of Calcium Carbonate
4.5 Market of Calcium Carbonate, By Type and Country
5 Market Overview (Page No. - 34)
5.1 Introduction
5.2 Market Dynamics
5.2.1 Drivers
5.2.1.1 Cost-Efficiency of Calcium Carbonate
5.2.1.2 Increasing Demand From Paper and Plastic Industries in APAC
5.2.2 Restraints
5.2.2.1 Increasing Cost Due to High Transportation Charges
5.2.3 Opportunities
5.2.3.1 Potential Applications
5.2.4 Challenges
5.2.4.1 Declining Paper Industry Due to Increasing Digitization
5.3 Porter’s Five Forces Analysis
5.3.1 Porter’s Five Forces Analysis
5.3.2 Bargaining Power of Suppliers
5.3.3 Threat of New Entrants
5.3.4 Threat of Substitutes
5.3.5 Bargaining Power of Buyers
5.3.6 Intensity of Competitive Rivalry
5.4 Macroeconomic Indicators
5.4.1 Trends and Forecast of GDP
6 Calcium Carbonate Market, By Type (Page No. - 42)
6.1 Introduction
6.2 Ground Calcium Carbonate (GCC)
6.2.1 From Paper and Plastic to Rubber and Paints & Coatings, GCC has A Wide Usage in Various Industries
6.3 Precipitated Calcium Carbonate (PCC)
6.3.1 PCC has A Major Use in the Paper and Plastic Industries
7 Calcium Carbonate Market, By End-Use Industry (Page No. - 46)
7.1 Introduction
7.2 Paper
7.2.1 Both GCC and PCC are Widely Used in the Paper Industry
7.3 Plastic
7.3.1 Calcium Carbonate Improves the Physical Properties of Plastic
7.4 Paints & Coatings
7.4.1 The Use of Calcium Carbonate is Crucial in the Paints & Coatings Industry
7.5 Adhesives & Sealants
7.5.1 PCC is Used in the Adhesives & Sealants Industry as Modifiers
7.6 Others
8 Calcium Carbonate Market, By Region (Page No. - 51)
8.1 Introduction
8.2 North America
8.2.1 US
8.2.1.1 The Construction Industry is A Major Driver for the Market in the Us
8.2.2 Canada
8.2.2.1 The Growing Paper Industry in Canada is Boosting the Market of Calcium Carbonate
8.2.3 Mexico
8.2.3.1 Increasing Demand for Paper in the Packaging Industry is Contributing to the Market Growth of Calcium Carbonate
8.3 APAC
8.3.1 China
8.3.1.1 Growing Exports to Europe and North America are Likely to Drive the Market
8.3.2 Japan
8.3.2.1 The Booming Industrial Sector is A Major Driver for the Market in the Country
8.3.3 South Korea
8.3.3.1 Increase Inpaper Production Capacity is Expected to Boost the Market of Calcium Carbonate
8.3.4 India
8.3.4.1 Growing Demand for Calcium Carbonate-Reinforced Polypropylene is Propelling the Market
8.3.5 Indonesia
8.3.5.1 Increase in Demand From Various End-Use Industries is Driving the Market of Calcium Carbonate
8.3.6 Rest of APAC
8.4 Europe
8.4.1 Germany
8.4.1.1 There is A High Demand for Calcium Carbonate From the Paper and Plastic Industries in Germany
8.4.2 Russia
8.4.2.1 Government Support for the Growth of the Paper and Plastic Industries is Contributing to the Market Growth
8.4.3 France
8.4.3.1 Increasing Production of Paper is Driving the Demand for Calcium Carbonate
8.4.4 Italy
8.4.4.1 The Italian Market of Calcium Carbonate is Influenced By the Paper and Plastic Industries
8.4.5 Spain
8.4.5.1 The Plastic Industry is Expected to Spur the Market in Spain
8.4.6 UK
8.4.6.1 Presence of an Established Plastic Industry is Helping the Market of Calcium Carbonate
8.4.7 Finland
8.4.7.1 Paper Industry Generates A Very High Demand for Calcium Carbonate in the Country
8.4.8 Sweden
8.4.8.1 as A Major Exporter of Pulp, Paper, and Sawn Wood Products, Sweden is A Key Calcium Carbonate Market
8.4.9 Rest of Europe
8.5 Middle East & Africa
8.5.1 Saudi Arabia
8.5.1.1 The Economic Growth of the Country is the Main Driver for the Market
8.5.2 Iran
8.5.2.1 Increasingusage of Calcium Carbonate-Reinforced Polypropylene in the Automotive Industry is Estimated to Boost the Market
8.5.3 UAE
8.5.3.1 Growing Use in Various End-Use Industries is Driving the Market for Calcium Carbonate
8.5.4 Rest of Middle East & Africa
8.6 South America
8.6.1 Brazil
8.6.1.1 The Improved Economy is Projected to Drive the Market of Calcium Carbonate in the Country
8.6.2 Argentina
8.6.2.1 The Automotive Industry is Driving the Market for Calcium Carbonate in Argentina
8.6.3 Rest of South America
9 Competitive Landscape (Page No. - 93)
9.1 Introduction
9.2 Market Ranking of Key Players
9.3 Competitive Scenario
9.3.1 New Product Development
9.3.2 Expansion
9.3.3 Merger & Acquisition
9.3.4 Collaboration
9.3.5 Agreement
10 Company Profiles (Page No. - 99)
(Business Overview, Products Offered, Recent Developments, SWOT Analysis, MnM View)*
10.1 Imerys
10.2 Omya AG
10.3 Minerals Technologies Inc.
10.4 Huber Engineered Materials
10.5 Mississippi Lime Company
10.6 Carmeuse
10.7 Sibelco
10.8 Midwest Calcium Carbonate
10.9 Calcinor SA
10.10 Excalibar Minerals LLC
10.11 Additional Companies
10.11.1 GLC Mineral
10.11.2 Maruo Calcium Co. Ltd.
10.11.3 Provencale SA
10.11.4 Columbia River Carbonates
10.11.5 Cerne Calcium Company
10.11.6 ACCM
10.11.7 Graymont Limited
10.11.8 Gulshan Polyols Ltd.
10.11.9 Kerford Limestone
10.11.10 The National Lime & Stone Company
*Details on Business Overview, Products Offered, Recent Developments, SWOT Analysis, MnM View Might Not Be Captured in Case of Unlisted Companies.
11 Appendix (Page No. - 120)
11.1 Discussion Guide
11.2 Knowledge Store: Marketsandmarkets Subscription Portal
11.3 Available Customizations
11.4 Related Reports
11.5 Author Details
List of Tables (123 Tables)
Table 1 Trends and Forecast of GDP,2017 -2024 (USD Billion)
Table 2 Market Size, By Type, 2017–2024 (USD Million)
Table 3 Market Size, By Type, 2017–2024 (Kiloton)
Table 4 Ground Calcium Carbonate Market Size, By Region, 2017–2024 (USD Million)
Table 5 Ground Market Size, By Region, 2017–2024 (Kiloton)
Table 6 Precipitated Calcium Carbonate Market Size, By Region, 2017–2024 (USD Million)
Table 7 Precipitated Market Size, By Region, 2017–2024 (Kiloton)
Table 8 Market Size, By End-Use Industry, 2017–2024 (USD Million)
Table 9 Market Size in Paper End-Use Industry, By Region, 2017–2024 (USD Million)
Table 10 Market Size in Plastic End-Use Industry, By Region, 2017–2024 (USD Million)
Table 11 Market Size in Paints & Coatings End-Use Industry, By Region, 2017–2024 (USD Million)
Table 12 Market Size in Adhesives & Sealants End-Use Industry, By Region, 2017–2024 (USD Million)
Table 13 Market Size in Other End-Use Industries, By Region, 2017–2024 (USD Million)
Table 14 Calcium Carbonatemarket Size, By Region, 2017–2024 (USD Million)
Table 15 Market Size, By Region, 2017–2024 (Kiloton)
Table 16 Market Size, By Type, 2017–2024 (USD Million)
Table 17 Market Size, By Type, 2017–2024 (Kiloton)
Table 18 Market Size, By End-Use Industry, 2017–2024 (USD Million)
Table 19 North America: Market Size, By Country, 2017–2024 (USD Million)
Table 20 North America: Market Size, By Country, 2017–2024 (Kiloton)
Table 21 North America: Market Size, By Type, 2017–2024 (USD Million)
Table 22 North America: Market Size, By Type, 2017–2024 (Kiloton)
Table 23 North America: Market Size, By End-Use Industry, 2017–2024 (USD Million)
Table 24 US: Market Size, By Type, 2017–2024 (USD Million)
Table 25 US: Market Size, By Type, 2017–2024 (Kiloton)
Table 26 US: Market Size, By End-Use Industry, 2017–2024 (USD Million)
Table 27 Canada: Market Size, By Type, 2017–2024 (USD Million)
Table 28 Canada: Market Size, By Type, 2017–2024 (Kiloton)
Table 29 Canada: Market Size, By End-Use Industry, 2017–2024 (USD Million)
Table 30 Mexico: Market Size, By Type, 2017–2024 (USD Million)
Table 31 Mexico: Market Size, By Type, 2017–2024 (Kiloton)
Table 32 Mexico: Market Size, End-Use Industry, 2017–2024 (USD Million)
Table 33 APAC: Market Size, By Country, 2017–2024 (USD Million)
Table 34 APAC: Market Size, By Country, 2017–2024 (Kiloton)
Table 35 APAC: Market Size, By Type, 2017–2024 (USD Million)
Table 36 APAC: Market Size, By Type, 2017–2024 (Kiloton)
Table 37 APAC: Market Size, By End-Use Industry, 2017–2024 (USD Million)
Table 38 China: Market Size, By Type, 2017–2024 (USD Million)
Table 39 China: Market Size, By Type, 2017–2024 (Kiloton)
Table 40 China: Market Size, By End-Use Industry, 2017–2024 (USD Million)
Table 41 Japan: Market Size, By Type, 2017–2024 (USD Million)
Table 42 Japan: Market Size, By Type, 2017–2024 (Kiloton)
Table 43 Japan: Market Size, By End-Use Industry, 2017–2024 (USD Million)
Table 44 South Korea: Market Size, By Type, 2017–2024 (USD Million)
Table 45 South Korea: Market Size, By Type, 2017–2024 (Kiloton)
Table 46 South Korea: Market Size, By End-Use Industry, 2017–2024 (USD Million)
Table 47 India: Market Size, By Type, 2017–2024 (USD Million)
Table 48 India: Market Size, By Type, 2017–2024 (Kiloton)
Table 49 India: Market Size, By End-Use Industry, 2017–2024 (USD Million)
Table 50 Indonesia: Market Size, By Type, 2017–2024 (USD Million)
Table 51 Indonesia: Market Size, By Type, 2017–2024 (Kiloton)
Table 52 Indonesia: Market Size, By End-Use Industry, 2017–2024 (USD Million)
Table 53 Rest of APAC: Market Size, By Type, 2017–2024 (USD Million)
Table 54 Rest of APAC: Market Size, By Type, 2017–2024 (Kiloton)
Table 55 Rest of APAC: Market Size, By End-Use Industry, 2017–2024 (USD Million)
Table 56 Europe: Market Size, By Country, 2017–2024 (USD Million)
Table 57 Europe: Market Size, By Country, 2017–2024 (Kiloton)
Table 58 Europe: Market Size, By Type, 2017–2024 (USD Million)
Table 59 Europe: Market Size, By Type, 2017–2024 (Kiloton)
Table 60 Europe: Market Size, By End-Use Industry, 2017–2024 (USD Million)
Table 61 Germany: Market Size, By Type, 2017–2024 (USD Million)
Table 62 Germany: Market Size, By Type, 2017–2024 (Kiloton)
Table 63 Germany: Market Size, By End-Use Industry, 2017–2024 (USD Million)
Table 64 Russia: Market Size, By Type, 2017–2024 (USD Million)
Table 65 Russia: Market Size, By Type, 2017–2024 (Kiloton)
Table 66 Russia: Market Size, By End-Use Industry, 2017–2024 (USD Million)
Table 67 France: Market Size, By Type, 2017–2024 (USD Million)
Table 68 France: Market Size, By Type, 2017–2024 (Kiloton)
Table 69 France: Market Size, By End-Use Industry, 2017–2024 (USD Million)
Table 70 Italy: Market Size, By Type, 2017–2024 (USD Million)
Table 71 Italy: Market Size, By Type, 2017–2024 (Kiloton)
Table 72 Italy: Market Size, By End-Use Industry, 2017–2024 (USD Million)
Table 73 Spain: Market Size, By Type, 2017–2024 (USD Million)
Table 74 Spain: Market Size, By Type, 2017–2024 (Kiloton)
Table 75 Spain: Market Size, By End-Use Industry, 2017–2024 (USD Million)
Table 76 UK: Market Size, By Type, 2017–2024 (USD Million)
Table 77 UK: Market Size, By Type, 2017–2024 (Kiloton)
Table 78 UK: Market Size, By End-Use Industry, 2017–2024 (USD Million)
Table 79 Finland: Market Size, By Type, 2017–2024 (USD Million)
Table 80 Finland: Market Size, By Type, 2017–2024 (Kiloton)
Table 81 Finland: Market Size, By End-Use Industry, 2017–2024 (USD Million)
Table 82 Sweden: Market Size, By Type, 2017–2024 (USD Million)
Table 83 Sweden: Market Size, By Type, 2017–2024 (Kiloton)
Table 84 Sweden: Market Size, By End-Use Industry, 2017–2024 (USD Million)
Table 85 Rest of Europe: Market Size, By Type, 2017–2024 (USD Million)
Table 86 Rest of Europe: Market Size, By Type, 2017–2024 (Kiloton)
Table 87 Rest of Europe: Market Size, By End-Use Industry, 2017–2024 (USD Million)
Table 88 Middle East & Africa: Market Size, By Country, 2017–2024 (USD Million)
Table 89 Middle East & Africa: Market Size, By Country, 2017–2024 (Kiloton)
Table 90 Middle East & Africa: Market Size, By Type, 2017–2024 (USD Million)
Table 91 Middle East & Africa: Market Size, By Type, 2017–2024 (Kiloton)
Table 92 Middle East and Africa: Market Size, By End-Use Industry, 2017–2024 (USD Million)
Table 93 Saudi Arabia: Market Size, By Type, 2017–2024 (USD Million)
Table 94 Saudi Arabia: Market Size, By Type, 2017–2024 (Kiloton)
Table 95 Saudi Arabia: Market Size, By End-Use Industry, 2017–2024 (USD Million)
Table 96 Iran: Market Size, By Type, 2017–2024 (USD Million)
Table 97 Iran: Market Size, By Type, 2017–2024 (Kiloton)
Table 98 Iran: Market Size, By End-Use Industry, 2017–2024 (USD Million)
Table 99 UAE: Market Size, By Type, 2017–2024 (USD Million)
Table 100 UAE: Market Size, By Type, 2017–2024 (Kiloton)
Table 101 UAE: Market Size, By End-Use Industry, 2017–2024 (USD Million)
Table 102 Rest of Middle East & Africa: Market Size, By Type, 2017–2024 (USD Million)
Table 103 Rest of Middle East & Africa: Market Size, By Type, 2017–2024 (Kiloton)
Table 104 Rest of Middle East & Africa: Market Size, By End-Use Industry, 2017–2024(USD Million)
Table 105 South America: Market Size, By Country, 2017–2024 (USD Million)
Table 106 South America: Market Size, By Country, 2017–2024 (Kiloton)
Table 107 South America: Market Size, By Type, 2017–2024 (USD Million)
Table 108 South America: Market Size, By Type, 2017–2024 (Kiloton)
Table 109 South America: Market Size, By End-Use Industry, 2017–2024 (USD Million)
Table 110 Brazil: Market Size, By Type, 2017–2024 (USD Million)
Table 111 Brazil: Market Size, By Type, 2017–2024 (Kiloton)
Table 112 Brazil: Market Size, By End-Use Industry, 2017–2024 (USD Million)
Table 113 Argentina: Market Size, By Type, 2017–2024 (USD Million)
Table 114 Argentina: Market Size, By Type, 2017–2024 (Kiloton)
Table 115 Argentina: Market Size, By End-Use Industry, 2017–2024 (USD Million)
Table 116 Rest of South America: Market Size, By Type, 2017–2024 (USD Million)
Table 117 Rest of South America: Market Size, By Type, 2017–2024 (Kiloton)
Table 118 Rest of South America: Market Size, By End-Use Industry, 2017–2024(USD Million)
Table 119 New Product Development, 2015–2018
Table 120 Expansion, 2015–2018
Table 121 Merger & Acquisition, 2015–2018
Table 122 Collaboration, 2015–2018
Table 123 Agreement, 2015–2018
List of Figures (30 Figures)
Figure 1 Calcium Carbonate: Market Research Design
Figure 2 Bottom-Up Approach
Figure 3 Top-Down Approach
Figure 4 Calcium Carbonate: Market Data Triangulation
Figure 5 Ground Calcium Carbonate Segment Accounted for the Larger Market Share
Figure 6 Plastic to Be the Fastest-Growing End-Use Industry of Calcium Carbonate
Figure 7 APAC Was the Largest Market of Calcium Carbonate in 2018
Figure 8 Growing Demand From Paper Industry to Drive the Market of Calcium Carbonate
Figure 9 APAC to Be the Fastest-Growing Market of Calcium Carbonate
Figure 10 Paper to Be the Largest End-Use Industry of Calcium Carbonate
Figure 11 China to Register the Highest CAGR
Figure 12 China and Ground Calcium Carbonate Segment Led the Market of Calcium Carbonate
Figure 13 Drivers, Restraints, Opportunities, and Challenges in the Market of Calcium Carbonate
Figure 14 Market: Porter’s Five Forces Analysis
Figure 15 Trends of GDP, 2017
Figure 16 Ground Calcium Carbonate to Be the Larger Segment of the Market
Figure 17 Paper to Be the Largest End-Use Industry for Market of Calcium Carbonate
Figure 18 China to Register the Highest Growth Rate
Figure 19 North America: Market Snapshot
Figure 20 APAC: Market Snapshot
Figure 21 Europe: Market Snapshot
Figure 22 Key Developments in the Market of Calcium Carbonate (2015–2018)
Figure 23 Imerys: Company Snapshot
Figure 24 Imerys: SWOT Analysis
Figure 25 Omya AG: SWOT Analysis
Figure 26 Minerals Technologies: Company Snapshot
Figure 27 Minerals Technologies: SWOT Analysis
Figure 28 Huber Engineered Materials: SWOT Analysis
Figure 29 Mississippi Lime Company: SWOT Analysis
Figure 30 Sibelco: Company Snapshot
The study involved four major activities to estimate the current market size for calcium carbonate. Exhaustive secondary research was done to collect information on the market, peer market, and parent market. The next step was to validate these findings, assumptions, and sizing with industry experts across the value chain through primary research. Both top-down and bottom-up approaches were employed to estimate the complete market size. Thereafter, market breakdown and data triangulation were used to estimate the market size of the segments and the sub-segments.
Secondary Research
In the secondary research process, various secondary sources such as Hoovers, Bloomberg BusinessWeek, and Dun & Bradstreet were referred to identify and collect information for this study. These secondary sources included annual reports, press releases & investor presentations of companies; white papers; certified publications; articles by recognized authors; gold standard & silver standard websites; food safety organizations; regulatory bodies; trade directories; and databases.
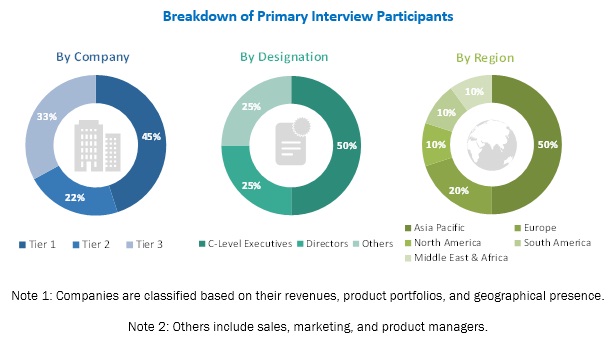
Primary Research
The primary sources considered in the study mainly included several industry experts from core and related industries and preferred suppliers, manufacturers, distributors, service providers, and organizations related to all segments of the calcium carbonate industry’s supply chain. After arriving at the overall market size, the total market was split into several segments and sub-segments. The figure below illustrates the breakdown of the primary interviews based on company type, designation, and region conducted during this research study on the calcium carbonate market:
To know about the assumptions considered for the study, download the pdf brochure
Market Size Estimation
Both the top-down and bottom-up approaches were used to estimate and validate the total size of the calcium carbonate market. These methods were also used extensively to estimate the size of various sub-segments of the market. The research methodology used to estimate the market size included the following:
- The key players in the industry and markets were identified through extensive secondary research.
- The industry’s supply chain and market size, in terms of value, were determined through primary and secondary research processes.
- All percentage shares, splits, and breakdowns were determined using secondary sources and verified through primary sources.
Data Triangulation
After arriving at the overall market size-using the market size estimation processes as explained above, the market was split into several segments and sub-segments. In order to complete the overall market engineering process and arrive at the exact statistics of each market segment and sub-segments, the data triangulation and market breakdown procedures were employed, wherever applicable. The data was triangulated by studying various factors and trends from both the demand and supply sides in the calcium carbonate market.
Research Objectives
- To define, describe, and forecast the calcium carbonate market based on type, end-use industry, and region
- To forecast and analyze the size of the calcium carbonate market (in terms of value and volume) in 5 key regions, namely, Asia Pacific (APAC), Europe, North America, the Middle East & Africa, and South America
- To forecast and analyze the calcium carbonate market at the country level in each region
- To strategically analyze each submarket with respect to the individual growth trends and its contribution to the overall calcium carbonate market
- To analyze opportunities in the calcium carbonate market for the stakeholders by identifying high-growth segments of the market
- To identify significant market trends and factors driving or inhibiting the growth of the calcium carbonate market and its submarkets
- To strategically profile the key players in the calcium carbonate market and comprehensively analyze their growth strategies
Available Customizations
With the given market data, MarketsandMarkets offers customizations according to the specific needs of companies. The following customization options are available for the report:
Regional Analysis
- A further breakdown of the regional calcium carbonate market to the country level with additional end-use industries and/or types
Country Information
- Additional country information (up to three)
Company Information
- Detailed analysis and profiles of additional market players (up to five)


Growth opportunities and latent adjacency in Calcium Carbonate Market
What is the total volume of the calcium carbonate market?