Car Safety Market by System Type (Active Safety & Passive Safety), Safety Regulations by Region (APAC, Europe, North America & Rest of the World), Impact Analysis (Overall Market OEM, Tier I & Consumer) - Trends & Forecast to 2020


[130 Pages Report] The car safety systems market is estimated to be USD 93.73 Billion in 2015, and is projected to reach 152.59 Billion by 2020, growing at a CAGR of 10.24%. Car safety regulations are a set of guidelines/protocols for automotive component/vehicle design, manufacturing equipment, and safety systems. The primary objective of these regulations is to minimize the occurrence and consequences of automobile accidents. The car safety systems market, by value, is projected to grow at a CAGR of 10.24% from 2015 to 2020. This growth can be attributed to the impact of current and future safety regulations and growing awareness regarding safety systems among consumers.
This report covers existing and future car safety regulations in various countries and regions, segmented by occupant type and application. The report also outlines planned car safety regulations to be imposed in various countries and their potential impact on stakeholders.
Active safety systems play a key role in preventing incidents and accidents, whereas passive safety systems help to mitigate negative consequences in the event of a crash. Active safety systems consist of various subsystems, such as anti-lock braking, electronic stability control, and tire pressure-monitoring systems. Passive safety systems, such as airbags and seat belts, have proven to be very effective in minimizing the risk of injury in an accident.
The research methodology used in the report involves various secondary sources, including paid databases and directories. Experts from related industries and suppliers have been interviewed to understand the future trends of the automotive passenger safety systems market.
The research design comprises current car passenger safety regulations enforced in different regions and countries, along with planned car safety regulations and their potential impact on the overall automotive industry and its stakeholders.
Regions covered include Asia-Pacific, Europe, North America, and the Rest of the World. Information regarding current and planned regulations has been gathered from various secondary and primary sources, and their impact on the automotive value chain has been identified through extensive primary and secondary research. Primary research interviews have been conducted with key opinion leaders in the automotive industry, regulatory bodies, agencies, and other executives such as CEOs, directors, and industry experts to validate findings in the study.
Increasing safety regulation pertaining to road safety would drive the global car safety market demand to USD 152.59 billion by 2020
The major objectives of the study are as follows:
- To define and describe the existing passenger safety regulations by region and occupant type
- To define and describe the existing and future passenger safety systems, by application.
- To define and describe the future passenger safety regulations
- To describe the automotive passenger safety regulatory bodies
- To analyze the impact of future regulations on the stakeholders
Research Methodology
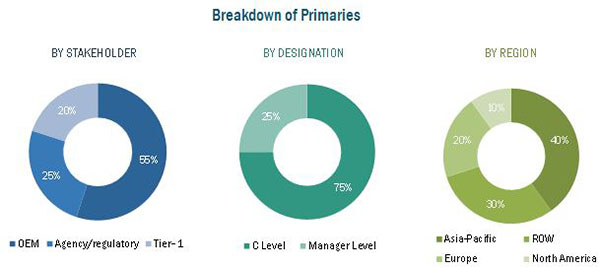
This research study involves the use of secondary sources such as company annual reports/presentations, industry association publications, automotive magazine articles, directories, technical handbooks, World Economic Outlook, trade websites, technical articles, and databases such as Hoover’s, Bloomberg Businessweek, and Factiva to identify and collect information for an extensive commercial study of the automotive battery sensor market. The primary sources comprise industry experts, engineers, product managers, R&D managers, automobile OEMs, safety systems manufacturers, software providers and sales managers. In-depth interviews have been conducted with various primary respondents, including key industry participants, subject-matter experts, technical experts, car safety experts of major market players, and industry consultants to obtain and verify critical qualitative and quantitative information as well as to assess prospects.
The figure provided below illustrates the break-up of the profile of industry experts who participated in primary discussions.
To know about the assumptions considered for the study, download the pdf brochure
Critical Questions which the report answers:
- Which type of safety system will lead the car safety market in future?
- What are the future plans of key regulatory bodies pertaining to road safety?
- Which are the key players in car safety market?
The car safety system ecosystems consists of manufacturers such as Continental AG (Germany), Denso Corporation (Japan), Delphi Automotive PLC (U.K.), Robert Bosch GmbH (Germany), and Toyoda Gosei Co. Ltd. (Japan), research institutes such as The Automotive Research Association of India (ARAI), European Automotive Research Partners Association (EARPA), and The United States Council for Automotive Research (USCAR), and regional automobile associations such as China Association of Automobile Manufacturers (CAAM), Japan Automobile Manufacturers Association (JAMA), and the European Automobile Manufacturers Association (ACEA).
Target Audience
- Manufacturers of car safety systems
- Dealers and distributors of car safety systems
- Industry associations
- Investment firms
- Equity research firms
- Private equity firms
- Governments and regulatory authorities
Scope of the Report
- By Occupant Type (Driver, Passenger, Child, and Pedestrian),
- By System Type (Active Systems and Passive Systems)
- Impact Analysis
- By Region (North America, Asia-Pacific, Europe, and RoW).
Available Customizations
With the given market data, MarketsandMarkets can provide market data for the below categories:
- Further analysis of countries from the Rest of Europe and Rest of Asia-Pacific
- Market analysis for LCV and HCV
- Profiling of additional market players (up to 3)
The car safety systems market is estimated to be USD 93.73 Billion in 2015, and is projected to reach 152.59 Billion by 2020, growing at a CAGR of 10.24%. The car safety systems market has witnessed considerable growth in countries such as the U.S., China, India, and Mexico, owing to the increasing vehicle electrification, rising vehicle production, and increasingly stringent safety norms.
Active safety systems play a key role in preventing incidents and accidents, whereas passive safety systems help to mitigate negative consequences in the event of a crash. Active safety systems consist of various subsystems, such as anti-lock braking, electronic stability control, and tire pressure-monitoring systems. All these systems are triggered at different times based on various circumstances, to prevent accidents. The systems are mandatory in most developed countries, and legislations in developing countries are rapidly catching up. However, other active safety systems, such as lane departure warning, adaptive cruise control, driver monitoring, blind spot detection, and night vision systems are primarily implemented in the premium car segment.
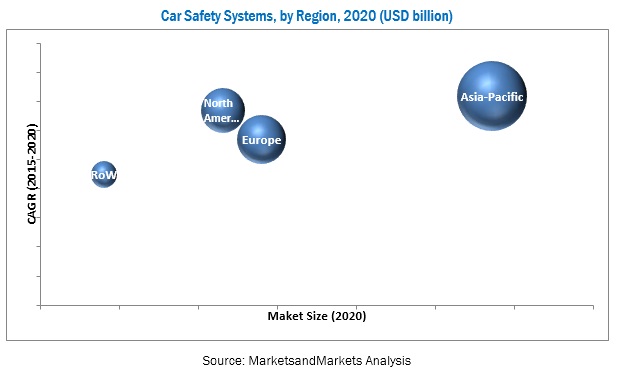
Asia-Pacific is projected to grow at the highest CAGR during the forecast period, as a result of the high demand for vehicles, especially from countries such as China and India. Several OEMs are investing in the region, prompted by factors such as the expanding middle class and the young demographic. Passenger car production is expected to grow in countries such as China and India, owing to availability of cost-effective labor and favorable government policies. For instance, the Government of India has allowed 100% foreign direct investment (FDI) with no minimum investment criteria for the automotive sector. The region houses OEMs such as Toyota (Japan), Hyundai Motor Company (South Korea), and Honda Motor Company (Japan). Additionally, certain countries in Asia-Pacific, such as South Korea and Japan, have strong technological capabilities.
The market for car safety systems is mainly driven by legislation mandating safety technology installation in vehicles. The New Car Assessment Program (NCAP) is a government car safety evaluation program that provides ratings based on the safety performance of cars. The program has become a catalyst in encouraging significant safety improvement initiatives from OEMs, which drives consumer confidence and consequently, demand. The growing focus of consumers and OEMs on occupant safety increases the number of technology installations per vehicle.
Car Safety applications in safety assistance system, V2V, and V2I drive the growth of car safety application
Electronic Stability Control (ESC)
Electronic Stability Control (ESC) is a system that detects if the vehicle is about to lose traction during turning and braking, and electronically adjusts the braking of individual wheels to maintain vehicle traction and stability. ESC is very effective in case of accidents, skidding, and so on, as it helps the driver maintain control of the car, thereby preventing or reducing the severity of crashes. ESC was made mandatory by the European New Car Assessment program in the year 2009.
Autonomous Emergency Braking (AEB)
AEB helps the driver to avoid a crash by providing a warning, and either helps with adequate braking or ultimately stops the vehicle. The AEB system uses ESC and sensor technology to analyze the speed and distance of objects in the vehicle’s path. The system then automatically applies the brakes if the driver does not respond to avoid or minimize the severity of an accident. AEB is currently implemented in around 7% of new cars manufactured, which indicates that the market for AEB has substantial growth potential.
Adaptive Cruise Control (ACC)
Active or Adaptive Cruise Control (ACC) is an intelligent system that automatically slows down and speeds up the vehicle to keep up with the car in front. The system uses a radar or similar technology to analyze the vehicles travelling in the same lane ahead, and either reduces or increases the vehicle speed to maintain a safe and suitable distance between the two vehicles. ACC is now paired with a pre-crash system that alerts the driver in case of a probable crash.
The radar commonly used for ACC is automotive long-range radar (LRR). This kind of radar occupies a bandwidth of around 77 GHz. In the remodeled 1999 model S-class luxury cars introduced by Mercedes-Benz, the ACC system uses a 77-GHz Doppler radar linked to the electronic control and braking systems.
Vehicle to Vehicle (V2V) and Vehicle to Infrastructure (V2I) Communications
Vehicle to Vehicle (V2V) and Vehicle to Infrastructure (V2I) are advanced communication systems, which enable vehicles to communicate with other vehicles and infrastructures nearby. The systems provide drivers with information regarding upcoming hazards, emergency vehicles, and traffic light changes. The primary goal of V2V communication is preventing accidents. This goal is achieved by allowing moving vehicles to share position and speed data with one another over an ad hoc mesh network.
A short-range radar (SRR) is commonly used to establish communication between the vehicles. The radar works at a bandwidth of 24 GHz and 79 GHz. The 79 GHz bandwidth is a long-term operating frequency for SRR. Security is therefore a key challenge with V2V technology design.
Blind Spot Detection System
Blind spot detection is a technology that provides 360 degrees of coverage around the car. The blind spot detection (BSD) system was initially developed by Volvo. The system tracks traffic just behind the vehicle, as well as the traffic alongside it. The alert stays active until the vehicle in the adjacent lane is in front, or at least directly alongside the car. BSD uses ultrasonic or radar sensors, which are located at the side and rear of the car.
A blind spot monitoring system uses an electronic detection device mounted on the sides of the car, which sends electronic electromagnetic waves or computer-processed images. When detectors notice another vehicle closing in on the car, the system alerts the driver. In the new, advanced systems, the car will steer itself back into the safety zone of its previous lane.
Lane Departure Warning System
The lane departure warning system tracks whether the vehicle is appropriately within a lane. It uses a forward-facing camera in the rearview mirror mount, and is hence an optical system. If the vehicle enters another lane, the system gives a visual alert on the dashboard and an audible alert or a steering wheel or seat bottom vibration. If the turn signal of the vehicle is on, the system does not give any alert. The latest technologies use a set of laser or infrared sensors to track the lane of the vehicle. These technologies are expensive, but are more effective with regard to tracking.
Parking Assistance system
The parking assistance system is one of the most intelligent systems currently available in the market. These systems enable the vehicle to steer itself into a parking lot without any action by the driver. The system uses cameras and sensors to analyze the parking space available and automatically steers the vehicle into the space with precision. The parking assistance system judges the size of a parking space and informs the driver if the space is suitable or not. The system can park the car in different locations, such as parking lots, roadside parking slots, and others.
The latest automatic parking system by Bosch can steer the vehicle with the driver standing outside the vehicle. The driver just has to hold a button on his mobile application and the car parks itself. The system uses ultrasound sensors located at the side of the vehicle. These sensors scan the surroundings and calculate the perfect parking manoeuvres.
Heads-up display (HUD)
A Heads-Up Display (HUD) is a digital transparent image, which is projected onto the windshield of a car. The information displayed is the same information the driver would get from the dashboard. This can include everything from the current speed to various temperature gauges. The motive behind the heads-up display is to prevent any kind of distraction caused to the driver in case of a dashboard display.
To speak to our analyst for a discussion on the above findings, click Speak to Analyst
 Exclusive indicates content/data unique to MarketsandMarkets and not available with any competitors.
Table of Contents
1 Introduction (Page No. - 12)
1.1 Objectives of the Study
1.2 Market Definition
1.3 Markets Scope
1.4 Limitations
1.5 Stakeholders
2 Research Methodology (Page No. - 15)
2.1 Research Data
2.2 Secondary Data
2.3 Key Data From Secondary Sources
2.4 Primary Data
2.4.1 Research Techniques & Data Collection Methods
2.4.2 Primary Participants
2.5 Factor Analysis
2.5.1 Introduction
2.5.2 Vehicle Production Increasing in Developing Countries
2.5.3 Infrastructure: Roadways
2.5.4 Increasing Urbanization vs Passenger Car Per Thousand People
2.5.5 Motor Vehicle Crash Deaths Among Children Younger Than 13 Years
2.5.6 Influence of Other Factors
2.6 Assumptions
3 Stakeholders (Page No. - 25)
3.1 Original Equipment Manufacturers (OEM)
3.2 Component Manufacturers
3.3 Consumers
3.4 Government Regulatory Authorities
4 Passenger Safety Regulations, By Region (Page No. - 32)
4.1 Introduction
4.2 North America
4.2.1 U.S. (Till 2015)
4.2.2 Canada (Till 2015)
4.2.3 Mexico (Till 2013)
4.3 Europe (Till 2015)
4.4 Asia-Pacific
4.4.1 India (Till 2017)
4.4.2 Japan (Till 2015)
4.4.3 China (Till 2015)
4.5 Rest of the World (RoW)
4.5.1 Brazil (Till 2014)
4.5.2 South Africa
5 Passenger Safety Systems, By Occupant Type (Page No. - 50)
5.1 Adult Occupant
5.1.1 Driver Safety
5.1.1.1 Seat Belt
5.1.1.2 Airbag
5.1.1.3 Anti-Whiplash
5.1.2 Passenger Safety
5.1.2.1 Seat Belt
5.1.2.2 Airbag
5.2 Pedestrian Safety
5.2.1 Active Hood and Bumper
5.2.2 Pedestrian Protection Airbags
5.3 Child Safety
5.3.1 Seats
5.3.2 Isofix
5.4 Safety Assistance Systems
5.4.1 Electronic Stability Control (ESC)
5.4.2 Autonomous Emergency Braking (AEB)
5.4.3 Adaptive Cruise Control (ACC)
5.4.4 Vehicle to Vehicle (V2V) and Vehicle to Infrastructure (V2I) Communications
5.4.5 Blind Spot Detection System
5.4.6 Lane Departure Warning System
5.4.7 Parking Assistance System
5.4.8 Heads-Up Display (HUD)
6 Passenger Safety Systems, By Application (Page No. - 56)
6.1 Introduction
6.2 Market Outlook
6.2.1 Market Drivers
6.2.2 Market Restraints
6.2.3 Market Challenges
6.3 Active Safety Market (2011–2014)
6.4 Passive Safety Market (2011–2014)
7 Impact Analysis of Safety Regulations for Passenger Cars (Page No. - 69)
7.1 Introduction
7.2 Impact on Market
7.2.1 Active Safety Market (2015–2020)
7.2.2 Passive Safety Market (2015–2020)
7.3 Impact on Stakeholders
7.3.1 Impact on OEM & Tier – I
7.3.2 Impact on Consumers
7.3.3 Impact on Relative Markets
7.4 Materials
8 Passenger Safety Regulatory Bodies, By Region (Page No. - 82)
8.1 North America
8.1.1 Nhtsa
8.1.2 Transport Canada
8.2 South America
8.2.1 Latin NCAP
8.3 Europe
8.3.1 Euro NCAP
8.4 Asia-Pacific
8.4.1 Arai (India)
8.4.2 China Association of Automobile Manufacturers (CAAM)
8.4.3 C-NCAP
8.4.4 J–NCAP
9 Competitive Landscape (Page No. - 87)
9.1 Market Rankings, Passenger Safety Systems Market
9.2 Competitive Situation & Trends
9.3 New Product Launches
9.4 Expansions
9.5 Mergers & Acquisitions
9.6 Agreements/Joint Ventures/Partnerships
9.7 Product Mapping
9.8 Customer Mapping
9.9 Buying Criteria
9.9.1 Product Related Criteria:
9.9.2 Other Buying Criteria:
10 Company Profiles (Page No. - 96)
(Company at A Glance, Recent Financials, Products & Services, Strategies & Insights, & Recent Developments)*
10.1 Introduction
10.2 Continental AG
10.3 Toyoda Gosei Co., Ltd.
10.4 Denso Corporation
10.5 Robert Bosch GmbH
10.6 Delphi Automotive PLC
10.7 Autoliv Inc
10.8 Johnson Electric Holdings Limited
10.9 Takata
10.10 Valeo
10.11 ZF TRW Automotive Holdings Corporation
*Details on Company at A Glance, Recent Financials, Products & Services, Strategies & Insights, & Recent Developments Might Not Be Captured in Case of Unlisted Companies.
11 Appendix (Page No. - 126)
11.1 Insights From Industry Experts
11.2 Discussion Guide
11.3 Introducing RT: Real Time Market Intelligence
11.4 Available Customizations
11.4.1 Regional Analysis
11.4.2 Company Information
11.5 Related Reports
List of Tables (39 Tables)
Table 1 OEM Safety Features Mapping
Table 2 Automotive Safety Regulatory Authority/Automotive Associations
Table 3 U.S. Passenger Safety Regulations
Table 4 Canadian Passenger Safety Regulations
Table 5 Mexican Passenger Safety Regulations
Table 6 European Union Regulations
Table 7 Terminologies for the Regulations
Table 8 Indian Passenger Safety Regulations
Table 9 Japanese Passenger Safety Regulations
Table 10 Chinese Passenger Safety Regulations
Table 11 Brazilian Passenger Safety Regulations
Table 12 South African Passenger Safety Regulations
Table 13 Automotive Safety Systems Technology & Description
Table 14 Active Safety Systems Market, By System Type, 2011–2014 (USD Million)
Table 15 Asia-Pacific: Active Safety Systems Market, By System Type, 2011–2014 (USD Million)
Table 16 Europe: Active Safety Systems Market, By System Type, 2011–2014 (USD Million)
Table 17 North America: Active Safety Systems Market, By System Type, 2011–2014 (USD Million)
Table 18 RoW: Active Safety Systems Market, By System Type, 2011–2014 (USD Million)
Table 19 Passive Safety Systems Market, By System Type, 2011–2014 (USD Million)
Table 20 Asia-Pacific: Passive Safety Systems Market, By System Type, 2011–2014 (USD Million)
Table 21 Europe: Passive Safety Systems Market, By System Type, 2011–2014 (USD Million)
Table 22 North America: Passive Safety Systems Market, By System Type, 2011–2014 (USD Million)
Table 23 RoW: Passive Safety Systems Market, By System Type, 2011–2014 (USD Million)
Table 24 Major Upcoming Legislation for Safety Systems
Table 25 Active Safety Systems Market, By System Type, 2015–2020 (USD Billion)
Table 26 Asia-Pacific: Active Safety Systems Market, By System Type, 2015–2020 (USD Million)
Table 27 Europe: Active Safety Systems Market, By System Type, 2015–2020 (USD Million)
Table 28 North America: Active Safety Systems Market, By System Type, 2015–2020 (USD Million)
Table 29 RoW: Active Safety Systems Market, By System Type, 2015–2020 (USD Million)
Table 30 Passive Safety Systems Market, By System Type, 2015–2020 (USD Billion)
Table 31 Asia-Pacific: Passive Safety Systems Market, By System Type, 2015–2020 (USD Million)
Table 32 Europe: Passive Safety Systems Market, By System Type, 2015–2020 (USD Million)
Table 33 North America: Passive Safety Systems Market, By System Type, 2015–2020 (USD Million)
Table 34 RoW: Passive Safety Systems Market, By System Type, 2015–2020 (USD Million)
Table 35 New Product Launches, 2010–2015
Table 36 Expansions, 2010–2015
Table 37 Mergers & Acquisitions, 2010–2015
Table 38 Agreements/Joint Ventures /Partnerships , 2010–2015
Table 39 Customer Mapping
List of Figures (46 Figures)
Figure 1 Passenger Death Rate in Road ACCidents Per 1,00,000 People, By Country
Figure 2 Passenger Safety Regulations & Systems: Markets Covered
Figure 3 Research Design
Figure 4 Research Methodology Model
Figure 5 Breakdown of Primary Interviews: By Stakeholder Type, Designation, & Region ( in Progress)
Figure 6 Vehicle Production, 2010–2014
Figure 7 Road Network vs Total Vehicle Sales 2012 & 2013
Figure 8 Passenger Cars Per Capita vs Urban Population (%), By Country, 2010–2011
Figure 9 Declining Child Mortality in Motor Vehicle Crashes in the U.S. (2005–2013)
Figure 10 Industry-Specific Micro & Macro Factor Analysis
Figure 11 Stakeholders in the Automotive Passenger Safety Market
Figure 12 Submarkets for Safety Systems
Figure 13 Reasons for Vehicle ACCidents
Figure 14 Evolution of Nhtsa Regulations
Figure 15 European Regulation Timeline
Figure 16 Overview of Safety Regulations, By Country 2013
Figure 17 Major Drivers for Passenger Safety Regulations
Figure 18 ESC Systems to ACCount for the Largest Share, By Value, 2011 & 2014
Figure 19 Airbag Systems to ACCount for the Largest Share, By Value, 2011 & 2014
Figure 20 Europe: Airbag Systems Occupied the Largest Share, By Value, 2014
Figure 21 Effect of Regulations on Safety System Installation Rate in Europe, Russia, Brazil, & India, 2013–2020
Figure 22 ESC System Projected to Have High Demand, By 2020
Figure 23 Airbag System Projected to Have the Largest Share, By Value, 2015–2020
Figure 24 Impact of Regulations on OEM & Tier-1 Manufacturer
Figure 25 Impact of Regulations on Consumers
Figure 26 Fatal Crashes in the U.S.
Figure 27 Expansion Was the Key Growth Strategy During the Past Three Years.
Figure 28 Passenger Safety System Competitors Ranking, 2015
Figure 29 Market Evaluation Framework: Expansions Was the Key Growth Strategy in the Passenger Safety Systems Market 2012–2015
Figure 30 Battle for Market Share: New Product Launches & Expansions Were Key Strategies
Figure 31 Region-Wise Revenue Mix of Five Market Players
Figure 32 Continental AG: Business Overview
Figure 33 SWOT Analysis: Continental AG
Figure 34 Toyoda Gosei Co., Ltd.: Company Snapshot
Figure 35 SWOT Analysis: Toyoda Gosei Co., Ltd.
Figure 36 Denso Corporation: Company Snapshot
Figure 37 Denso Corporation: SWOT Analysis
Figure 38 Robert Bosch GmbH: Company Snapshot
Figure 39 Robert Bosch GmbH: SWOT Analysis
Figure 40 Delphi Automotive PLC : Company Snapshot
Figure 41 Delphi Automotive PLC: SWOT Analysis
Figure 42 Autoliv Inc.: Company Snapshot
Figure 43 Johnson Electric Holdings Limited. : Company Snapshot
Figure 44 Takata : Company Snapshot
Figure 45 Valeo: Company Snapshot
Figure 46 ZF TRW Automotive Holdings Corp.: Business Overview


Growth opportunities and latent adjacency in Car Safety Market