Carbon Black Market by Type (Furnace Black, Channel Black, Thermal Black, Acetylene Black), Application (Tire, Non-Tire Rubber, Inks & Coating, Plastic), Grade (Standard Grade, Specialty Grade), and Region - Global Forecast to 2021


To get the latest information, inquire now!
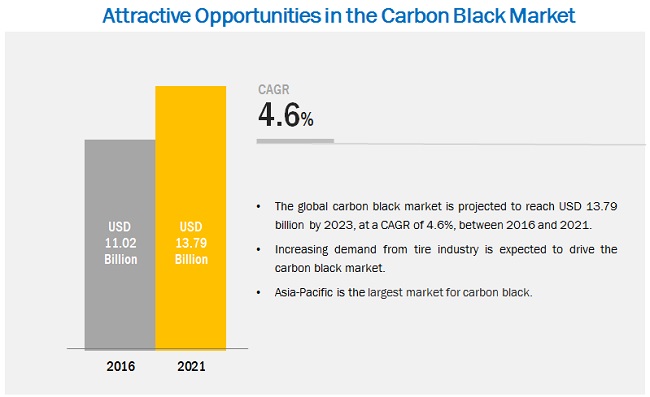
[226 Pages Report] The overall carbon black market is expected to grow from USD 11.02 billion in 2016 to USD 2.30 billion by 2021, at a CAGR of 4.6% from 2016 to 2021. Carbon black offer several advantages, such as increasing tires tread wear and rolling resistance; absorb UV light and convert it to heat, thereby, making plastics more resistant to UV radiation; and impart pigmentation, UV protection, and thermal conductivity to coatings, which, in turn, help in the growth of the market. The carbon black market is expanding with the emergence of new applications and technologies. Carbon black is being used in many applications such as tires, non-tire rubbers, plastics, inks & coatings, lithium-ion batteries, graphite manufacturing, construction, and metallurgy. The base year considered for the study is 2015, and the forecast has been provided for the period between 2016 and 2021.
Market Dynamics
Drivers
- Increasing application in plastics and coating industries
- Growth in the global rubber industry likely to drive carbon black demand
Restraints
- Emission of CO2 in carbon black production
Opportunities
- High demand in the Asia-Pacific
- Increasing requirement for UV protection and conductive properties in plastics
Challenges
- Volatility in raw material prices
- Substitution with silica in tires
- Availability of acceptable quality of feedstock
Use of carbon black in tire and rubber industries drives the global carbon black market
Carbon black is used in tire and non-tire rubber products as a reinforcing agent and shock absorbent. It is added in different parts of tires such as inner-liners, carcasses, sidewalls, and treads and rubber products such as air springs, belts, hoses, gaskets, bushings, wiper blades, and diaphragm. Carbon black improves lifespan of tires as it conducts heat away from the tread and belt area of tires. In addition, it also imparts color to tire and rubber products. Therefore, the growing tire and rubber industries drive the growth of the carbon black market.
The following are the major objectives of the study.
- To define, describe, and forecast the global carbon black market size on the basis of grade, application, type, and region
- To provide detailed information regarding the significant factors influencing the growth of the market (drivers, restraints, opportunities, and industry-specific challenges)
- To analyze the opportunities in the market for stakeholders and details of a competitive landscape for market leaders
- To forecast the market size, in terms of value and volume, with respect to five main regions, namely, North America, Europe, Asia-Pacific, Latin America, and the Middle East & Africa
- To strategically profile key players and comprehensively analyze their market shares and core competencies
- To track and analyze competitive developments such as joint ventures, mergers & acquisitions, new product developments, and research & developments (R&D) in the carbon black market
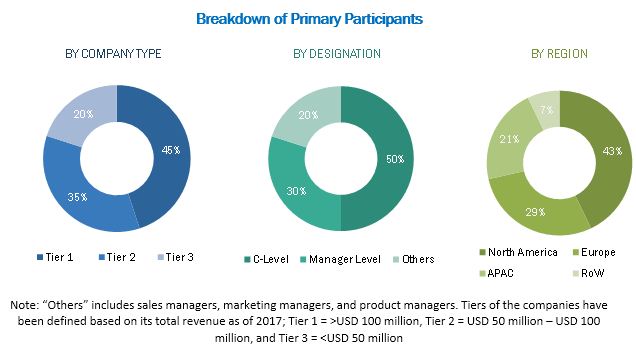
During this research study, major players operating in the carbon black market in various regions have been identified, and their offerings, regional presence, and distribution channels have been analyzed through in-depth discussions. Top-down and bottom-up approaches have been used to determine the overall market size. Sizes of the other individual markets have been estimated using the percentage splits obtained through secondary sources such as Hoovers, Bloomberg BusinessWeek, and Factiva, along with primary respondents. The entire procedure includes the study of the annual and financial reports of the top market players and extensive interviews with industry experts such as CEOs, VPs, directors, and marketing executives for key insights (both qualitative and quantitative) pertaining to the market. The figure below shows the breakdown of the primaries on the basis of the company type, designation, and region considered during the research study.
To know about the assumptions considered for the study, download the pdf brochure
The carbon black market comprises a network of players involved in the research and product development; raw material supply; component manufacturing; distribution and sale; and post-sales services. Key players considered in the analysis of the carbon black market are Cabot Corporation (U.S.), Birla Carbon/Thai Carbon Black Public Company Limited (Thailand), Orion Engineered Carbons SA (Luxembourg), Phillips Carbon Black Limited (India), Tokai Carbon Co., Ltd. (Japan), Omsk Carbon Group OOO (Russia), Jiangxi Black Cat Carbon Black Inc., Ltd. (China), OCI Company Ltd. (South Korea), China Synthetic Rubber Corporation (China), Sid Richardson Carbon & Energy Co. (U.S.), and Mitsubishi Chemical Corporation (Japan).
Target Audience
- Carbon Black Manufacturing Companies
- Traders, Distributors, and Retailers
- Raw Material Suppliers
- Commercial R&D Institutes
- Research Institute, Trade Association, and Government Agencies
Report Scope
By Type:
- Furnace Black
- Channel Black
- Thermal Black
- Acetylene Black
- Others (recycled carbon black and carbon black produced as a by-product)
By Application:
- Tire
- Non-Tire Rubber
- Inks and Coating
- Plastic
- Others (lithium-ion batteries, graphite manufacturing, construction industry, and metallurgy)
By Grade
- Standard Grade
- Specialty Grade
By Region
- Asia-Pacific
- North America
- Europe
- Latin America
- Middle East & Africa
Critical questions which the report answers
- What are new application areas which the carbon black manufacturing companies are exploring?
- Which are the key players in the market and how intense is the competition?
Available Customizations
Based on the given market data, MarketsandMarkets offers customizations in the reports as per the client’s specific requirements. The available customization options are as follows:
Geographic Analysis
- Carbon black market analysis for additional countries
Company Information
- Detailed analysis and profiling of additional market players (Up to 5)
The carbon black market is expected to grow from USD 11.02 billion in 2016 to USD 13.79 billion by 2021, at a CAGR of 4.6%. The use of carbon black in the tire, non-tire rubber and plastics & coating application segments and growing rubber industry are the key factors driving the growth of this market.
Carbon black is a form of paracrystalline carbon manufactured by processing hydrocarbon feedstocks such as fluid catalytic cracking (FCC) tar, coal tar, ethylene cracking tar, and vegetable oil. It is either produced through incomplete combustion of these products or thermal decomposition of gaseous or liquid hydrocarbons.
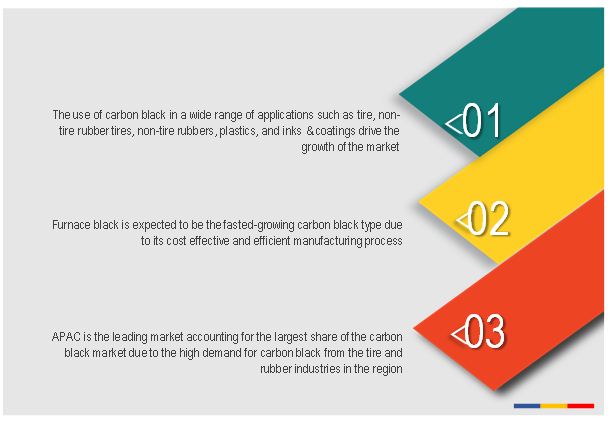
Carbon black market has been segmented, on the basis of its manufacturing process, into different types. These types are furnace black, thermal black, channel black, and acetylene black. The market for furnace black is expected to grow at the highest CAGR between 2016 and 2021. Among all the types, furnace black is the most widely used carbon black as its manufacturing process enables mass production with different particle sizes and structures. Furthermore, furnace black can be used for various applications such as rubber reinforcement and coloring.
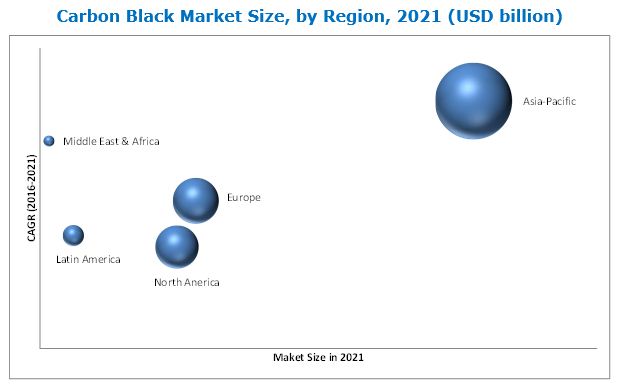
The carbon black market in APAC is expected to grow at the highest CAGR during the forecast period. The growing end-use industries such as automobile, tire, rubber, plastic, ink & coating, and paint has led to the increase in the demand for carbon black in this region. Several North American and European manufacturers are shifting their manufacturing plants to Asia-Pacific due to the low-cost manufacturing advantage in the region. As a result, APAC holds a significant share of the overall carbon black market.
Carbon black applications in the tire, non-tire rubber, plastics, and inks & coating drive the growth of carbon black market
Tire
The tire is one of those applications where carbon black is extensively used for various purposes. Carbon black is used in different parts of tires such as inner-liners, carcasses, sidewalls, and treads, depending on the specific performance requirements. It improves the lifespan of tires as it conducts heat away from the tread and belt area of tires. In addition, carbon black also imparts color to tires.
Non-tire rubber
Carbon black is used as a reinforcing agent and shock absorbent in non-tire rubber products. It is used in the manufacturing of wide range of rubber products such as air springs, belts, hoses, vibration isolation devices, gaskets, bushings, chassis bumpers, pads, wiper blades, grommets, and diaphragm. In addition, carbon black is added in footwear rubber for abrasion resistance and in commercial roofing and weather stripping products for improving resistance.
Plastics
Carbon black plays an important role in plastics application. It is used as filler in the manufacturing of a variety of plastic products such as pipes, films, stretch wrap, industrial bags, photographic containers, and semi-conductive cable compounds. It provides strength, thermal conductivity, antistatic properties and UV protection to plastic products, thereby, improving the performance of plastic products.
Inks & Coatings
In inks & coatings application, carbon black is used to impart pigmentation, UV protection, and thermal conductivity to coatings used in aerospace, automotive, marine, decorative wood, and industrial sectors. It is also used as a pigment in inkjets and paints.
Critical questions the report answers:
- Where will all these developments take the industry in the mid to long term?
- What are the upcoming industry applications for carbon black?
Emission of CO2 gas, nitrogen oxide (NOX), sulfur dioxide (SO2) and particulate matter (PM) during carbon black production is a major factor restraining the growth of the market. The U.S. Environmental Protection Agency (USEPA) has implemented regulations that mandate installing additional technology at all U.S. carbon black manufacturing facilities to reduce emissions of harmful gasses. The International Agency for Research on Cancer (IARC) also raised concern regarding the harmful effects of carbon black on humans.
Key players in the market include Phillips Carbon Black Limited (India), Cabot Corporation (U.S.), OCI Company Ltd. (South Korea), Birla Carbon/Thai Carbon Black Public Company Limited (Thailand), Omsk Carbon Group OOO (Russia), Orion Engineered Carbons SA (Luxembourg), and Tokai Carbon Co., Ltd. (Japan). These players are increasingly undertaking expansions, acquisitions, and new product developments to expand their market share and distribution network in the market.
To speak to our analyst for a discussion on the above findings, click Speak to Analyst
 Exclusive indicates content/data unique to MarketsandMarkets and not available with any competitors.
Table of Contents
1 Introduction (Page No. - 17)
1.1 Objectives of the Study
1.2 Market Definition
1.3 Study Scope
1.3.1 Markets Covered
1.3.2 Years Considered for Market Size Estimation in the Report
1.4 Currency
1.5 Unit Considered
1.6 Stakeholders
2 Research Methodology (Page No. - 20)
2.1 Research Data
2.2 Secondary Data
2.2.1 Key Data From Secondary Sources
2.3 Primary Data
2.3.1 Key Data From Primary Sources
2.3.2 Breakdown of Primary Interviews
2.4 Market Size Estimation
2.5 Data Triangulation
2.6 Research Assumptions and Limitations
2.6.1 Assumptions
2.6.2 Limitations
3 Executive Summary (Page No. - 28)
4 Premium Insights (Page No. - 32)
4.1 Significant Opportunities in the Carbon Black Market
4.2 Carbon Black Market in Asia-Pacific, By Type and Country
4.3 Carbon Black Market Size, By Country
4.4 Carbon Black Market, By Type
4.5 Carbon Black Market, By Grade
5 Market Overview (Page No. - 36)
5.1 Introduction
5.2 Market Segmentation
5.2.1 By Type
5.2.2 By Application
5.2.3 By Grade
5.2.4 By Region
5.3 Market Dynamics
5.4 Impact Analysis
5.4.1 Drivers
5.4.1.1 Increasing Application in Plastics and Coating Industries
5.4.1.2 Growth in Global Rubber Industry Likely to Drive Carbon Black Demand
5.4.2 Restraints
5.4.2.1 Emission of CO2 in Carbon Black Production
5.4.3 Opportunities
5.4.3.1 High Demand in Asia-Pacific Region
5.4.3.2 Increasing Requirement for Uv Protection and Conductive Properties in Plastics
5.4.4 Challenges
5.4.4.1 Volatility in Raw Material Prices
5.4.4.2 Substitution With Silica in Tires
5.4.4.3 Availability of Acceptable Quality of Feedstock
6 Industry Trends (Page No. - 44)
6.1 Introduction
6.2 Carbon Black Market Trends, By Region
6.2.1 U.S.: Huge Impact of Epa Regulations on Carbon Black
6.2.2 Europe: Slow Growth in Carbon Black Market
6.2.3 Asia-Pacific: Carbon Black Market Opportunity
6.3 Supply Chain Analysis
6.4 Porter’s Five Forces
6.4.1 Threat of Substitutes
6.4.2 Threat of New Entrants
6.4.3 Bargaining Power of Suppliers
6.4.4 Bargaining Power of Buyers
6.4.5 Intensity of Competitive Rivalry
6.5 Macro-Economic Indicators
6.5.1 GDP Growth Rate Forecast of Major Economies in the World
6.5.2 Automotive Industry Analysis
6.5.3 Tire Industry Analysis
6.5.4 Rubber Industry Analysis
6.6 Patent Analysis
7 Carbon Black Market, By Type (Page No. - 58)
7.1 Introduction
7.2 Furnace Black
7.3 Channel Black
7.4 Thermal Black
7.5 Acetylene Black
7.6 Others
8 Carbon Black Market, By Application (Page No. - 70)
8.1 Introduction
8.2 Tire
8.3 Non-Tire Rubber
8.4 Plastics
8.5 Inks & Coatings
8.6 Others
9 Carbon Black Market, By Grade (Page No. - 83)
9.1 Introduction
9.2 Standard Grade
9.3 Specialty Grade
10 Carbon Black Market, By Region (Page No. - 91)
10.1 Introduction
10.2 Asia-Pacific
10.2.1 China
10.2.2 India
10.2.3 Japan
10.2.4 Indonesia
10.2.5 Malaysia
10.2.6 Thailand
10.2.7 Rest of Asia-Pacific
10.3 North America
10.3.1 U.S.
10.3.2 Canada
10.3.3 Mexico
10.4 Europe
10.4.1 Germany
10.4.2 U.K.
10.4.3 France
10.4.4 Italy
10.4.5 Spain
10.4.6 Russia
10.4.7 Rest of Europe
10.5 Latin America
10.5.1 Brazil
10.5.2 Argentina
10.5.3 Rest of Latin America
10.6 Middle East & Africa
10.6.1 South Africa
10.6.2 Saudi Arabia
10.6.3 Rest of Middle East & Africa
11 Competitive Landscape (Page No. - 183)
11.1 Overview
11.2 Competitive Situation and Trends
11.3 Expansions: Most Popular Growth Strategy Between 2014 and 2016
11.3.1 Expansions
11.3.2 New Product Developments
11.3.3 Acquisitions
11.4 Market Share Analysis
11.4.1 Cabot Corporation Accounted for the Largest Share in 2015
11.4.2 Capacities of Key Industry Players
12 Company Profiles (Page No. - 191)
12.1 Cabot Corporation
12.1.1 Business Overview
12.1.2 Products Offered
12.1.3 Recent Developments
12.1.4 SWOT Analysis
12.1.5 MnM View
12.2 Thai Carbon Black Public Company Limited (Birla Carbon)
12.2.1 Business Overview
12.2.2 Products Offered
12.2.3 Recent Developments
12.2.4 SWOT Analysis
12.2.5 MnM Analysis
12.3 Orion Engineered Carbons S.A.
12.3.1 Business Overview
12.3.2 Products Offered
12.3.3 Recent Developments
12.3.4 SWOT Analysis
12.3.5 MnM View
12.4 Phillips Carbon Black Limited
12.4.1 Business Overview
12.4.2 Products Offered
12.4.3 Recent Developments
12.4.4 SWOT Analysis
12.4.5 MnM View
12.5 Tokai Carbon Co., Ltd.
12.5.1 Business Overview
12.5.2 Products Offered
12.5.3 Recent Developments
12.5.4 SWOT Analysis
12.5.5 MnM View
12.6 OMSK Carbon Group OOO
12.6.1 Business Overview
12.6.2 Products Offered
12.6.3 Recent Developments
12.6.4 SWOT Analysis
12.6.5 MnM View
12.7 Jiangxi Black Cat Carbon Black Inc., Ltd.
12.7.1 Overview
12.7.2 Products Offered
12.8 OCI Company Ltd.
12.8.1 Overview
12.8.2 Recent Developments
12.9 China Synthetic Rubber Corporation
12.9.1 Business Overview
12.9.2 Products Offered
12.10 SID Richardson Carbon & Energy Co.
12.10.1 Business Overview
12.10.2 Products Offered
12.11 Mitsubishi Chemical Corporation
12.11.1 Business Overview
12.11.2 Products Offered
12.12 Other Key Market Players
12.12.1 Ralson Goodluck Carbon
12.12.2 Longxing Chemical Stock Co, Ltd.
12.12.3 Himadri Chemicals & Industries Ltd.
12.12.4 Shandong Lion King Carbon Black Co., Ltd.
12.12.5 Nippon Steel & Sumikin Chemical Co., Ltd.
12.12.6 Suzhou Baohua Carbon Black Co., Ltd.
12.12.7 Asahi Carbon Co., Ltd.
12.12.8 Shandong Huadong Rubber Materials Co., Ltd.
12.12.9 PJSC "Kremenchug Carbon Black Plant"
13 Appendix (Page No. - 218)
13.1 Insights From Key Industry Expert
13.2 Discussion Guide
13.3 Knowledge Store: Marketsandmarkets Subscription Portal
13.4 RT: Real Time Market Intelligence
13.5 Available Customizations
13.6 Related Reports
13.7 Author Details
List of Tables (171 Tables)
Table 1 Carbon Black Market: By Type
Table 2 Carbon Black Market: By Application
Table 3 Carbon Black Market: By Grade
Table 4 Global Rubber Production, 2000–2015 ('000 Tons)
Table 5 Global Rubber Consumption, 2006-2015 (‘000 Tons)
Table 6 Trends and Forecast for GDP Growth Rates Between 2016 and 2021
Table 7 Rubber Production/Consumption Ratio in Asia-Pacific
Table 8 Carbon Black Market Size, By Type, 2014–2021 (USD Million)
Table 9 Carbon Black Market Size, By Type, 2014–2021 (Kiloton)
Table 10 Furnace Black Market Size, By Region, 2014–2021 (USD Million)
Table 11 Furnace Black Market Size, By Region, 2014–2021 (Kiloton)
Table 12 Channel Black Market Size, By Region, 2014–2021 (USD Million)
Table 13 Channel Black Market Size, By Region, 2014–2021 (Kiloton)
Table 14 Thermal Black Market Size, By Region, 2014–2021 (USD Million)
Table 15 Thermal Black Market Size, By Region, 2014–2021 (Kiloton)
Table 16 Acetylene Black Market Size, By Region, 2014–2021 (USD Million)
Table 17 Acetylene Black Market Size, By Region, 2014–2021 (Kiloton)
Table 18 Other Carbon Black Market Size, By Region, 2014–2021 (USD Million)
Table 19 Other Carbon Black Market Size, By Region, 2014–2021 (Kiloton)
Table 20 Carbon Black Market Size, By Application, 2014–2021 (USD Million)
Table 21 Carbon Black Market Size, By Application, 2014–2021 (Kiloton)
Table 22 Carbon Black Market Size in Tire Application, By Region, 2014–2021 (USD Million)
Table 23 Carbon Black Market Size in Tire Application, By Region, 2014–2021 (Kiloton)
Table 24 Carbon Black Market Size in Non-Tire Rubber Application, By Region, 2014–2021 (USD Million)
Table 25 Carbon Black Market Size in Non-Tire Rubber Application, By Region, 2014–2021 (Kiloton)
Table 26 Carbon Black Market Size in Plastics Application, By Region, 2014–2021 (USD Million)
Table 27 Carbon Black Market Size in Plastics Application, By Region, 2014–2021 (Kiloton)
Table 28 Carbon Black Market Size in Inks & Coatings Application, By Region, 2014–2021 (USD Million)
Table 29 Carbon Black Market Size in Inks & Coatings Application, By Region, 2014–2021 (Kiloton)
Table 30 Carbon Black Market Size in Other Applications, By Region, 2014–2021 (USD Million)
Table 31 Carbon Black Market Size in Other Applications, By Region, 2014–2021 (Kiloton)
Table 32 Carbon Black Market Size, By Grade, 2014–2021 (USD Million)
Table 33 Carbon Black Market Size, By Grade, 2014–2021 (Kiloton)
Table 34 Standard Grade Carbon Black Types
Table 35 Standard Grade Carbon Black Market Size, By Region, 2014–2021 (USD Million)
Table 36 Standard Grade Carbon Black Market Size, By Region, 2014–2021 (Kiloton)
Table 37 Specialty Grade Carbon Black Types and Their Applications
Table 38 Specialty Grade Carbon Black Market Size, By Region, 2014–2021 (USD Million)
Table 39 Specialty Grade Carbon Black Market Size, By Region, 2014–2021 (Kiloton)
Table 40 Asia-Pacific: Carbon Black Market Size, By Country, 2014–2021 (USD Million)
Table 41 Asia-Pacific: Market Size, By Country, 2014–2021 (Kiloton)
Table 42 Asia-Pacific: Market Size, By Type, 2014–2021 (USD Million)
Table 43 Asia-Pacific: Market Size, By Type, 2014–2021 (Kiloton)
Table 44 Asia-Pacific: Market Size, By Application, 2014–2021 (USD Million)
Table 45 Asia-Pacific: Market Size, By Application, 2014–2021 (Kiloton)
Table 46 China: Carbon Black Market Size, By Type, 2014–2021 (USD Million)
Table 47 China: Market Size, By Type, 2014–2021 (Kiloton)
Table 48 China: Market Size, By Application, 2014–2021 (USD Million)
Table 49 China: Market Size, By Application, 2014–2021 (Kiloton)
Table 50 India: Carbon Black Market Size, By Type, 2014–2021 (USD Million)
Table 51 India: Market Size, By Type, 2014–2021 (Kiloton)
Table 52 India: Market Size, By Application, 2014–2021 (USD Million)
Table 53 India: Market Size, By Application, 2014–2021 (Kiloton)
Table 54 Japan: Carbon Black Market Size, By Type, 2014–2021 (USD Million)
Table 55 Japan: Market Size, By Type, 2014–2021 (Kiloton)
Table 56 Japan: Market Size, By Application, 2014–2021 (USD Million)
Table 57 Japan: Market Size, By Application, 2014–2021 (Kiloton)
Table 58 Indonesia: Carbon Black Market Size, By Type, 2014–2021 (USD Million)
Table 59 Indonesia: Market Size, By Type, 2014–2021 (Kiloton)
Table 60 Indonesia: Market Size, By Application, 2014–2021 (USD Million)
Table 61 Indonesia: Market Size, By Application, 2014–2021 (Kiloton)
Table 62 Malaysia: Carbon Black Market Size, By Type, 2014–2021 (USD Million)
Table 63 Malaysia: Market Size, By Type, 2014–2021 (Kiloton)
Table 64 Malaysia: Market Size, By Application, 2014–2021 (USD Million)
Table 65 Malaysia: Market Size, By Application, 2014–2021 (Kiloton)
Table 66 Thailand: Carbon Black Market Size, By Type, 2014–2021 (USD Million)
Table 67 Thailand: Market Size, By Type, 2014–2021 (Kiloton)
Table 68 Thailand: Market Size, By Application, 2014–2021 (USD Million)
Table 69 Thailand: Market Size, By Application, 2014–2021 (Kiloton)
Table 70 Rest of Asia-Pacific: Carbon Black Market Size, By Type, 2014–2021 (USD Million)
Table 71 Rest of Asia-Pacific: Market Size, By Type, 2014–2021 (Kiloton)
Table 72 Rest of Asia-Pacific: Market Size, By Application, 2014–2021 (USD Million)
Table 73 Rest of Asia-Pacific: Market Size, By Application, 2014–2021 (Kiloton)
Table 74 North American Tire Manufacturing Capacities in 2015 (‘OOO Units)
Table 75 North America, Country-Wise Tire Manufacturing Capacities in 2015 (‘OOO Units)
Table 76 North America: Carbon Black Market Size, By Country, 2014–2021 (USD Million)
Table 77 North America: Market Size, By Country, 2014–2021 (Kiloton)
Table 78 North America: Market Size, By Type, 2014–2021 (USD Million)
Table 79 North America: Market Size, By Type, 2014–2021 (Kiloton)
Table 80 North America: Market Size, By Application, 2014–2021 (USD Million)
Table 81 North America: Market Size, By Application, 2014–2021 (Kiloton)
Table 82 Carbon Black Imports in the U.S.
Table 83 U.S.: Carbon Black Market Size, By Type, 2014–2021 (USD Million)
Table 84 U.S.: Market Size, By Type, 2014–2021 (Kiloton)
Table 85 U.S.: Market Size, By Application, 2014–2021 (USD Million)
Table 86 U.S.: Market Size, By Application, 2014–2021 (Kiloton)
Table 87 Canada: Carbon Black Market Size, By Type, 2014–2021 (USD Million)
Table 88 Canada: Market Size, By Type, 2014–2021 (Kiloton)
Table 89 Canada: Market Size, By Application, 2014–2021 (USD Million)
Table 90 Canada: Market Size, By Application, 2014–2021 (Kiloton)
Table 91 Mexico: Carbon Black Market Size, By Type, 2014–2021 (USD Million)
Table 92 Mexico: Market Size, By Type, 2014–2021 (Kiloton)
Table 93 Mexico: Market Size, By Application, 2014–2021 (USD Million)
Table 94 Mexico: Market Size, By Application, 2014–2021 (Kiloton)
Table 95 Europe: Carbon Black Market Size, By Country, 2014–2021 (USD Million)
Table 96 Europe: Market Size, By Country, 2014–2021 (Kiloton)
Table 97 Europe: Market Size, By Type, 2014–2021 (USD Million)
Table 98 Europe: Market Size, By Type, 2014–2021 (Kiloton)
Table 99 Europe: Market Size, By Application, 2014–2021 (USD Million)
Table 100 Europe: Market Size, By Application, 2014–2021 (Kiloton)
Table 101 Germany: Carbon Black Market Size, By Type, 2014–2021 (USD Million)
Table 102 Germany: Market Size, By Type, 2014–2021 (Kiloton)
Table 103 Germany: Market Size, By Application, 2014–2021 (USD Million)
Table 104 Germany: Market Size, By Application, 2014–2021 (Kiloton)
Table 105 U.K.: Carbon Black Market Size, By Type, 2014–2021 (USD Million)
Table 106 U.K.: Market Size, By Type, 2014–2021 (Kiloton)
Table 107 U.K.: Market Size, By Application, 2014–2021 (USD Million)
Table 108 U.K.: Market Size, By Application, 2014–2021 (Kiloton)
Table 109 France: Carbon Black Market Size, By Type, 2014–2021 (USD Million)
Table 110 France: Market Size, By Type, 2014–2021 (Kiloton)
Table 111 France: Market Size, By Application, 2014–2021 (USD Million)
Table 112 France: Market Size, By Application, 2014–2021 (Kiloton)
Table 113 Italy: Carbon Black Market Size, By Type, 2014–2021 (USD Million)
Table 114 Italy: Market Size, By Type, 2014–2021 (Kiloton)
Table 115 Italy: Market Size, By Application, 2014–2021 (USD Million)
Table 116 Italy: Market Size, By Application, 2014–2021 (Kiloton)
Table 117 Spain: Carbon Black Market Size, By Type, 2014–2021 (USD Million)
Table 118 Spain: Market Size, By Type, 2014–2021 (Kiloton)
Table 119 Spain: Market Size, By Application, 2014–2021 (USD Million)
Table 120 Spain: Market Size, By Application, 2014–2021 (Kiloton)
Table 121 Russia: Carbon Black Market Size, By Type, 2014–2021 (USD Million)
Table 122 Russia: Market Size, By Type, 2014–2021 (Kiloton)
Table 123 Russia: Market Size, By Application, 2014–2021 (USD Million)
Table 124 Russia: Market Size, By Application, 2014–2021 (Kiloton)
Table 125 Rest of Europe: Carbon Black Market Size, By Type, 2014–2021 (USD Million)
Table 126 Rest of Europe: Market Size, By Type, 2014–2021 (Kiloton)
Table 127 Rest of Europe: Market Size, By Application, 2014–2021 (USD Million)
Table 128 Rest of Europe: Market Size, By Application, 2014–2021 (Kiloton)
Table 129 Latin America: Carbon Black Market Size, By Country, 2014–2021 (USD Million)
Table 130 Latin America: Market Size, By Country, 2014–2021 (Kiloton)
Table 131 Latin America: Market Size, By Type, 2014–2021 (USD Million)
Table 132 Latin America: Market Size, By Type, 2014–2021 (Kiloton)
Table 133 Latin America: Market Size, By Application, 2014–2021 (USD Million)
Table 134 Latin America: Market Size, By Application, 2014–2021 (Kiloton)
Table 135 Brazilian Automotive Industry
Table 136 Brazil: Carbon Black Market Size, By Type, 2014–2021 (USD Million)
Table 137 Brazil: Market Size, By Type, 2014–2021 (Kiloton)
Table 138 Brazil: Market Size, By Application, 2014–2021 (USD Million)
Table 139 Brazil: Market Size, By Application, 2014–2021 (Kiloton)
Table 140 Argentina: Carbon Black Market Size, By Type, 2014–2021 (USD Million)
Table 141 Argentina: Market Size, By Type, 2014–2021 (Kiloton)
Table 142 Argentina: Market Size, By Application, 2014–2021 (USD Million)
Table 143 Argentina: Market Size, By Application, 2014–2021 (Kiloton)
Table 144 Rest of Latin America: Carbon Black Market Size, By Type, 2014–2021 (USD Million)
Table 145 Rest of Latin America: Market Size, By Type, 2014–2021 (Kiloton)
Table 146 Rest of Latin America: Market Size, By Application, 2014–2021 (USD Million)
Table 147 Rest of Latin America: Market Size, By Application, 2014–2021 (Kiloton)
Table 148 Middle East & Africa: Carbon Black Market Size, By Country, 2014–2021 (USD Million)
Table 149 Middle East & Africa: Market Size, By Country, 2014–2021 (Kiloton)
Table 150 Middle East & Africa: Market Size, By Type, 2014–2021 (USD Million)
Table 151 Middle East & Africa: Market Size, By Type, 2014–2021 (Kiloton)
Table 152 Middle East & Africa: Market Size, By Application, 2014–2021 (USD Million)
Table 153 Middle East & Africa: Market Size, By Application, 2014–2021 (Kiloton)
Table 154 South Africa Tire Manufacturing Facilities
Table 155 South Africa: Carbon Black Market Size, By Type, 2014–2021 (USD Million)
Table 156 South Africa: Market Size, By Type, 2014–2021 (Kiloton)
Table 157 South Africa: Market Size, By Application, 2014–2021 (USD Million)
Table 158 South Africa: Market Size, By Application, 2014–2021 (Kiloton)
Table 159 Saudi Arabia: Market Size, By Type, 2014–2021 (USD Million)
Table 160 Saudi Arabia: Market Size, By Type, 2014–2021 (Kiloton)
Table 161 Saudi Arabia: Market Size, By Application, 2014–2021 (USD Million)
Table 162 Saudi Arabia: Market Size, By Application, 2014–2021 (Kiloton)
Table 163 Rest of Middle East & Africa: Carbon Black Market Size, By Type, 2014–2021 (USD Million)
Table 164 Rest of Middle East & Africa: Market Size, By Type, 2014–2021 (Kiloton)
Table 165 Rest of Middle East & Africa: Market Size, By Application, 2014–2021 (USD Million)
Table 166 Rest of Middle East & Africa: Market Size, By Application, 2014–2021 (Kiloton)
Table 167 Expansions, 2014-2016
Table 168 New Product Developments, 2014–2016
Table 169 Acquisitions, 2015–2016
Table 170 Ownership Interest of Cabot in Its Rubber Black Operations
Table 171 OMSK Group Production Capacity, 2012–2017- F (Kiloton)
List of Figures (68 Figures)
Figure 1 Carbon Black Market: Research Design
Figure 2 Market Size Estimation: Bottom-Up Approach
Figure 3 Market Size Estimation: Top-Down Approach
Figure 4 Carbon Black: Data Triangulation
Figure 5 Furnace Black Dominates Carbon Black Market
Figure 6 Tire to Be the Dominant Application of Carbon Black Between 2016 and 2021
Figure 7 Standard Grade Dominated the Carbon Black Market
Figure 8 Asia-Pacific Led the Carbon Black Market in 2015
Figure 9 Carbon Black Market Size, 2016 vs 2021 (USD Billion)
Figure 10 China to Lead the Carbon Black Market in Asia-Pacific
Figure 11 China Projected to Be the Fastest-Growing Market Between 2016 and 2021
Figure 12 Furnace Black to Dominate the Carbon Black Market, 2016–2021 (USD Million)
Figure 13 Standard Grade Accounted for the Largest Share in 2015 (USD Million)
Figure 14 Carbon Black Market Segmentation, By Region
Figure 15 Growth in Global Rubber Industry Likely to Increased Carbon Black Production
Figure 16 Supply Chain Analysis
Figure 17 Porter’s Five Forces Analysis
Figure 18 Japan Accounted for Maximum Patents Between 2013 and 2016
Figure 19 117 Patents Registered in U.S., Europe, and Japan in 2016
Figure 20 Regional Share in Vehicle Production-2015
Figure 21 Top-10 Vehicle Producing Countries, 2015
Figure 22 Global Tire Production, By Region (2015)
Figure 23 Top-10 Tire Producing Countries, 2015
Figure 24 Major Players in Tire Industry
Figure 25 Furnace Black Type Dominated the Carbon Black Market in 2015
Figure 26 Asia-Pacific Projected to Dominate the Furnace Black Market Segment
Figure 27 Europe Accounted for Second-Largest Share in Channel Black Segment
Figure 28 Asia-Pacific Held the Largest Share in Thermal Black Segment
Figure 29 North America Accounts for Second-Largest Share of Acetylene Black Market
Figure 30 Asia-Pacific Dominates Others Carbon Black Market Segment
Figure 31 Tire Application Dominated the Carbon Black Market in 2015
Figure 32 Asia-Pacific Market Projected to Account for Largest Share in Tire Application
Figure 33 Europe Accounted for Second-Largest Share in Non-Tire Rubber Application
Figure 34 Carbon Black Consumption in Plastics Industry Highest in Asia-Pacific
Figure 35 Asia-Pacific to Dominates Carbon Black Market in Inks & Coatings Application
Figure 36 Asia-Pacific to Leads Carbon Black Market in Others Application Segment
Figure 37 Standard Grade Dominated the Carbon Black Market in 2015
Figure 38 Asia-Pacific Projected to Dominate the Standard Grade Carbon Black Market
Figure 39 Asia-Pacific to Lead Specialty Carbon Black
Figure 40 Regional Snapshot: Rapidly Growing Markets are Emerging as New Strategic Locations
Figure 41 Asia-Pacific Market Snapshot: China to Be the Largest Market
Figure 42 Tire Application Accounted for Largest Share of Asia-Pacific Carbon Black Market in 2015
Figure 43 China Carbon Black Production and Capacity (Kiloton)
Figure 44 Chinese Carbon Black Top 10 Export Destination, 2015 (Kiloton)
Figure 45 India Carbon Black Production and Production Capacity (Kiloton)
Figure 46 Thailand Tire Production (Million Unit)
Figure 47 North America Market Snapshot: U.S. to Be the Largest Market
Figure 48 U.S. Market Snapshot, 2016 vs 2021
Figure 49 Tire Sales Volume in South Africa in 2015
Figure 50 Companies Adopted Expansions as the Key Growth Strategy Between 2014 and 2016
Figure 51 Market Evaluation Framework: Expansions Fuelled Growth Between 2014 and 2016
Figure 52 Top 6 Players Accounted for Major Share of the Market in 2015
Figure 53 Major Players in Carbon Black Industry
Figure 54 Cabot Corporation: Company Snapshot
Figure 55 Cabot Corporation: SWOT Analysis
Figure 56 Thai Carbon Black Public Company Limited (Birla Carbon): Company Snapshot
Figure 57 Thai Carbon Black Public Company Limited (Birla Carbon): SWOT Analysis
Figure 58 Orion Engineered Carbons S.A.: Company Snapshot
Figure 59 Orion Engineered Carbons S.A.: SWOT Analysis
Figure 60 Phillips Carbon Black Limited: Company Snapshot
Figure 61 Phillips Carbon Black Limited: SWOT Analysis
Figure 62 Tokai Carbon Co., Ltd.: Company Snapshot
Figure 63 Tokai Carbon Co., Ltd.: SWOT Analysis
Figure 64 OMSK Carbon Group OOO: SWOT Analysis
Figure 65 Jiangxi Black Cat Carbon Black Inc., Ltd.: Company Snapshot
Figure 66 OCI Company Ltd.: Company Snapshot
Figure 67 China Synthetic Rubber Corporation: Company Snapshot
Figure 68 Mitsubishi Chemical Corporation: Company Snapshot


Growth opportunities and latent adjacency in Carbon Black Market