Recovered Carbon Black (rCB) Market by Application (Tire application, Non-Tire Rubber application, Plastics application, Coatings application, and Inks application), and Region (North America, Europe, Asia Pacific, RoW) - Global Forecast to 2023


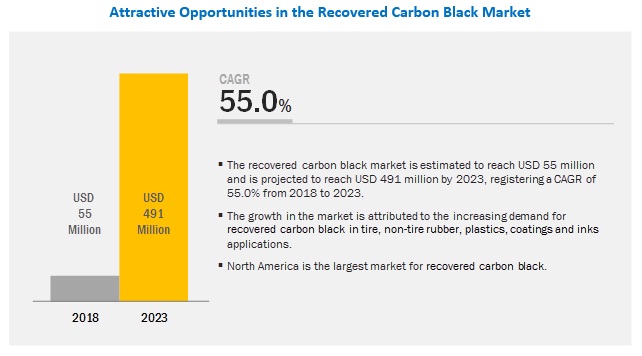
The Recovered Carbon Black Market was valued at USD 55 million in 2018 and is projected to reach USD 491 million by 2023, growing at a cagr 55.0% from 2018 to 2023. Recovered carbon black is widely used as an environmentally-friendly and sustainable reinforcing filler in tire and non-tire rubber products. The growth of the recovered carbon black market is, therefore, directly associated with the growing demand for environmentally-friendly and sustainable reinforcing filler in tire and non-tire rubber applications.

Non-tire rubber application is projected to be the second-fastest-growing market during the forecast period.
Recovered carbon black is used as a reinforcing agent in the production of several non-tire rubber products. These products include conveyor belts, hoses, gaskets, seals, rubber sheets, geomembranes, and rubber roofing. It is also used in footwear rubber to impart abrasion resistance. The recovered carbon black increases the strength of mechanical rubber products as it has low ash content. The growth in this application is associated with the growing rubber industry and the rising need for environmentally-friendly products.
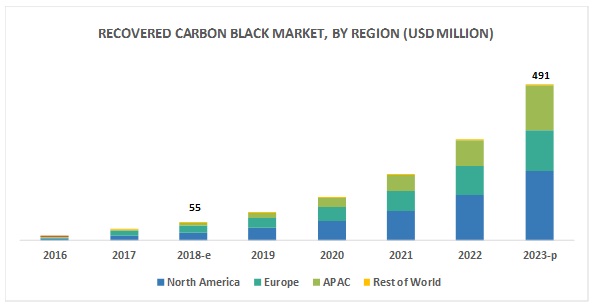

North America is estimated to account for the largest market share during the forecast period.
North America is estimated to dominate the overall recovered carbon black market in 2018. The region has emerged as the largest consumer of recovered carbon black, owing to the growth in production and consumption of recovered carbon black in countries such as the US, Canada, and Mexico. The problems arising from the dumping of end-of-life tires and the rising demand for environmentally-friendly products from tire, rubber, and automotive industries in these countries is expected to drive the market for recovered carbon black during the forecast period.
Some of the leading players of the recovered carbon black market are Pyrolyx (Germany), Delta-Energy Group (US), Black Bear Carbon (Netherlands), Scandinavian Enviro Systems AB (Sweden), Klean Industries (Canada), Radhe Group of Energy (India), Alpha Carbone (France), Bolder Industries (US), DRON Industries (Slovakia), DVA Renewable Energy JSC (Vietnam), Enrestec (Taiwan), Integrated Resource Recovery (US), and SR2O Holdings (US).
Scope of the Report
|
Report Metric |
Details |
|
Years considered for the study |
2016–2023 |
|
Base year |
2017 |
|
Forecast period |
2018–2023 |
|
Units considered |
Value (USD million and USD thousands) and Volume (kiloton and ton) |
|
Segments covered |
Application and Region |
|
Geographies covered |
North America, APAC, Europe, and Rest of World |
|
Companies covered |
Pyrolyx (Germany), Delta-Energy Group (US), Black Bear Carbon (Netherlands), Scandinavian Enviro Systems AB (Sweden), Klean Industries (Canada), Radhe Group of Energy (India), and Bolder Industries (US), among the total 17 key players covered. |
This research report categorizes the global recovered carbon black market on the basis of application and region.
On the basis of application:
- Tire
- Non-tire rubber
- Plastics
- Coatings
- Inks
On the basis of region:
- North America
- Europe
- APAC
- Rest of World
The market is further analyzed for the key countries in each of these regions.
Recent Developments
- In December 2018, Scandinavian Enviro Systems AB (Sweden) signed a Memorandum of Understanding (MoU) with EE-TDF Cleveland (US), a company involved in tire recycling. Under this agreement, the companies will construct a recycling plant with a capacity of recycling about 30 kilotons tires/year at the existing site of EE-TDF Cleveland located in Texas, US. This agreement will enable Enviro to increase its footprint in the US market.
- In October 2018, Pyrolyx USA, a subsidiary of Pyrolyx (Germany), started construction of a plant at Terre Haute, Indiana, US. It is expected to be entirely built by May 2019 and is likely to be operational in June 2019. This plant will have a processing capacity of 40,000 tons of end-life-tires, annually, and will produce about 13 kilotons of recovered carbon black, 17.5 kilotons of pyrolysis oil, and 6.2 kilotons of steel.
- In June 2018, Scandinavian Enviro Systems AB (Sweden) signed an MoU with Treadcraft Limited (US), a tire recycling company, for establishing a recycling plant in New York, US. This plant will have a recycling capacity of about 30 kilotons tires/year and is expected to increase the presence of Enviro in the North American Market.
Key Questions addressed by the report
- What are the global trends in demand for recovered carbon black? Will the market witness an increase or decline in demand in the coming years?
- What is the estimated demand for recovered carbon black from tire application?
- What were the revenue pockets for the recovered carbon black market in 2017?
- What is the different regulation developed for the dumping of end-of-life tires globally?
- Who are the key players in the recovered carbon black market globally?
To speak to our analyst for a discussion on the above findings, click Speak to Analyst
 Exclusive indicates content/data unique to MarketsandMarkets and not available with any competitors.
Table of Contents
1 Introduction (Page No. - 12)
1.1 Objectives of the Study
1.2 Market Definition
1.3 Scope of the Market
1.3.1 Years Considered for the Study
1.4 Currency
1.5 Unit Considered
1.6 Stakeholders
2 Research Methodology (Page No. - 15)
2.1 Research Data
2.1.1 Secondary Data
2.1.1.1 Key Data From Secondary Sources
2.1.2 Primary Data
2.1.2.1 Key Data From Primary Sources
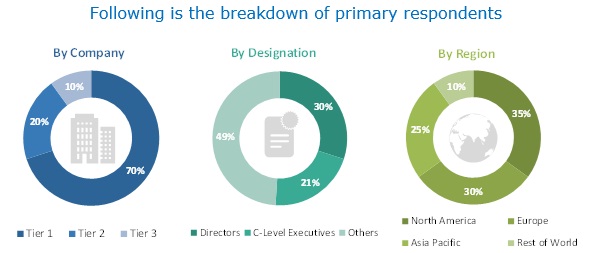
2.1.2.2 Breakdown of Primary Interviews
2.2 Market Size Estimation
2.3 Data Triangulation
2.4 Assumptions and Limitations
2.4.1 Assumptions
2.4.2 Limitations
3 Executive Summary (Page No. - 22)
4 Premium Insights (Page No. - 24)
4.1 Attractive Opportunities in the Recovered Carbon Black Market
4.2 Recovered Carbon Black Market, By Application
4.3 North America Recovered Carbon Black Market, By Application and Country
4.4 Recovered Carbon Black Market, By Country
5 Market Overview (Page No. - 26)
5.1 Introduction
5.2 Advantages of rCB
5.3 Comparison of rCB and Virgin Carbon Black
5.4 Pricing Analysis
5.5 Market Dynamics
5.5.1 Drivers
5.5.1.1 Abundant Availability of ELTS, the Raw Material for rCB Production
5.5.1.2 Low and Fixed Price of rCB
5.5.2 Opportunities
5.5.2.1 Need for Green Alternatives to Reduce Carbon Footprints
5.5.2.2 Growing Demand for Tire and Rubber Products
5.5.3 Challenges
5.5.3.1 Fear of Using rCB as an Alternative to Virgin Carbon Black
5.5.3.2 Providing Consistent Quality of rCB
6 Industry Trends (Page No. - 33)
6.1 Introduction
6.2 Development of Standards for rCB
6.3 Supply Chain Analysis
6.4 Porter’s Five Forces
6.4.1 Threat of Substitutes
6.4.2 Threat of New Entrants
6.4.3 Bargaining Power of Suppliers
6.4.4 Bargaining Power of Buyers
6.4.5 Intensity of Competitive Rivalry
6.5 Macroeconomic Indicators
6.5.1 GDP Growth Rate Forecast of Major Economies in the World
6.5.2 Tire Industry Analysis
6.5.3 Rubber Industry Analysis
7 rCB Market, By Application (Page No. - 40)
7.1 Introduction
7.2 Tire
7.2.1 Tire to Remain the Dominant Application of the rCB Market
7.3 Non-Tire Rubber
7.3.1 APAC to Be the Fastest-Growing Market for rCB in Non-Tire Rubber Application
7.4 Plastics
7.4.1 Rising Plastic Production to Drive the Demand for rCB in Plastics Application, Globally
7.5 Coatings
7.5.1 North America to Remain the Largest Market for rCB in Coatings Application
7.6 Inks
7.6.1 APAC to Be the Fastest-Growing Market for rCB in Inks Application
8 rCB Market, By Region (Page No. - 50)
8.1 Introduction
8.2 North America
8.2.1 US
8.2.1.1 US to Be Fastest-Growing Market for rCB in North America
8.2.2 Canada
8.2.2.1 Tire to Remain the Dominant Application of rCB Market in Canada
8.2.3 Mexico
8.2.3.1 Growing Tire Manufacturing to Drive the rCB Market in Mexico
8.3 Europe
8.3.1 Germany
8.3.1.1 Germany to Be the Largest Market for rCB in Europe
8.3.2 France
8.3.2.1 Tire Industry to Be the Fastest-Growing Consumer of rCB in France
8.3.3 UK
8.3.3.1 Growing Tire Industry to Drive the rCB Market in UK
8.3.4 Italy
8.3.4.1 Tire to Be the Largest Application for rCB in Italy
8.3.5 Rest of Europe
8.3.5.1 Growing Demand From Tire and Non-Tire Rubber Applications to Drive the rCB Market in Rest of Europe
8.4 APAC
8.4.1 China
8.4.1.1 China to Be the Fastest-Growing Market for rCB in APAC
8.4.2 India
8.4.2.1 Growing Rubber Manufacturing to Drive the rCB Market in India
8.4.3 Rest of APAC
8.4.3.1 Tire to Remain the Dominant Application of rCB in Rest of APAC
8.5 RoW
9 Competitive Landscape (Page No. - 70)
9.1 Introduction
9.2 Start-Up Microquadrant for rCB Manufacturers
9.2.1 Progressive Companies
9.2.2 Responsive Companies
9.2.3 Starting Blocks
9.2.4 Dynamic Companies
10 Company Profiles (Page No. - 72)
(Business Overview, Products Offered, Recent Developments)*
10.1 Pyrolyx
10.2 Black Bear Carbon
10.3 Scandinavian Enviro Systems AB (Enviro)
10.4 Delta-Energy Group
10.5 Radhe Group of Energy
10.6 Klean Industries
10.7 Alpha Carbone
10.8 Bolder Industries
10.9 Dron Industries
10.10 DVA Renewable Energy JSC
10.11 Enrestec
10.12 Integrated Resource Recovery (IRR)
10.13 Sr2o Holdings
10.14 New Entrants
*Details on Business Overview, Products Offered, Recent Developments Might Not Be Captured in Case of Unlisted Companies.
11 Appendix (Page No. - 88)
11.1 Insights From Industry Experts
11.2 Discussion Guide
11.3 Knowledge Store: Marketsandmarkets’ Subscription Portal
11.4 Available Customizations
11.5 Related Reports
11.6 Author Details
List of Tables (65 Tables)
Table 1 rCB V/S Virgin Carbon Black
Table 2 Global Market Size of Carbon Black and rCB, 2016—2023 (USD Million)
Table 3 Global Market Size of Carbon Black and rCB, 2016—2023 (Kiloton)
Table 4 rCB Price By Region, 2016—2023 (USD/Kg)
Table 5 rCB Price By Application, 2016–2023 (USD/Kg)
Table 6 ELTS Generated, 2017 (Million Units)
Table 7 Average Global Price of rCB, 2016—2023 (USD/Kg)
Table 8 Standards for rCB
Table 9 Trends and Forecast of Percentage Growth Rates Between 2018 and 2023
Table 10 Rubber Production By Region, 2016–2017 (Million Ton)
Table 11 Rubber Consumption By Region, 2016–2017 (Million Ton)
Table 12 rCB Market Size, By Application, 2016–2023 (USD Million)
Table 13 rCB Market Size, By Application, 2016–2023 (Kiloton)
Table 14 Tire Production By Region, 2014–2017 (Million Ton)
Table 15 rCB Market Size in Tire Application, By Region, 2016–2023 (USD Million)
Table 16 rCB Market Size in Tire Application, By Region, 2016–2023 (Kiloton)
Table 17 Rubber Production By Type, 2016–2017 (Million Ton)
Table 18 Rubber Consumption By Type, 2016–2017 (Million Ton)
Table 19 rCB Market Size in Non-Tire Rubber Application, By Region, 2016–2023 (USD Million)
Table 20 rCB Market Size in Non-Tire Rubber Application, By Region, 2016–2023 (Kiloton)
Table 21 rCB Market Size in Plastics Application, By Region, 2016–2023 (USD ’000)
Table 22 rCB Market Size in Plastics Application, By Region, 2016–2023 (Ton)
Table 23 rCB Market Size in Coatings Application, By Region, 2016–2023 (USD ’000)
Table 24 rCB Market Size in Coatings Application, By Region, 2016–2023 (Ton)
Table 25 rCB Market Size in Inks Application, By Region, 2016–2023 (USD ’000)
Table 26 rCB Market Size in Inks Application, By Region, 2016–2023 (Ton)
Table 27 rCB Market Size, By Region, 2016–2023 (USD Million)
Table 28 rCB Market Size, By Region, 2016–2023 (Kiloton)
Table 29 North America: rCB Market Size, By Country, 2016–2023 (USD Million)
Table 30 North America: rCB Market Size, By Country, 2016–2023 (Kiloton)
Table 31 North America: rCB Market Size, By Application, 2016–2023 (USD Million)
Table 32 North America: rCB Market Size, By Application, 2016–2023 (Kiloton)
Table 33 US Scrap Tires Management, 2009–2017 (Kiloton)
Table 34 US: rCB Market Size, By Application, 2016–2023 (USD Million)
Table 35 US: rCB Market Size, By Application, 2016–2023 (Kiloton)
Table 36 Canada: rCB Market Size, By Application, 2016–2023 (USD ’000)
Table 37 Canada: rCB Market Size, By Application, 2016–2023 (Ton)
Table 38 Mexico: rCB Market Size, By Application, 2016–2023 (USD ’000)
Table 39 Mexico: rCB Market Size, By Application, 2016–2023 (Ton)
Table 40 Europe: rCB Market Size, By Country, 2016–2023 (USD Million)
Table 41 Europe: rCB Market Size, By Country, 2016–2023 (Kiloton)
Table 42 Europe: rCB Market Size, By Application, 2016–2023 (USD Million)
Table 43 Europe: rCB Market Size, By Application, 2016–2023 (Kiloton)
Table 44 Germany: rCB Market Size, By Application, 2016–2023 (USD ’000)
Table 45 Germany: rCB Market Size, By Application, 2016–2023 (Ton)
Table 46 France: rCB Market Size, By Application, 2016–2023 (USD ’000)
Table 47 France: rCB Market Size, By Application, 2016–2023 (Ton)
Table 48 UK: rCB Market Size, By Application, 2016–2023 (USD ’000)
Table 49 UK: rCB Market Size, By Application, 2016–2023 (Ton)
Table 50 Italy: rCB Market Size, By Application, 2016–2023 (USD ’000)
Table 51 Italy: rCB Market Size, By Application, 2016–2023 (Ton)
Table 52 Rest of Europe: rCB Market Size, By Application, 2016–2023 (USD ’000)
Table 53 Rest of Europe: rCB Market Size, By Application, 2016–2023 (Ton)
Table 54 APAC: rCB Market Size, By Country, 2016–2023 (USD Million)
Table 55 APAC: rCB Market Size, By Country, 2016–2023 (Kiloton)
Table 56 APAC: rCB Market Size, By Application, 2016–2023 (USD Million)
Table 57 APAC: rCB Market Size, By Application, 2016–2023 (Kiloton)
Table 58 China: rCB Market Size, By Application, 2016–2023 (USD ’000)
Table 59 China: rCB Market Size, By Application, 2016–2023 (Ton)
Table 60 India: rCB Market Size, By Application, 2016–2023 (USD ’000)
Table 61 India: rCB Market Size, By Application, 2016–2023 (Ton)
Table 62 Rest of APAC: rCB Market Size, By Application, 2016–2023 (USD ’000)
Table 63 Rest of APAC: rCB Market Size, By Application, 2016–2023 (Ton)
Table 64 RoW: rCB Market Size, By Application, 2016–2023 (USD ’000)
Table 65 RoW: rCB Market Size, By Application, 2016–2023 (Ton)
List of Figures (32 Figures)
Figure 1 rCB Market Segmentation
Figure 2 rCB Market: Research Design
Figure 3 Bottom-Up Approach
Figure 4 Top-Down Approach
Figure 5 rCB Market: Data Triangulation
Figure 6 Tire to Be the Dominant Application of rCB Between 2018 and 2023
Figure 7 North America Accounted for the Largest Share of the rCB Market
Figure 8 Increasing Demand From Various End-Use Industries to Drive the Market
Figure 9 Tire to Be the Largest Type Segment of the Market
Figure 10 Tire Segment and the US Accounted for the Largest Share of the Recovered Carbon Black Market in 2017
Figure 11 US to Be the Largest Recovered Carbon Black Market
Figure 12 Global Market Size of Carbon Black and rCB, 2016-2023 (USD Million)
Figure 13 Overview of Factors Governing the rCB Market
Figure 14 ELTS Generated, 2017
Figure 15 Supply Chain Analysis
Figure 16 Porter’s Five Forces Analysis
Figure 17 Tire Production, By Region (2014–2017)
Figure 18 ELTS Generation, 2008–2020
Figure 19 Rubber Production, By Region (2016–2017)
Figure 20 Rubber Consumption, By Region (2016–2017)
Figure 21 Tire Application Was the Dominant Consumer of rCB in 2017
Figure 22 North America Estimated to Be the Largest rCB Market in Tire Application in 2018
Figure 23 North America Projected to Be the Largest rCB Market in Non-Tire Rubber Application
Figure 24 North America to Be the Largest rCB Market in Plastics Application
Figure 25 North America Projected to Be the Largest rCB Market in Coatings Application
Figure 26 North America Expected to Be the Largest rCB Market in Inks Application
Figure 27 Regional Snapshot: Rapidly Growing Markets are Emerging as New Strategic Locations
Figure 28 North America Market Snapshot: US Was the Largest Market in 2017
Figure 29 APAC Market Snapshot: China Was the Fastest-Growing Market Between 2018 and 2023
Figure 30 rCB Market : Start-Up Microquadrant, 2017
Figure 31 Pyrolyx: Company Snapshot
Figure 32 Enviro: Company Snapshot
The study involved four major activities in estimating the current market size for recovered carbon black. Exhaustive secondary research was done to collect information related to the recovered carbon black market, virgin carbon black market, and end-of-life tires market. The next step was to validate these findings, assumptions, and sizing with industry experts across the value chain through primary research. Both the top-down and bottom-up approaches were employed to estimate the overall market size. Thereafter, market breakdown and data triangulation were used to estimate the market size of the segments and subsegments.
Secondary Research
In the secondary research process, various secondary sources such as Hoovers, Bloomberg BusinessWeek, and Dun & Bradstreet have been referred to identify and collect information for this study. These secondary sources included annual reports, press releases & investor presentations of companies; white papers; certified publications; articles by recognized authors; gold standard & silver standard websites; regulatory bodies; trade directories; and databases.
Primary Research
The recovered carbon black market comprises several stakeholders such as raw material suppliers, processors, end-product manufacturers, and regulatory organizations in the supply chain. The demand side of this market is characterized by the development of the tire, automotive, rubber, plastics, and inks industries and the growth in population. The supply side is characterized by advancements in technology. Various primary sources from both the supply and demand sides of the market were interviewed to obtain qualitative and quantitative information.
To know about the assumptions considered for the study, download the pdf brochure
Market Size Estimation
Both the top-down and bottom-up approaches were used to estimate and validate the size of the global recovered carbon black market and to estimate the sizes of various other dependent submarkets. The research methodology used to estimate the market size includes the following:
- The key players in the industry were identified through extensive secondary research.
- The supply chain of the industry and market size, in terms of value and volume, were determined through primary and secondary research.
- All percentage shares and breakdowns were determined using secondary sources and verified through primary sources.
- All possible parameters that affect the markets covered in this research study were accounted for, viewed in extensive detail, verified through primary research, and analyzed to obtain the final quantitative and qualitative data.
- The research includes the study of reports, reviews, and newsletters of key industry players along with extensive interviews with key officials, such as directors and marketing executives.
Data Triangulation
After arriving at the total market size through the estimation process explained above, the overall market was split into several segments and subsegments. The data triangulation and market breakdown procedures were employed, wherever applicable, to complete the overall market size estimation process and arrive at the exact statistics for all segments and subsegments. The data was triangulated by studying various factors and trends from both the demand and supply sides. In addition, the market size was validated by using both top-down and bottom-up approaches. Then, it was verified through primary interviews. Hence, for every data segment, there are three sources-top-down approach, bottom-up approach, and expert interviews. The data was assumed to be correct when the values arrived at from the three sources matched.
Report Objectives
- To define, describe, and forecast the size of the recovered carbon black market, in terms of value and volume
- To provide information about the significant factors influencing the growth of the market (drivers, restraints, opportunities, and challenges)
- To analyze and forecast the market size on the basis of application and region
- To forecast the market size of different segments with respect to four main regions, namely, North America, Europe, Asia Pacific (APAC), and Rest of World
- To analyze the opportunities in the market for stakeholders by identifying the high-growth segments of the market
- To analyze the competitive developments such as expansions, joint venture, agreement, and research & development (R&D) activities in the market
- To strategically profile the key players and comprehensively analyze their growth strategies
Available Customizations:
With the given market data, MarketsandMarkets offers customizations according to the company’s specific needs. The following customization options are available for the report:
Regional Analysis:
- Further breakdown of a region with respect to a particular country
Company Information:
- Detailed analysis and profiling of additional market players (up to 5)
Product Analysis
- Product Matrix that gives a detailed comparison of product portfolio of each company


Growth opportunities and latent adjacency in Recovered Carbon Black (rCB) Market