Inorganic Pigments Market by Pigment Type (Titanium Dioxide, Iron Oxide, Carbon Black), Application (Paints & Coatings, Plastics, Inks), End-Use Industry (Building & Construction, Automotive, Packaging, Textiles), Region - Global Forecast to 2024


Updated on : April 17, 2024
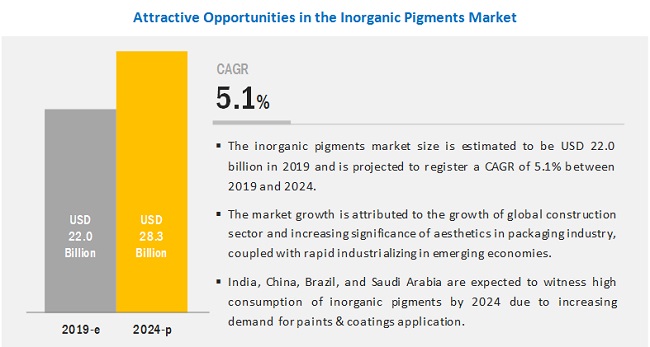
Inorganic Pigments Market was valued at USD 22.0 billion in 2019 and is projected to reach USD 28.3 billion by 2024, growing at 5.1% cagr from 2019 to 2024. This high growth is primarily driven by the growth of the global construction sector. The growing importance of aesthetics in the packaging industry is also supporting the growth of the market.
Titanium dioxide accounts for the largest share of the overall market.
Titanium dioxide is the most-widely used inorganic pigments, owing to its excellent physical properties. The excellent light-scattering properties of titanium dioxide help to provide good white opacity and brightness to surfaces. It is widely consumed because of its white color. Iron oxide is projected to be the second-largest pigment type during the forecast period.
Paints & coatings application is expected to grow at the highest rate during the forecast period
The paints & coatings segment is projected to be the largest and the fastest-growing application during the forecast period. Increased performance of coated objects and technological advancements in coating technology are the key factors for growth of paints & coatings. The market in the plastics application is expected to grow at a significant rate during the forecast period.
Building & construction is projected to be the fastest-growing end-use industry during the forecast period.
On the basis of end-use industry, the inorganic pigments market is segmented into building & construction, automotive, packaging, paper & printing, textiles, and others. Inorganic pigments fulfill the requirements for heat stability, chemical inertness, durability, and weather resistance in the construction industry. Building & construction is projected to be the fastest-growing end-use industry of the inorganic pigments market during the forecast period.
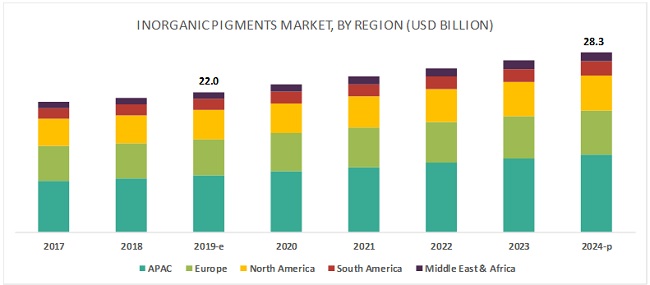
APAC is expected to account for the largest share of the global market during the forecast period.
Based on region, the inorganic pigments market has been segmented into APAC, Europe, North America, the Middle East & Africa, and South America. APAC is the largest and the fastest-growing inorganic pigments market owing to the increasing investments in the construction & industrial sector, along with the rapidly growing population of the region. Increasing consumer purchasing power has propelled the growth of various industries in this region. These factors are expected to lead to increasing demand for inorganic pigments in the region during the forecast period.
Key Market Players
The major vendors in the inorganic pigments market are Venator (UK), The Chemours Company (US), Tronox Limited (US), LANXESS (Germany), Kronos Worldwide, Inc. (US), Cathay Industries (China), Clariant (Switzerland), Ferro Corporation (US), Heubach GmbH (Germany), Lomon Billions (China), Alabama Pigments Company (US), Cabot Corporation (US), Carl Schlenk AG (Germany), Dominion Colour Corporation (Canada), DyStar (US), ECKART GmbH (Germany), Heubach GmbH (Germany), INEOS Pigments (US), Jiangsu Yuxing Industry & Trade Co., Ltd. (China), Matapel Chemicals (Indonesia), Tasnee (Saudi Arabia), Sudarshan Chemicals (India), Sun Chemical (US), Tata Pigments (India), and Zhejiang Huayuan Pigments Co., Ltd. (China).
Venator (UK) is among the leading inorganic pigments manufacturers globally. The company is one of the three largest titanium dioxide producer and is also among the three largest synthetic inorganic color pigments producers. New product launch was the key strategy adopted by the company to penetrate the global inorganic pigments market. LANXESS (Germany) is one of the leading manufacturers of iron oxide and chromium oxide pigments. These pigments are primarily used for coloring applications in construction, coatings, plastics, and paper. The company has adopted investment & expansion as its key growth strategy to increase its competitiveness in the global market.
Inorganic Pigments Market Report Scope
|
Report Metric |
Details |
|
Years considered for the study |
2017-2024 |
|
Base year |
2018 |
|
Forecast period |
2019-2024 |
|
Units considered |
Volume (Kiloton, Ton) |
|
Segments |
Pigment Type, Application, End-use Industry, and Region |
|
Regions |
North America, APAC, Europe, South America, and the Middle East & Africa |
|
Companies |
Venator (UK), The Chemours Company (US), Tronox Limited (US), LANXESS (Germany), Kronos Worldwide, Inc. (US), and others |
This research report categorizes the inorganic pigments market based on pigment type, application, end-use industry, and region.
On the basis of Pigment Type, the inorganic pigments market has been segmented as follows
- Titanium Dioxide
- Iron Oxide
- Carbon Black
- Others (chromium, cadmium, zinc oxide, and manganese)
On the basis of Application, the inorganic pigments market has been segmented as follows
- Paints & Coatings
- Plastics
- Inks
- Others (ceramics, rubber, laminates, and glass)
On the basis of End-Use Industry, the inorganic pigments market has been segmented as follows
- Building & construction
- Automotive
- Packaging
- Paper & printing
- Textiles
- Others (consumer goods, cosmetics, and electronics)
On the basis of Region, the inorganic pigments market has been segmented as follows
- APAC
- Europe
- North America
- Middle East & Africa
- South America
Key questions addressed by the report
- What are the upcoming hot bets for the inorganic pigments market?
- How are the market dynamics changing for different types of inorganic pigments?
- How are the market dynamics changing for different end-use industries of inorganic pigments?
- Who are the major manufacturers of inorganic pigments?
- How are the market dynamics changing for different regions of inorganic pigments?
To speak to our analyst for a discussion on the above findings, click Speak to Analyst
 Exclusive indicates content/data unique to MarketsandMarkets and not available with any competitors.
Table of Contents
1 Introduction (Page No. - 17)
1.1 Objectives of the Study
1.2 Market Definition
1.3 Market Scope
1.3.1 Regions Covered
1.3.2 Years Considered for the Study
1.4 Currency
1.5 Unit Considered
1.6 Limitations
1.7 Stakeholders
2 Research Methodology (Page No. - 20)
2.1 Research Data
2.1.1 Secondary Data
2.1.1.1 Key Data From Secondary Sources
2.1.2 Primary Data
2.1.2.1 Key Data From Primary Sources
2.1.2.2 Key Industry Insights
2.1.2.3 Breakdown of Primary Interviews
2.2 Market Size Estimation
2.2.1 Bottom-Up Approach
2.2.2 Top-Down Approach
2.3 Data Triangulation
2.3.1 Inorganic Pigments Market Analysis Through Primary Interviews
2.3.2 Inorganic Pigments Market Analysis Through Secondary Sources
2.4 Research Limitations
2.5 Assumptions
3 Executive Summary (Page No. - 28)
3.1 Introduction
4 Premium Insights (Page No. - 31)
4.1 Attractive Opportunities in the Inorganic Pigments Market
4.2 Inorganic Pigments Market, By Pigment Type
4.3 Inorganic Pigments Market, By Application
4.4 Inorganic Pigments Market, By End-Use Industry
4.5 Inorganic Pigments Market, By Region
4.6 APAC Inorganic Pigments Market, By End-Use Industry and Country
5 Market Overview (Page No. - 34)
5.1 Introduction
5.2 Market Dynamics
5.2.1 Drivers
5.2.1.1 Growth of Global Construction Sector
5.2.1.2 Increasing Significance of Aesthetics in Packaging Industry
5.2.2 Restraints
5.2.2.1 Stringent Regulations Related to Cadmium and Chromium-Based Pigments
5.2.2.2 Raw Material Price Fluctuation
5.2.3 Opportunities
5.2.3.1 Rapid Industrialization in Emerging Economies
5.2.4 Challenges
5.2.4.1 Regulations Related to Plastic Recycling
5.3 Porter’s Five Forces Analysis
5.3.1 Bargaining Power of Buyers
5.3.2 Bargaining Power of Suppliers
5.3.3 Threat of New Entrants
5.3.4 Threat of Substitutes
5.3.5 Intensity of Competitive Rivalry
5.4 Macroeconomic Indicator
5.4.1 Global GDP Trends and Forecasts
5.4.2 Trends in Plastics Industry
5.4.3 Trends in Automotive Industry
6 Inorganic Pigments Market, By Pigment Type (Page No. - 44)
6.1 Introduction
6.2 Titanium Dioxide
6.2.1 Titanium Dioxide is the Most-Widely Consumed Inorganic Pigment
6.3 Iron Oxide
6.3.1 Increasing Demand From Construction Sector and Rapid Urbanization to Drive the Demand for Iron Oxide
6.4 Carbon Black
6.4.1 Carbon Black Mostly Used for Its Good Tinting Strength, UV Protection, and Thermal Conductivity
6.5 Others
7 Inorganic Pigments Market, By Application (Page No. - 49)
7.1 Introduction
7.2 Paints & Coatings
7.2.1 Growth of Construction and Automotive Industries to Fuel Consumption of Inorganic Pigments
7.3 Plastics
7.3.1 Demand for Better Aesthetics in Plastics Driving Consumption of Inorganic Pigments
7.4 Inks
7.4.1 Digital Printing Industry to Drive the Demand for Inorganic Pigment in Inks Application
7.5 Others
8 Inorganic Pigments Market, By End-Use Industry (Page No. - 53)
8.1 Introduction
8.2 Building & Construction
8.2.1 Growing Preference for Good Aesthetics in Building & Construction Industry to Drive the Demand
8.3 Automotive
8.3.1 Growth of Automotive Industry to Drive the Demand for Inorganic Pigment in Automotive Coating
8.4 Packaging
8.4.1 Increasing Significance of Aesthetics in Packaging Industry to Drive the Demand
8.5 Paper & Printing
8.5.1 Developing Countries Witnessing Increasing Demand for Paper
8.6 Textile
8.6.1 Changing Fashion Trend Fueling Consumption of Inorganic Pigments
8.7 Others
9 Inorganic Pigments Market, By Region (Page No. - 62)
9.1 Introduction
9.2 APAC
9.2.1 China
9.2.1.1 Growing Demand for Paints & Coatings to have Positive Impact on Inorganic Pigments Market
9.2.2 India
9.2.2.1 Growing Construction Industry Will Propel the Inorganic Pigments Market
9.2.3 Japan
9.2.3.1 Increasing Automobiles Production Expected to Boost the Market
9.2.4 South Korea
9.2.4.1 Increased Demand From the Construction Industry is Driving the Market
9.2.5 Indonesia
9.2.5.1 Steady Economic Growth of the Country to Drive the Demand for Inorganic Pigments
9.2.6 Thailand
9.2.6.1 Developing Industries are Expected to Drive the Market in Thailand
9.2.7 Rest of APAC
9.3 Europe
9.3.1 Germany
9.3.1.1 Presence of Strong Industrial Base Likely to Drive Inorganic Pigments Market in Germany
9.3.2 France
9.3.2.1 Increasing Paints & Coatings Application Expected to Boost the Market Growth
9.3.3 UK
9.3.3.1 Growth of Construction Sector to Spur the Demand for Inorganic Pigments
9.3.4 Italy
9.3.4.1 Construction and Packaging Industries of Italy to Fuel the Inorganic Pigments Market
9.3.5 Spain
9.3.5.1 Growth of Various Industries Will Drive the Inorganic Pigments Market
9.3.6 Russia
9.3.6.1 Automotive and Construction Sectors Likely to Drive the Inorganic Pigments Market
9.3.7 Rest of Europe
9.4 North America
9.4.1 US
9.4.1.1 Automotive and Construction Industries Will Drive the Inorganic Pigments Market in US
9.4.2 Canada
9.4.2.1 Recovery of Country’s Economy Favorable for Market Growth
9.4.3 Mexico
9.4.3.1 Growing Demand for Plastics in Mexico is Expected to Fuel Consumption of Inorganic Pigments
9.5 South America
9.5.1 Brazil
9.5.1.1 With A Growing Industrial Sector, Brazil is A Lucrative Market for Inorganic Pigments
9.5.2 Argentina
9.5.2.1 Shrinking Economy Impacting Inorganic Pigments Market in Argentina
9.5.3 Chile
9.5.3.1 Strong Growth of Construction Sector Expected to Increase Consumption of Inorganic Pigments
9.5.4 Rest of South America
9.6 Middle East & Africa
9.6.1 Saudi Arabia
9.6.1.1 Increasing Investment in Infrastructure Expected to Spur the Demand for Inorganic Pigments
9.6.2 South Africa
9.6.2.1 Increased Investment in Construction Industry Boosting the Market
9.6.3 UAE
9.6.3.1 UAE’s Growing Infrastructure Will Drive the Inorganic Pigments Demand
9.6.4 Turkey
9.6.4.1 Increasing Investment in Industrial Sector Expected to Lead the Growth of Inorganic Pigments Market
9.6.5 Rest of Middle East & Africa
10 Competitive Landscape (Page No. - 102)
10.1 Overview
10.2 Competitive Leadership Mapping, 2018
10.2.1 Visionary Leaders
10.2.2 Innovators
10.2.3 Dynamic Differentiators
10.2.4 Emerging Players
10.2.5 Strength of Product Portfolio
10.2.6 Business Strategy Excellence
10.3 Ranking of Key Players
10.3.1 Venator
10.3.2 The Chemours Company
10.3.3 Tronox Limited
10.3.4 Lanxess
10.3.5 Kronos Worldwide, Inc.
10.4 Competitive Scenario
10.4.1 Investment & Expansion
10.4.2 New Product Launch
10.4.3 Merger & Acquisition
11 Company Profiles (Page No. - 111)
(Business overview, Products offered, Recent Developments, SWOT Analysis, MNM view)*
11.1 Venator
11.2 The Chemours Company
11.3 Tronox Limited
11.4 Lanxess
11.5 Kronos Worldwide, Inc.
11.6 Cathay Industries
11.7 Clariant
11.8 Ferro Corporation
11.9 Heubach GmbH
11.10 Lomon Billions
11.11 Other Companies
11.11.1 Alabama Pigments Company
11.11.2 Cabot Corporation
11.11.3 Carl Schlenk AG
11.11.4 Dominion Colour Corporation
11.11.5 Dystar
11.11.6 Eckart GmbH
11.11.7 Habich GmbH
11.11.8 Ineos Pigments
11.11.9 Jiangsu Yuxing Industry & Trade Co., LTD.
11.11.10 Matapel Chemicals
11.11.11 National Industrialization Company (Tasnee)
11.11.12 Sudarshan Chemicals
11.11.13 Sun Chemical
11.11.14 Tata Pigments
11.11.15 Zhejiang Huayuan Pigment Co., LTD.
*Details on Business overview, Products offered, Recent Developments, SWOT Analysis, MNM view might not be captured in case of unlisted companies.
12 Appendix (Page No. - 137)
12.1 Discussion Guide
12.2 Knowledge Store: Marketsandmarkets Subscription Portal
12.3 Available Customizations
12.4 Related Reports
12.5 Author Details
List of Tables (102 Tables)
Table 1 Household Disposable Income, Net Annual Growth Rate (%)
Table 2 Regulations in Pigments Market
Table 3 Import Prices of Titanium Dioxide (USD/Ton)
Table 4 Export Prices of Titanium Dioxide (USD/Ton)
Table 5 Projected GDP Percentage Change of Key Countries, 2019–2024
Table 6 Plastics Demand, By Country, 2014–2018 (Kiloton)
Table 7 Automobile Production Statistics, By Country, 2014–2018, (Units)
Table 8 Inorganic Pigments Market Size, By Pigment Type, 2017–2024 (Kiloton)
Table 9 Inorganic Pigments Market Size, By Pigment Type, 2017–2024 (USD Million)
Table 10 Inorganic Pigments Market Size, By Application, 2017–2024 (Kiloton)
Table 11 Inorganic Pigments Market Size, By Application, 2017–2024 (USD Million)
Table 12 Inorganic Pigments Market Size, By End-Use Industry, 2017–2024 (Kiloton)
Table 13 Inorganic Pigments Market Size, By End-Use Industry, 2017–2024 (USD Million)
Table 14 Inorganic Pigments Market Size in Building & Construction, By Region, 2017–2024 (Kiloton)
Table 15 Inorganic Pigments Market Size in Building & Construction, By Region, 2017–2024 (USD Million)
Table 16 Inorganic Pigments Market Size in Automotive, By Region, 2017–2024 (Kiloton)
Table 17 Inorganic Pigments Market Size in Automotive, By Region, 2017–2024 (USD Million)
Table 18 Inorganic Pigments Market Size in Packaging, By Region, 2017–2024 (Kiloton)
Table 19 Inorganic Pigments Market Size in Packaging, By Region, 2017–2024 (USD Million)
Table 20 Inorganic Pigments Market Size in Paper & Printing, By Region, 2017–2024 (Ton)
Table 21 Inorganic Pigments Market Size in Paper & Printing, By Region, 2017–2024 (USD Million)
Table 22 Inorganic Pigments Market Size in Textile, By Region, 2017–2024 (Ton)
Table 23 Inorganic Pigments Market Size in Textile, By Region, 2017–2024 (USD Million)
Table 24 Inorganic Pigments Market Size in Other End-Use Industries, By Region, 2017–2024 (Ton)
Table 25 Inorganic Pigments Market Size in Other End-Use Industries, By Region, 2017–2024 (USD Million)
Table 26 Inorganic Pigments Market Size, By Region, 2017–2024 (Kiloton)
Table 27 Inorganic Pigments Market Size, By Region, 2017–2024 (USD Million)
Table 28 APAC: Inorganic Pigments Market Size, By Country, 2017–2024 (Kiloton)
Table 29 APAC: Inorganic Pigments Market Size, By Country, 2017–2024 (USD Million)
Table 30 APAC: Inorganic Pigments Market Size, By End-Use Industry, 2017–2024 (Kiloton)
Table 31 APAC: Inorganic Pigments Market Size, By End-Use Industry, 2017–2024 (USD Million)
Table 32 China: Inorganic Pigments Market Size, By End-Use Industry, 2017–2024 (Kiloton)
Table 33 China: Inorganic Pigments Market Size, By End-Use Industry, 2017–2024 (USD Million)
Table 34 India: Inorganic Pigments Market Size, By End-Use Industry, 2017–2024 (Kiloton)
Table 35 India: Inorganic Pigments Market Size, By End-Use Industry, 2017–2024 (USD Million)
Table 36 Japan: Inorganic Pigments Market Size, By End-Use Industry, 2017–2024 (Ton)
Table 37 Japan: Inorganic Pigments Market Size, By End-Use Industry, 2017–2024 (USD Million)
Table 38 South Korea: Inorganic Pigments Market Size, By End-Use Industry, 2017–2024 (Ton)
Table 39 South Korea: Inorganic Pigments Market Size, By End-Use Industry, 2017–2024 (USD Million)
Table 40 Indonesia: Inorganic Pigments Market Size, By End-Use Industry, 2017–2024 (Ton)
Table 41 Indonesia: Inorganic Pigments Market Size, By End-Use Industry, 2017–2024 (USD Million)
Table 42 Thailand: Inorganic Pigments Market Size, By End-Use Industry, 2017–2024 (Ton)
Table 43 Thailand: Inorganic Pigments Market Size, By End-Use Industry, 2017–2024 (USD Thousand)
Table 44 Rest of APAC: Inorganic Pigments Market Size, By End-Use Industry, 2017–2024 (Ton)
Table 45 Rest of APAC: Inorganic Pigments Market Size, By End-Use Industry, 2017–2024 (USD Thousand)
Table 46 Europe: Inorganic Pigments Market Size, By Country, 2017–2024 (Kiloton)
Table 47 Europe: Inorganic Pigments Market Size, By Country, 2017–2024 (USD Million)
Table 48 Europe: Inorganic Pigments Market Size, By End-Use Industry, 2017–2024 (Ton)
Table 49 Europe: Inorganic Pigments Market Size, By End-Use Industry, 2017–2024 (USD Million)
Table 50 Germany: Inorganic Pigments Market Size, By End-Use Industry, 2017–2024 (Ton)
Table 51 Germany: Inorganic Pigments Market Size, By End-Use Industry, 2017–2024 (USD Million)
Table 52 France: Inorganic Pigments Market Size, By End-Use Industry, 2017–2024 (Ton)
Table 53 France: Inorganic Pigments Market Size, By End-Use Industry, 2017–2024 (USD Million)
Table 54 UK: Inorganic Pigments Market Size, By End-Use Industry, 2017–2024 (Ton)
Table 55 UK: Inorganic Pigments Market Size, By End-Use Industry, 2017–2024 (USD Thousand)
Table 56 Italy: Inorganic Pigments Market Size, By End-Use Industry, 2017–2024 (Ton)
Table 57 Italy: Inorganic Pigments Market Size, By End-Use Industry, 2017–2024 (USD Thousand)
Table 58 Spain: Inorganic Pigments Market Size, By End-Use Industry, 2017–2024 (Ton)
Table 59 Spain: Inorganic Pigments Market Size, By End-Use Industry, 2017–2024 (USD Thousand)
Table 60 Russia: Inorganic Pigments Market Size, By End-Use Industry, 2017–2024 (Ton)
Table 61 Russia: Inorganic Pigments Market Size, By End-Use Industry, 2017–2024 (USD Thousand)
Table 62 Rest of Europe: Inorganic Pigments Market Size, By End-Use Industry, 2017–2024 (Ton)
Table 63 Rest of Europe: Inorganic Pigments Market Size, By End-Use Industry, 2017–2024 (USD Thousand)
Table 64 North America: Inorganic Pigments Market Size, By Country, 2017–2024 (Kiloton)
Table 65 North America: Inorganic Pigments Market Size, By Country, 2017–2024 (USD Million)
Table 66 North America: Inorganic Pigments Market Size, By End-Use Industry, 2017–2024 (Ton)
Table 67 North America: Inorganic Pigments Market Size, By End-Use Industry, 2017–2024 (USD Million)
Table 68 US: Inorganic Pigments Market Size, By End-Use Industry, 2017–2024 (Ton)
Table 69 US: Inorganic Pigments Market Size, By End-Use Industry, 2017–2024 (USD Million)
Table 70 Canada: Inorganic Pigments Market Size, By End-Use Industry, 2017–2024 (Ton)
Table 71 Canada: Inorganic Pigments Market Size, By End-Use Industry, 2017–2024 (USD Million)
Table 72 Mexico: Inorganic Pigments Market Size, By End-Use Industry, 2017–2024 (Ton)
Table 73 Mexico: Inorganic Pigments Market Size, By End-Use Industry, 2017–2024 (USD Thousand)
Table 74 South America: Inorganic Pigments Market Size, By Country, 2017–2024 (Ton)
Table 75 South America: Inorganic Pigments Market Size, By Country, 2017–2024 (USD Million)
Table 76 South America: Inorganic Pigments Market Size, By End-Use Industry, 2017–2024 (Ton)
Table 77 South America: Inorganic Pigments Market Size, By End-Use Industry, 2017–2024 (USD Million)
Table 78 Brazil: Inorganic Pigments Market Size, By End-Use Industry, 2017–2024 (Ton)
Table 79 Brazil: Inorganic Pigments Market Size, By End-Use Industry, 2017–2024 (USD Million)
Table 80 Argentina: Inorganic Pigments Market Size, By End-Use Industry, 2017–2024 (Ton)
Table 81 Argentina: Inorganic Pigments Market Size, By End-Use Industry, 2017–2024 (USD Thousand)
Table 82 Chile: Inorganic Pigments Market Size, By End-Use Industry, 2017–2024 (Ton)
Table 83 Chile: Inorganic Pigments Market Size, By End-Use Industry, 2017–2024 (USD Thousand)
Table 84 Rest of South America: Inorganic Pigments Market Size, By End-Use Industry, 2017–2024 (Ton)
Table 85 Rest of South America: Inorganic Pigments Market Size, By End-Use Industry, 2017–2024 (USD Thousand)
Table 86 Middle East & Africa: Inorganic Pigments Market Size, By Country, 2017–2024 (Kiloton)
Table 87 Middle East & Africa: Inorganic Pigments Market Size, By Country, 2017–2024 (USD Million)
Table 88 Middle East and Africa: Inorganic Pigments Market Size, By End-Use Industry, 2017–2024 (Ton)
Table 89 Middle East and Africa: Inorganic Pigments Market Size, By End-Use Industry, 2017–2024 (USD Million)
Table 90 Saudi Arabia: Inorganic Pigments Market Size, By End-Use Industry, 2017–2024 (Ton)
Table 91 Saudi Arabia: Inorganic Pigments Market Size, By End-Use Industry, 2017–2024 (USD Million)
Table 92 South Africa: Inorganic Pigments Market Size, By End-Use Industry, 2017–2024 (Ton)
Table 93 South Africa: Inorganic Pigments Market Size, By End-Use Industry, 2017–2024 (USD Thousand)
Table 94 UAE: Inorganic Pigments Market Size, By End-Use Industry, 2017–2024 (Ton)
Table 95 UAE: Inorganic Pigments Market Size, By End-Use Industry, 2017–2024 (USD Thousand)
Table 96 Turkey: Inorganic Pigments Market Size, By End-Use Industry, 2017–2024 (Ton)
Table 97 Turkey: Inorganic Pigments Market Size, By End-Use Industry, 2017–2024 (USD Thousand)
Table 98 Rest of Middle East & Africa: Inorganic Pigments Market Size, By End-Use Industry, 2017–2024 (Ton)
Table 99 Rest of Middle East & Africa: Inorganic Pigments Market Size, By End-Use Industry, 2017–2024 (USD Thousand)
Table 100 Investment & Expansion, 2017–2019
Table 101 New Product Launch, 2017–2019
Table 102 Merger & Acquisition, 2017–2019
List of Figures (43 Figures)
Figure 1 Market Segmentation
Figure 2 Inorganic Pigments Market: Research Design
Figure 3 Inorganic Pigments Market: Bottom-Up Approach
Figure 4 Inorganic Pigments Market: Top-Down Approach
Figure 5 Inorganic Pigments Market: Data Triangulation
Figure 6 Inorganic Pigments Market Analysis: Secondary Sources
Figure 7 Titanium Dioxide Dominated the Overall Inorganic Pigments Market in 2018
Figure 8 Paints & Coatings to Be the Leading Application of Inorganic Pigments
Figure 9 Food & Beverage to Be the Fastest-Growing End-Use Industry of Inorganic Pigments Market
Figure 10 APAC Inorganic Pigments Market to Witness the Highest Growth Rate
Figure 11 Significant Growth Projected in the Market Between 2019 and 2024
Figure 12 Titanium Dioxide to Be the Dominant Pigment Type in the Overall Market
Figure 13 Paints & Coatings Was the Largest Application in 2018
Figure 14 Building & Construction Was the Largest End-Use Industry in 2018
Figure 15 India to Register the Highest CAGR During the Forecast Period
Figure 16 China Accounted for the Largest Market Share in 2018
Figure 17 Drivers, Restraints, Opportunities, and Challenges in the Inorganic Pigments Market
Figure 18 Inorganic Pigments Market: Porter’s Five Forces Analysis
Figure 19 Titanium Dioxide Segment to Register the Highest CAGR During Forecast Period
Figure 20 Paints & Coatings to Be the Leading Application of Inorganic Pigments
Figure 21 Building & Construction to Be the Leading End-Use Industry of Inorganic Pigments
Figure 22 APAC to Be the Largest and Fastest-Growing Inorganic Pigments Market
Figure 23 Inorganic Pigments Market in India to Grow at the Fastest Rate
Figure 24 APAC: Inorganic Pigments Market Snapshot
Figure 25 Europe: Inorganic Pigments Market Snapshot
Figure 26 North America: Inorganic Pigments Market Snapshot
Figure 27 Companies Adopted New Product Launch as the Key Growth Strategy Between 2017 and 2019
Figure 28 Inorganic Pigments Market: Competitive Leadership Mapping, 2018
Figure 29 Venator Led the Market in 2018
Figure 30 Venator: Company Snapshot
Figure 31 Venator: SWOT Analysis
Figure 32 The Chemours Company: Company Snapshot
Figure 33 The Chemours Company: SWOT Analysis
Figure 34 Tronox Limited: Company Snapshot
Figure 35 Tronox Limited: SWOT Analysis
Figure 36 Lanxess: Company Snapshot
Figure 37 Lanxess: SWOT Analysis
Figure 38 Kronos Worldwide, Inc.: Company Snapshot
Figure 39 Kronos Worldwide, Inc.: SWOT Analysis
Figure 40 Clariant: Company Snapshot
Figure 41 Ferro Corporation: Company Snapshot
Figure 42 Heubach GmbH: Company Snapshot
Figure 43 Lomon Billions: Company Snapshot
The study involved four major activities to estimate the current market size of inorganic pigments. Exhaustive secondary research was done to collect information on the market, the peer market, and the parent market. The next step was to validate these findings, assumptions, and sizing with industry experts across the value chain through primary research. Both top-down and bottom-up approaches were employed to estimate the complete market size. Thereafter, market breakdown and data triangulation were used to estimate the market size of the segments and sub-segments.
Secondary Research
In the secondary research process, various secondary sources, such as Hoovers, Bloomberg Businessweek, Factiva, World Bank, and Industry Journals, were referred to for identifying and collecting information for this study. These secondary sources included annual reports, press releases & investor presentations of companies; white papers; certified publications; articles by recognized authors; and databases.
Primary Research
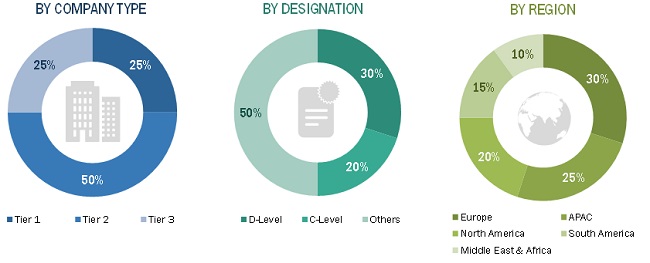
The inorganic pigments market comprises several stakeholders, such as raw material suppliers, processors, end-product manufacturers, and regulatory organizations, in the supply chain. The demand side of this market is characterized by the development of building & construction, automotive, packaging, paper & printing, textiles, and other end-use industries. The supply side is characterized by advancements in technology. Various primary sources from both the supply and demand sides of the market were interviewed to obtain qualitative and quantitative information. Following is the breakdown of the primary respondents:
To know about the assumptions considered for the study, download the pdf brochure
Market Size Estimation
Both the top-down and bottom-up approaches were used to estimate and validate the total size of the inorganic pigments market. These methods were also used extensively to estimate the size of various sub-segments in the market. The research methodology used to estimate the market size included the following:
- The key players in the industry and markets were identified through extensive secondary research.
- The industry’s supply chain and market size, in terms of value, were determined through primary and secondary research processes.
- All percentage shares, splits, and breakdowns were determined using secondary sources and verified through primary sources.
Data Triangulation
After arriving at the overall market size using the market size estimation processes as explained above, the market was split into several segments and sub-segments. In order to complete the overall market engineering process and arrive at the exact statistics of each market segment and subsegment, the data triangulation and market breakdown procedures were employed, wherever applicable. The data was triangulated by studying various factors and trends from both the demand and supply sides in the food & beverage, metal & mining, chemical, pharmaceutical, power generation, and other industries.
Report Objectives:
- To analyze and forecast the inorganic pigments market size, in terms of value and volume
- To provide detailed information about the key factors (drivers, restraints, opportunities, and challenges) influencing the growth of the market
- To define, describe, and forecast the market by pigment type, application, and end-use industry
- To forecast the size of the market with respect to five regions, namely, Asia Pacific (APAC), Europe, North America, South America, and the Middle East & Africa (MEA), along with their countries
- To strategically analyze micromarkets1 with respect to individual growth trends, prospects, and their contribution to the overall market
- To analyze the opportunities in the market for stakeholders and provide a competitive landscape for the market leaders
- To analyze competitive developments such as new product launch, merger & acquisition, and investment & expansion in the market
- To strategically profile the key players and comprehensively analyze their market shares and core competencies.
Available Customizations:
ith the given market data, MarketsandMarkets offers customizations according to the company’s specific needs.
The following customization options are available for the report:
Product Analysis
- Product matrix, which gives a detailed comparison of the product portfolio of each company
Regional Analysis
- Further breakdown of the Rest of APAC inorganic pigments market
Company Information
- Detailed analysis and profiling of additional market players (up to five)


Growth opportunities and latent adjacency in Inorganic Pigments Market
hello, The article is very informative.