Cast Elastomer Market

Cast Elastomer Market by Type (Hot Cast Elastomer, Cold Cast elastomer), End-use industry (Oil & Gas, Industrial, Automotive & Transportation, Mining), & Region(Asia Pacific, Europe, North America, MEA, South America) - Global Forecast to 2028

Report Code: CH 6406 Jul, 2023, by marketsandmarkets.com

Updated on : August 06, 2024

Cast Elastomer Market

The global cast elastomer market was valued at USD 1.4 billion in 2023 and is projected to reach USD 1.8 billion in 2028, growing at 5.0% cagr from 2023 to 2028. The market is mainly led by the significant usage of cast elastomers in various end-use industries. The increasing industrialization and manufacturing activities in emerging economies coupled with the superior advantage of cast elastomers over conventional materials are driving the market for cast elastomers.

Cast Elastomer Market

To know about the assumptions considered for the study, Request for Free Sample Report

Attractive Opportunities in the Cast Elastomer Market

Cast Elastomer Market

Cast Elastomer Market Dynamics

Driver: Increasing demand for high value end use induustries.

The market for cast elastomers is likely to witness significant growth in the coming years due to its increasing demand from various end-use industries such as mining, automotive & transportation, machinery, medical, and oil & gas. Cast elastomers can be molded to meet various durometer hardness according to the requirements of a specific application. In the mining industry, hot cast polyurethane elastomers are particularly used in mineral processing applications that include separating screens, conveyor scrapers, and other components. The high load-bearing capacity, high abrasion resistance, resilience, and impact strength properties of cast polyurethane elastomers help increase the performance and longevity of mining equipment. The growth in the cast elastomer market is also expected to be supported by the increasing output in the mining industry with growing exploration activities, particularly in the emerging economies. A number of projects and expansion activities are expected to come online by 2026, which will further support the growth of the cast elastomer market in the coming years. The expansion of the oil and gas industry, particularly in emerging markets, has resulted in increased exploration and production activities. This, in turn, drives the demand for cast elastomers for various applications within the industry. As oil and gas companies seek to enhance operational efficiency, reduce maintenance costs, and improve safety, the use of high-performance elastomeric materials like cast elastomers becomes crucial.

Superior advantages over conventional  materials.

Cast elastomers are tough, cost-effective, and elastic materials, which can retain their original shape and properties for longer service life. They bridge the gap between highly extensible elastomers and low elongation plastic. These elastomers have a combination of some performance advantages of metals, engineering plastics, and ceramics. They also have the flexibility and resiliency of rubber. Cast elastomers have a high load-bearing capacity, high abrasion and impact resistance, high resilience, and excellent resistance to oil and grease. They are also light in weight and offer high wear and tear resistance and functional toughness. Most elastomers are prone to ozone cracking, whereas polyurethane has no ozone cracking problem. Cast polyurethane can be easily manufactured by pouring and casting, which is a one-shot method. This method enables economical tooling and fabrication of complicated parts of any shape and size. Cast elastomers exhibit high elasticity, allowing them to stretch and recover their original shape after deformation. This property enables them to provide effective sealing and vibration damping, making them ideal for applications where a tight seal is required or where shock absorption is necessary. Examples include seals, gaskets, suspension components, and vibration isolators.

Increasing manufacturing activities in emerging economies:

Rapid urbanization and industrialization, and growing foreign investments, coupled with supportive government policies, have created favorable opportunities for the polymer industry in emerging economies such as India, China, and Brazil. These factors enable polymer manufacturers to consistently innovate and develop products that are resilient and match the performance requirements of next-generation applications. Consumer demand and regulations have encouraged polymers manufacturers to develop innovative products that are more lightweight, stronger, more energy-efficient, and guarantee performance as per expectations under harsh conditions.

Restraint: Hazardous impact on the environment and human health.

Isocyanates are highly reactive and low molecular weight chemicals, which are used in the manufacturing of products such as coatings, fibers, flexible and rigid foams, varnishes, and elastomers. Isocyanates, including MDI, TDI, and HDI, which are highly reactive and toxic, are the major raw materials used for the production of polyurethane cast elastomers. Hence, there is a widespread outcry against the sales and consumption of these chemicals. Overexposure to isocyanates vapors is hazardous to human health as it can cause skin, eye, nose, throat, and lung irritation. Compliance with evolving regulations can be complex and expensive for manufacturers. They may need to invest in additional equipment, implement safer handling procedures, and modify production processes to reduce or eliminate hazardous substances. These factors can add to the final production costs, thus reducing the profit margins in the cast elastomer market.

Opportunity: Continous technological advancement.

The harmful effects of exposure to isocyanates and the implementation of stringent regulations have encouraged manufacturers to undertake regular technological advancements. The increased awareness toward environmental sustainability, rising competition in the cast elastomer market, and volatility in raw material prices have also encouraged manufacturers to develop new products. For instance, products with low-free or low-residual monomer content reduce exposure to potentially carcinogenic substances and also improve their physical properties. The use of simulation software allows manufacturers to model and predict the behavior of cast elastomers during the design and development stages. Finite element analysis (FEA) and computational fluid dynamics (CFD) simulations help optimize material formulations, predict mechanical properties, and simulate the performance of elastomeric components under different operating conditions. This enables manufacturers to make informed decisions, reduce the need for physical prototypes, and accelerate product development cycles. Machine learning and AI algorithms can be applied to various aspects of the cast elastomer industry. They can be used to analyze large datasets, identify patterns, and extract valuable insights. For example, machine learning algorithms can optimize material formulations by identifying relationships between different ingredients and desired properties. AI-powered quality control systems can detect defects or anomalies during the manufacturing process, improving efficiency and reducing waste. Digitalization enables predictive maintenance strategies for equipment used in the production of cast elastomers. By collecting data from sensors and monitoring equipment conditions, manufacturers can analyze patterns and detect early signs of equipment failure or degradation. This allows for proactive maintenance and reduces the risk of unexpected downtime. Predictive maintenance optimizes equipment performance, extends its lifespan, and enhances overall productivity. Such initiatives, in line with continuous technological advancements, are projected to offer immense growth opportunities for the players in the cast elastomer market.

Challenge: Compliance with stringent regulations and standards.

The adverse effects caused by isocyanates on the environment and human health have led to the implementation of stringent government regulations. The market is scrutinized under stringent standards and regulations, which the manufacturers have to comply. Regulators are coming up with legislation to limit isocyanate consumption in polyurethanes. Owing to these factors, there is significant pressure on manufacturers and downstream players to limit the consumption of isocyanates. Cast elastomer manufacturers are obliged to revise their existing production processes to lower greenhouse gas emission levels and decrease pollution levels. Compliance with regulations is necessary as slight negligence in manufacturing the product may cause harmful effects on the environment and human health. Compliance with such standards and regulations needs more effort, time, cost, and resources. Cast elastomer manufacturers have to deal with stringent standards and, at the same time, need to keep the product cost-effective. This is a major challenge for them.

Fluctuating raw material prices.

Due to the fluctuations in crude oil prices, the prices of raw materials for cast elastomer have been affected. Manufacturers have had to cope with these fluctuations, which have reduced their profit margins. This has compelled market players to enhance the efficiency and productivity of their operations to sustain growth. Trade policies, including tariffs and trade agreements, can impact the cost and availability of raw materials. Changes in trade policies or the imposition of tariffs on certain raw materials can disrupt supply chains, increase costs, and lead to price fluctuations. International trade disputes and negotiations can have an impact on raw material prices in the cast elastomer market

Cast Elastomer Market Ecosystem

A market ecosystem refers to the interconnected network of individuals, businesses, and other organizations participating in a particular market. It includes various stakeholders such as producers, distributors, retailers, customers, and regulatory bodies that interact with each other to exchange goods, services, and information. Prominent companies in the market are the ones who are well-established and financially stable and have state-of-the-art technologies and a strong global marketing network and sales record. The key players in this market are BASF (Germany), Dow (US), Huntsman Corporation (US), Covestro AG (Germany), Lanxess (Germany), Era Polymers (Australia), Mitsui  Chemicals, Inc. (Japan), Notedome Ltd. (England), TOSOH Corporation (Japan), Wanhua Chemical Group  Co.,  Ltd. (China).

Cast Elastomer Market Ecosystem

"Hot cast elastomer is the largest type of cast elastomers in 2023, in terms of value."

Hot cast elastomer accounted for the largest market share in the global cast elastomer market, in terms of value, in 2023.   The segment is also projected to grow at the highest CAGR in value in 2023s Hot cast elastomers exhibit outstanding physical properties, including high tear resistance, tensile strength, and elongation. These qualities make them suitable for demanding applications that necessitate durability, flexibility, and resistance to wear and tear. Hot cast elastomers can be easily and efficiently processed. They can be molded into complex shapes, enabling the creation of intricate parts and components with precise dimensions. The hot casting process also allows for the production of large parts, reducing the need for assembly or joining multiple pieces. Hot cast elastomers possess excellent damping properties, allowing them to absorb and dissipate energy, thereby reducing vibrations and noise. This makes them suitable for applications where noise and vibration control are important, such as automotive suspension systems, industrial machinery, and equipment mounts. Hot cast elastomers perform well over a broad temperature range, enabling their effective operation in both high and low temperature environments. This adaptability makes them suitable for applications prone to temperature fluctuations.These factors are driving its demand in the cast elastomer market.

"Industrial sector was the largest end-use industry application for cast elastomer market in 2023, in terms of value."

Cast elastomers find extensive use in the industrial sector due to their versatile properties and ability to meet diverse application requirements. They are employed in various industries such as manufacturing, automotive, oil and gas, mining, construction, chemical processing, and power generation. Cast elastomers are used for seals, gaskets, linings, coatings, vibration dampening, and other critical applications in industrial equipment and machinery. Cast elastomers can contribute to cost savings in industrial settings. They can extend the lifespan of equipment by providing wear resistance and protection against corrosion. This leads to reduced maintenance and replacement costs, making cast elastomers a cost-effective choice for industries looking to optimize their operational efficiency. Industrial environments often involve exposure to extreme temperatures, weather conditions, and chemicals. Cast elastomers exhibit good performance and stability under such conditions, making them preferred materials for industrial applications. They can withstand wide temperature ranges, resist UV degradation, and maintain their properties in aggressive chemical environments Industrial equipment often requires protection from wear, corrosion, and impact to ensure safe and reliable operation. Cast elastomers provide a protective barrier against these factors, preventing damage and improving equipment performance. They also offer vibration dampening properties, contributing to equipment safety and operator comfort. Cast elastomers offer the advantage of customization, allowing manufacturers to tailor their properties to meet specific industrial requirements. They can be formulated with different hardness levels, ranging from soft to hard, and engineered to possess specific characteristics like tear resistance, impact resistance, and flexibility. This versatility enables the design and production of elastomers that are well-suited to various industrial applications. These factors contribute to the industrial sector holding the largest share in the cast elastomer market

"Asia Pacific was the largest market for cast elastomer in 2023, in terms of value."

Asia Pacific was the largest market for the global cast elastomer market, in terms of value, in 2023. China is the largest market in the Asia Pacific. It is projected to witness the highest growth during the forecast period considering increasing manufacturing activities and the use of cast elastomers in various end use industries like automotive & transportation, mining etc. The major players operating in the Asia Pacific region are  Mitsui  Chemicals, Inc. (Japan), TOSOH Corporation (Japan), Wanhua Chemical Group  Co.,  Ltd. (China). among others.

Cast Elastomer Market by Region

To know about the assumptions considered for the study, download the pdf brochure

Cast Elastomer Market Players

The key players in this market are BASF (Germany), Dow (US), Huntsman Corporation (US), Covestro AG (Germany), Lanxess (Germany), Era Polymers (Australia), Mitsui  Chemicals, Inc. (Japan), Notedome Ltd. (England), TOSOH Corporation (Japan), Wanhua Chemical Group Co., Ltd. (China).

Continuous developments in the market—including new product launches, mergers & acquisitions, agreements, and expansions—are expected to help the market grow. Leading manufacturers of cast elastomers have opted for new product launches to sustain their market position.

Cast Elastomer Market Report Scope

Report Metric

Details

Market Size Value in 2022

USD 1.3 Billion

Revenue Forecast in 2028

USD 1.8 Billion

CAGR

5.0%

Years considered for the study

2019-2028

Base Year

2022

Forecast period

2023-2028

Units considered

Value (USD Billion/Million)

Segments

Type, End-use industry and Region

Regions

Asia Pacific, Europe, North America, Middle East & Africa, and South America

Companies

BASF (Germany), Dow (US), Huntsman Corporation (US), Covestro AG (Germany), Lanxess (Germany), Era Polymers (Australia), Mitsui  Chemicals, Inc. (Japan), Notedome Ltd. (England), TOSOH Corporation (Japan), Wanhua Chemical Group  Co.,  Ltd. (China).

This report categorizes the global cast elastomer market based on type, end-use industry and region.

On the basis of type, the cast elastomer market has been segmented as follows:
  • Hot cast elastomer.
  • Cold cast elastomer.
On the basis of end-use industries, the cast elastomer market has been segmented as follows:
  • Oil & Gas.
  • Industrial.
  • Automotive & Transportation.
  • Mining.
  • Others.
On the basis of region, the cast elastomer market has been segmented as follows:
  • Asia Pacific.
  • Europe.
  • North America.
  • Middle East & Africa.
  • South America.

Recent Developments

  • In October 2022, Wanhua Chemical Group Co., Ltd. has partnered with Agilis (US), a U.S.-based provider of digital commerce solutions for the chemical industry, to launch a branded commerce portal for its TPU (thermoplastic polyurethanes) product portfolio.
  • In July 2022, TOSOH Corporation announced that sA facility for manufacturing unit and separation media will be operational from March 2025 with an increase of 70% production capacity as compared to the current capacity with an investment of approximately 16 billion Yen.
  • In September 2021, Huntsman Corporation plans to launch a “multi-million” dollar expansion project at its Petfurdo, Hungary production facility to boost the site’s capacity for polyurethane catalysts and specialty amines
  • In September 2021, Mitsui Chemicals, Inc. and SKC Co., Ltd. (South Korea) announced plans to dissolve their joint venture agreement for Mitsui Chemicals & SKC Polyurethanes Inc., a subsidiary that combines the two parent companies’ operations in polyurethane raw materials.
  • In July 2021, in the polyurethane and construction chemicals business, Dow plans to increase its propylene glycol (PG) production capacity in Map Ta Phut, Thailand by 80,000 tons per year, bringing the total production capacity to 250,000 tons per year. It is expected to go online in 2024. Dow also recently announced plans to build an integrated MDI distillation and prepolymer facility in Freeport, Texas, USA.
  • In December 2020, BASF completed capacity expansion of its MDI manufacturing facilities at its Louisiana site, Geismar, US. The annual capacity of MDI will be 600,000 metric tons per year. This will further strengthen the company’s position as the leading supplier in North America.

Frequently Asked Questions (FAQ):

To speak to our analyst for a discussion on the above findings, click Speak to Analyst

TABLE OF CONTENTS
 
1 INTRODUCTION (Page No. - 28)
    1.1 STUDY OBJECTIVES 
    1.2 MARKET DEFINITION 
    1.3 INCLUSIONS AND EXCLUSIONS 
    1.4 STUDY SCOPE 
          FIGURE 1 CAST ELASTOMER MARKET SEGMENTATION
           1.4.1 REGIONS COVERED
           1.4.2 YEARS CONSIDERED
    1.5 CURRENCY CONSIDERED 
    1.6 LIMITATIONS 
    1.7 UNITS CONSIDERED 
    1.8 STAKEHOLDERS 
    1.9 SUMMARY OF CHANGES 
 
2 RESEARCH METHODOLOGY (Page No. - 32)
    2.1 RESEARCH DATA 
          FIGURE 2 CAST ELASTOMER MARKET: RESEARCH DESIGN
           2.1.1 SECONDARY DATA
           2.1.2 PRIMARY DATA
                    2.1.2.1 Key data from primary sources
                    2.1.2.2 Breakdown of primary sources
                    2.1.2.3 Key industry insights
    2.2 BASE NUMBER CALCULATION 
           2.2.1 APPROACH 1: SUPPLY-SIDE ANALYSIS
           2.2.2 APPROACH 2: DEMAND-SIDE APPROACH
    2.3 FORECAST NUMBER CALCULATION 
           2.3.1 SUPPLY SIDE
           2.3.2 DEMAND SIDE
    2.4 MARKET SIZE ESTIMATION 
           2.4.1 BOTTOM-UP APPROACH
           2.4.2 TOP-DOWN APPROACH
    2.5 DATA TRIANGULATION 
          FIGURE 3 CAST ELASTOMER MARKET: DATA TRIANGULATION
    2.6 ASSUMPTIONS 
 
3 EXECUTIVE SUMMARY (Page No. - 39)
    FIGURE 4 HOT CAST ELASTOMERS BY TYPE TO DOMINATE CAST ELASTOMER MARKET THROUGHOUT FORECAST PERIOD (USD MILLION)
    FIGURE 5 INDUSTRIAL SECTOR BY END-USE INDUSTRY TO DOMINATE CAST ELASTOMER MARKET THROUGHOUT FORECAST PERIOD (USD MILLION)
    FIGURE 6 ASIA PACIFIC DOMINATED CAST ELASTOMER MARKET IN 2023
 
4 PREMIUM INSIGHTS (Page No. - 43)
    4.1 SIGNIFICANT OPPORTUNITIES IN CAST ELASTOMER MARKET 
          FIGURE 7 INCREASING DEMAND FROM END-USE INDUSTRY DRIVING DEMAND FOR CAST ELASTOMER
    4.2 CAST ELASTOMER MARKET, BY REGION 
          FIGURE 8 ASIA PACIFIC ACCOUNTED FOR LARGEST SHARE OF CAST ELASTOMER MARKET IN 2023
    4.3 CAST ELASTOMER MARKET, BY TYPE 
          FIGURE 9 HOT CAST ELASTOMER TO ACCOUNT FOR FASTEST GROWING TYPE THROUGHOUT FORECAST PERIOD
    4.4 CAST ELASTOMER MARKET, BY END-USE INDUSTRY 
          FIGURE 10 AUTOMOTIVE & TRANSPORTATION TO ACCOUNT FOR FASTEST GROWING END-USE INDUSTRY THROUGHOUT FORECAST PERIOD.
 
5 MARKET OVERVIEW (Page No. - 45)
    5.1 INTRODUCTION 
    5.2 MARKET DYNAMICS 
          FIGURE 11 DRIVERS, RESTRAINTS, OPPORTUNITIES, AND CHALLENGES IN CAST ELASTOMER MARKET
           5.2.1 DRIVERS
                    5.2.1.1 Increasing demand for high-value end-use industries
                    5.2.1.2 Superior advantage over conventional material
                    5.2.1.3 Increasing manufacturing activities in emerging economies
           5.2.2 RESTRAINTS
                    5.2.2.1 Hazardous impact on environment and human health
           5.2.3 OPPORTUNITIES
                    5.2.3.1 Continuous technological advancements
           5.2.4 CHALLENGES
                    5.2.4.1 Compliance with stringent regulations and standards
                    5.2.4.2 Fluctuating raw material prices
 
6 INDUSTRY TRENDS (Page No. - 50)
    6.1 INTRODUCTION 
    6.2 VALUE CHAIN ANALYSIS 
          FIGURE 12 VALUE CHAIN ANALYSIS
           6.2.1 RAW MATERIAL SUPPLIERS
           6.2.2 CAST ELASTOMER MANUFACTURERS
           6.2.3 DISTRIBUTORS
           6.2.4 COMPONENT MANUFACTURERS
           6.2.5 END-USE INDUSTRIES
    6.3 PORTER’S FIVE FORCES ANALYSIS 
          TABLE 1 PORTERS FIVE FORCES IMPACT ON CAST ELASTOMER MARKET
          FIGURE 13 CAST ELASTOMER MARKET: PORTER’S FIVE FORCES ANALYSIS
           6.3.1 THREAT OF NEW ENTRANTS
           6.3.2 THREAT OF SUBSTITUTES
           6.3.3 BARGAINING POWER OF SUPPLIERS
           6.3.4 BARGAINING POWER OF BUYERS
           6.3.5 INTENSITY OF COMPETITIVE RIVALRY
    6.4 MACROECONOMIC OVERVIEW AND KEY TRENDS 
           6.4.1 TRENDS AND FORECAST OF GDP
    6.5 PATENT ANALYSIS 
           6.5.1 INTRODUCTION
           6.5.2 METHODOLOGY
           6.5.3 DOCUMENT TYPE
                    TABLE 3 GRANTED PATENTS ACCOUNT FOR 39.5% OF TOTAL COUNT IN LAST 10 YEARS
                    6.5.3.1 Publication trends over last ten years
                                FIGURE 14 NUMBER OF PATENTS GRANTED IN EACH YEAR OVER LAST 10 YEARS
           6.5.4 INSIGHTS
           6.5.5 LEGAL STATUS OF PATENTS
           6.5.6 JURISDICTION ANALYSIS
                    FIGURE 15 REGIONAL ANALYSIS OF PATENT GRANTED FOR CAST ELASTOMER MARKET, 2023
           6.5.7 TOP COMPANIES/APPLICANTS
                    FIGURE 16 TOP TEN COMPANIES WITH HIGHEST NUMBER OF PATENTS IN LAST TEN YEARS
                    TABLE 4 LIST OF MAJOR PATENTS FOR CAST ELASTOMER
           6.5.8 LIST OF MAJOR PATENTS
                    TABLE 5 MAJOR PATENTS FOR CAST ELASTOMER
 
7 CAST ELASTOMER MARKET, BY TYPE (Page No. - 63)
    7.1 INTRODUCTION 
          FIGURE 17 HOT CAST ELASTOMER SEGMENT TO LEAD CAST ELASTOMER MARKET THROUGHOUT FORECAST PERIOD
          TABLE 6 CAST ELASTOMER MARKET, BY TYPE, 2019–2022 (USD MILLION)
          TABLE 7 CAST ELASTOMER MARKET, BY TYPE, 2023–2028 (USD MILLION)
          TABLE 8 CAST ELASTOMER MARKET, BY TYPE, 2019–2022 (KILOTONS)
          TABLE 9 CAST ELASTOMER MARKET, BY TYPE, 2023–2028 (KILOTONS)
    7.2 HOT CAST ELASTOMER 
           7.2.1 ADOPTING HOT CAST ELASTOMER TO REDUCE CURING TIME
    7.3 COLD CAST ELASTOMER 
           7.3.1 IMPLEMENTATION OF COLD CAST ELASTOMERS TO PRODUCE FLEXIBLE AND DURABLE MATERIALS
 
8 CAST ELASTOMER MARKET, BY APPLICATION (Page No. - 67)
    8.1 INTRODUCTION 
          FIGURE 18 INDUSTRIAL SECTOR TO LEAD CAST ELASTOMER MARKET DURING FORECAST PERIOD
          TABLE 10 CAST ELASTOMER MARKET, BY END-USE INDUSTRY, 2019–2022 (USD MILLION)
          TABLE 11 CAST ELASTOMER MARKET, BY END-USE INDUSTRY, 2023–2028 (USD MILLION)
    8.2 INDUSTRIAL 
           8.2.1 LEADING CONSUMER OF CAST ELASTOMERS
    8.3 AUTOMOTIVE & TRANSPORTATION 
           8.3.1 MANUFACTURING OF LIGHTWEIGHT VEHICLES TO BOOST DEMAND FOR CAST ELASTOMERS
    8.4 MINING 
           8.4.1 RISING NEED OF CAST ELASTOMERS IN MINING FACILITIES TO PROTECT CONVEYOR SYSTEMS TO DRIVE MARKET
    8.5 OIL & GAS 
           8.5.1 BOOMING OIL & GAS SECTOR TO PRESENT OPPORTUNITIES TO PROVIDERS OF CAST ELASTOMERS
    8.6 OTHERS 
 
9 CAST ELASTOMER MARKET, BY REGION (Page No. - 72)
    9.1 INTRODUCTION 
          FIGURE 19 ASIA PACIFIC TO REGISTER HIGHEST GROWTH RATE DURING FORECAST PERIOD
          TABLE 12 CAST ELASTOMER MARKET, BY REGION, 2019–2022 (USD MILLION)
          TABLE 13 CAST ELASTOMER MARKET, BY REGION, 2023–2028 (USD MILLION)
          TABLE 14 CAST ELASTOMER MARKET, BY REGION, 2019–2022 (KILOTONS)
          TABLE 15 CAST ELASTOMER MARKET, BY REGION, 2023–2028 (KILOTONS)
    9.2 ASIA PACIFIC 
          FIGURE 20 ASIA PACIFIC: CAST ELASTOMER MARKET SNAPSHOT
           9.2.1 RECESSION IMPACT
                    TABLE 16 SIA PACIFIC: CAST ELASTOMER MARKET, BY COUNTRY, 2019–2022 (USD MILLION)
                    TABLE 17 ASIA PACIFIC: CAST ELASTOMER MARKET, BY COUNTRY, 2023–2028 (USD MILLION)
                    TABLE 18 ASIA PACIFIC: CAST ELASTOMER MARKET, BY COUNTRY, 2019–2022 (KILOTONS)
                    TABLE 19 ASIA PACIFIC: CAST ELASTOMER MARKET, BY COUNTRY, 2023–2028 (KILOTONS)
                    TABLE 20 ASIA PACIFIC: CAST ELASTOMER MARKET, BY TYPE, 2019–2022 (USD MILLION)
                    TABLE 21 ASIA PACIFIC: CAST ELASTOMER MARKET, BY TYPE, 2023–2028 (USD MILLION)
                    TABLE 22 ASIA PACIFIC: CAST ELASTOMER MARKET, BY TYPE, 2019–2022 (KILOTONS)
                    TABLE 23 ASIA PACIFIC: CAST ELASTOMER MARKET, BY TYPE, 2023–2028 (KILOTONS)
                    TABLE 24 ASIA PACIFIC: CAST ELASTOMER MARKET, BY END-USE INDUSTRY, 2019–2022 (USD MILLION)
                    TABLE 25 ASIA PACIFIC: CAST ELASTOMER MARKET, BY INDUSTRY, 2023–2028 (USD MILLION)
           9.2.2 CHINA
                    9.2.2.1 Rise of automotive sector to boost demand for cast elastomer
                                TABLE 26 CHINA: CAST ELASTOMER MARKET, BY END-USE INDUSTRY, 2019–2022 (USD MILLION)
                                TABLE 27 CHINA: CAST ELASTOMER MARKET, BY END-USE INDUSTRY, 2023–2028 (USD MILLION)
           9.2.3 JAPAN
                    9.2.3.1 Advanced manufacturing techniques to create demand for cast elastomer
                                TABLE 28 JAPAN: CAST ELASTOMER MARKET, BY END-USE INDUSTRY, 2019–2022 (USD MILLION)
                                TABLE 29 JAPAN: CAST ELASTOMER MARKET, BY END-USE INDUSTRY, 2023–2028 (USD MILLION)
           9.2.4 INDIA
                    9.2.4.1 Rapid industrial growth to boost adoption of cast elastomer
                                TABLE 30 INDIA: CAST ELASTOMER MARKET, BY END-USE INDUSTRY, 2019–2022 (USD MILLION)
                                TABLE 31 INDIA: CAST ELASTOMER MARKET, BY END-USE INDUSTRY, 2023–2028 (USD MILLION)
           9.2.5 SOUTH KOREA
                    9.2.5.1 Government initiatives to support demand for cast elastomer in industrial activities
                                TABLE 32 SOUTH KOREA: CAST ELASTOMER MARKET, BY END-USE INDUSTRY, 2019–2022 (USD MILLION)
                                TABLE 33 SOUTH KOREA: CAST ELASTOMER MARKET, BY END-USE INDUSTRY, 2023–2028 (USD MILLION)
           9.2.6 REST OF ASIA PACIFIC
                    TABLE 34 REST OF ASIA PACIFIC: CAST ELASTOMER MARKET, BY END-USE INDUSTRY, 2019–2022 (USD MILLION)
                    TABLE 35 REST OF ASIA PACIFIC: CAST ELASTOMER MARKET, BY END-USE INDUSTRY, 2023–2028 (USD MILLION)
    9.3 EUROPE 
          FIGURE 21 EUROPE: CAST ELASTOMER MARKET SNAPSHOT
           9.3.1 RECESSION IMPACT
                    TABLE 36 EUROPE: CAST ELASTOMER MARKET, BY COUNTRY, 2019–2022 (USD MILLION)
                    TABLE 37 EUROPE: CAST ELASTOMER MARKET, BY COUNTRY, 2023–2028 (USD MILLION)
                    TABLE 38 EUROPE: CAST ELASTOMER MARKET, BY COUNTRY, 2019–2022 (KILOTONS)
                    TABLE 39 EUROPE: CAST ELASTOMER MARKET, BY COUNTRY, 2023–2028 (KILOTONS)
                    TABLE 40 EUROPE: CAST ELASTOMER MARKET, BY TYPE, 2019–2022 (USD MILLION)
                    TABLE 41 EUROPE: CAST ELASTOMER MARKET, BY TYPE, 2023–2028 (USD MILLION)
                    TABLE 42 EUROPE: CAST ELASTOMER MARKET, BY TYPE, 2019–2022 (KILOTONS)
                    TABLE 43 EUROPE: CAST ELASTOMER MARKET, BY TYPE, 2023–2028 (KILOTONS)
                    TABLE 44 EUROPE: CAST ELASTOMER MARKET, BY END-USE INDUSTRY, 2019–2022 (USD MILLION)
                    TABLE 45 EUROPE: CAST ELASTOMER MARKET, BY INDUSTRY, 2023–2028 (USD MILLION)
           9.3.2 GERMANY
                    9.3.2.1 Major automotive and renewable energy industries to drive demand for cast elastomers in Germany
                                TABLE 46 GERMANY: CAST ELASTOMER MARKET, BY END-USE INDUSTRY, 2019–2022 (USD MILLION)
                                TABLE 47 GERMANY: CAST ELASTOMER MARKET, BY END-USE INDUSTRY, 2023–2028 (USD MILLION)
           9.3.3 FRANCE
                    9.3.3.1 Automotive and transportation sectors to contribute significantly to market growth
                                TABLE 48 FRANCE: CAST ELASTOMER MARKET, BY END-USE INDUSTRY, 2019–2022 (USD MILLION)
                                TABLE 49 FRANCE: CAST ELASTOMER MARKET, BY END-USE INDUSTRY, 2023–2028 (USD MILLION)
           9.3.4 ITALY
                    9.3.4.1 Transition toward sustainable energy mix to create opportunities for cast elastomer manufacturers
                                TABLE 50 ITALY: CAST ELASTOMER MARKET, BY END-USE INDUSTRY, 2019–2022 (USD MILLION)
                                TABLE 51 ITALY: CAST ELASTOMER MARKET, BY END-USE INDUSTRY, 2023–2028 (USD MILLION)
           9.3.5 UK
                    9.3.5.1 Technological advancement to exhibit growing demand for cast elastomer
                                TABLE 52 UK: CAST ELASTOMER MARKET, BY END-USE INDUSTRY, 2019–2022 (USD MILLION)
                                TABLE 53 UK: CAST ELASTOMER MARKET, BY END-USE INDUSTRY, 2023–2028 (USD MILLION)
           9.3.6 SPAIN
                    9.3.6.1 Government support in expansion of renewable energy to boost demand for cast elastomer
                                TABLE 54 SPAIN: CAST ELASTOMER MARKET, BY END-USE INDUSTRY, 2019–2022 (USD MILLION)
                                TABLE 55 SPAIN: CAST ELASTOMER MARKET, BY END-USE INDUSTRY, 2023–2028 (USD MILLION)
           9.3.7 RUSSIA
                    9.3.7.1 Industrial development to boost demand for cast elastomers
                                TABLE 56 RUSSIA: CAST ELASTOMER MARKET, BY END-USE INDUSTRY, 2019–2022 (USD MILLION)
                                TABLE 57 RUSSIA: CAST ELASTOMER MARKET, BY END-USE INDUSTRY, 2023–2028 (USD MILLION)
           9.3.8 TURKEY
                    9.3.8.1 Large automotive industry players to increase demand for cast elastomers
                                TABLE 58 TURKEY: CAST ELASTOMER MARKET, BY END-USE INDUSTRY, 2019–2022 (USD MILLION)
                                TABLE 59 TURKEY: CAST ELASTOMER MARKET, BY END-USE INDUSTRY, 2023–2028 (USD MILLION)
           9.3.9 REST OF EUROPE
                    TABLE 60 REST OF EUROPE: CAST ELASTOMER MARKET, BY END-USE INDUSTRY, 2019–2022 (USD MILLION)
                    TABLE 61 REST OF EUROPE: CAST ELASTOMER MARKET, BY END-USE INDUSTRY, 2023–2028 (USD MILLION)
    9.4 NORTH AMERICA 
          FIGURE 22 NORTH AMERICA: CAST ELASTOMER MARKET SNAPSHOT
           9.4.1 RECESSION IMPACT
                    TABLE 62 NORTH AMERICA: CAST ELASTOMER MARKET, BY COUNTRY, 2019–2022 (USD MILLION)
                    TABLE 63 NORTH AMERICA: CAST ELASTOMER MARKET, BY COUNTRY, 2023–2028 (USD MILLION)
                    TABLE 64 NORTH AMERICA: CAST ELASTOMER MARKET, BY COUNTRY, 2019–2022 (KILOTONS)
                    TABLE 65 NORTH AMERICA: CAST ELASTOMER MARKET, BY COUNTRY, 2023–2028 (KILOTONS)
                    TABLE 66 NORTH AMERICA: CAST ELASTOMER MARKET, BY TYPE, 2019–2022 (USD MILLION)
                    TABLE 67 NORTH AMERICA: CAST ELASTOMER MARKET, BY TYPE, 2023–2028 (USD MILLION)
                    TABLE 68 NORTH AMERICA: CAST ELASTOMER MARKET, BY TYPE, 2019–2022 (KILOTONS)
                    TABLE 69 NORTH AMERICA: CAST ELASTOMER MARKET, BY TYPE, 2023–2028 (KILOTONS)
                    TABLE 70 NORTH AMERICA: CAST ELASTOMER MARKET, BY END-USE INDUSTRY, 2019–2022 (USD MILLION)
                    TABLE 71 NORTH AMERICA: CAST ELASTOMER MARKET, BY INDUSTRY, 2023–2028 (USD MILLION)
           9.4.2 US
                    9.4.2.1 Rapid growth of end-use industries to drive demand for cast elastomers
                                TABLE 72 US: CAST ELASTOMER MARKET, BY END-USE INDUSTRY, 2019–2022 (USD MILLION)
                                TABLE 73 US: CAST ELASTOMER MARKET, BY END-USE INDUSTRY, 2023–2028 (USD MILLION)
           9.4.3 CANADA
                    9.4.3.1 Diverse industrial sectors to fuel consumption of cast elastomers
                                TABLE 74 CANADA: CAST ELASTOMER MARKET, BY END-USE INDUSTRY, 2019–2022 (USD MILLION)
                                TABLE 75 CANADA: CAST ELASTOMER MARKET, BY END-USE INDUSTRY, 2023–2028 (USD MILLION)
           9.4.4 MEXICO
                    9.4.4.1 Growing automotive OEM manufacturing to support growth of cast elastomer market
                                TABLE 76 MEXICO: CAST ELASTOMER MARKET, BY END-USE INDUSTRY, 2019–2022 (USD MILLION)
                                TABLE 77 MEXICO: CAST ELASTOMER MARKET, BY END-USE INDUSTRY, 2023–2028 (USD MILLION)
    9.5 SOUTH AMERICA 
          FIGURE 23 SOUTH AMERICA: CAST ELASTOMER MARKET SNAPSHOT
           9.5.1 RECESSION IMPACT
                    TABLE 78 SOUTH AMERICA: CAST ELASTOMER MARKET, BY COUNTRY, 2019–2022 (USD MILLION)
                    TABLE 79 SOUTH AMERICA: CAST ELASTOMER MARKET, BY COUNTRY, 2023–2028 (USD MILLION)
                    TABLE 80 SOUTH AMERICA: CAST ELASTOMER MARKET, BY COUNTRY, 2019–2022 (KILOTONS)
                    TABLE 81 SOUTH AMERICA: CAST ELASTOMER MARKET, BY COUNTRY, 2023–2028 (KILOTONS)
                    TABLE 82 SOUTH AMERICA: CAST ELASTOMER MARKET, BY TYPE, 2019–2022 (USD MILLION)
                    TABLE 83 SOUTH AMERICA: CAST ELASTOMER MARKET, BY TYPE, 2023–2028 (USD MILLION)
                    TABLE 84 SOUTH AMERICA: CAST ELASTOMER MARKET, BY TYPE, 2019–2022 (KILOTONS)
                    TABLE 85 SOUTH AMERICA: CAST ELASTOMER MARKET, BY TYPE, 2023–2028 (KILOTONS)
                    TABLE 86 SOUTH AMERICA: CAST ELASTOMER MARKET, BY END-USE INDUSTRY, 2019–2022 (USD MILLION)
                    TABLE 87 SOUTH AMERICA: CAST ELASTOMER MARKET, BY INDUSTRY, 2023–2028 (USD MILLION)
           9.5.2 BRAZIL
                    9.5.2.1 Rising energy sector and mining industry to fuel growing demand for cast elastomers
                                TABLE 88 BRAZIL: CAST ELASTOMER MARKET, BY END-USE INDUSTRY, 2019–2022 (USD MILLION)
                                TABLE 89 BRAZIL: CAST ELASTOMER MARKET, BY END-USE INDUSTRY, 2023–2028 (USD MILLION)
           9.5.3 ARGENTINA
                    9.5.3.1 Growing renewable energy industry to boost demand for cast elastomers
                                TABLE 90 ARGENTINA: CAST ELASTOMER MARKET, BY END-USE INDUSTRY, 2019–2022 (USD MILLION)
                                TABLE 91 ARGENTINA: CAST ELASTOMER MARKET, BY END-USE INDUSTRY, 2023–2028 (USD MILLION)
           9.5.4 REST OF SOUTH AMERICA
                    TABLE 92 REST OF SOUTH AMERICA: CAST ELASTOMER MARKET, BY END-USE INDUSTRY, 2019–2022 (USD MILLION)
                    TABLE 93 REST OF SOUTH AMERICA: CAST ELASTOMER MARKET, BY END-USE INDUSTRY, 2023–2028 (USD MILLION)
    9.6 MIDDLE EAST AND AFRICA 
          FIGURE 24 MIDDLE EAST & AFRICA: CAST ELASTOMER MARKET SNAPSHOT
           9.6.1 RECESSION IMPACT
                    TABLE 94 MIDDLE EAST & AFRICA: CAST ELASTOMER MARKET, BY COUNTRY, 2019–2022 (USD MILLION)
                    TABLE 95 MIDDLE EAST & AFRICA: CAST ELASTOMER MARKET, BY COUNTRY, 2023–2028 (USD MILLION)
                    TABLE 96 MIDDLE EAST & AFRICA: CAST ELASTOMER MARKET, BY COUNTRY, 2019–2022 (KILOTONS)
                    TABLE 97 MIDDLE EAST & AFRICA: CAST ELASTOMER MARKET, BY COUNTRY, 2023–2028 (KILOTONS)
                    TABLE 98 MIDDLE EAST & AFRICA: CAST ELASTOMER MARKET, BY TYPE, 2019–2022 (USD MILLION)
                    TABLE 99 MIDDLE EAST & AFRICA: CAST ELASTOMER MARKET, BY TYPE, 2023–2028 (USD MILLION)
                    TABLE 100 MIDDLE EAST & AFRICA: CAST ELASTOMER MARKET, BY TYPE, 2019–2022 (KILOTONS)
                    TABLE 101 MIDDLE EAST & AFRICA: CAST ELASTOMER MARKET, BY TYPE, 2023–2028 (KILOTONS)
                    TABLE 102 MIDDLE EAST & AFRICA: CAST ELASTOMER MARKET, BY END-USE INDUSTRY, 2019–2022 (USD MILLION)
                    TABLE 103 MIDDLE EAST & AFRICA: CAST ELASTOMER MARKET, BY INDUSTRY, 2023–2028 (USD MILLION)
           9.6.2 SAUDI ARABIA
                    9.6.2.1 Oil & gas contributes to significant rise in demand for cast elastomers
                                TABLE 104 SAUDI ARABIA: CAST ELASTOMER MARKET, BY END-USE INDUSTRY, 2019–2022 (USD MILLION)
                                TABLE 105 SAUDI ARABIA: CAST ELASTOMER MARKET, BY END-USE INDUSTRY, 2023–2028 (USD MILLION)
           9.6.3 SOUTH AFRICA
                    9.6.3.1 Growth in manufacturing industry to drive demand for cast elastomers
                                TABLE 106 SOUTH AFRICA: CAST ELASTOMER MARKET, BY END-USE INDUSTRY, 2019–2022 (USD MILLION)
                                TABLE 107 SOUTH AFRICA: CAST ELASTOMER MARKET, BY END-USE INDUSTRY, 2023–2028 (USD MILLION)
           9.6.4 IRAN
                    9.6.4.1 Rising petrochemical industry to boost adoption of cast elastomer
                                TABLE 108 IRAN: CAST ELASTOMER MARKET, BY END-USE INDUSTRY, 2019–2022 (USD MILLION)
                                TABLE 109 IRAN: CAST ELASTOMER MARKET, BY END-USE INDUSTRY, 2023–2028 (USD MILLION)
           9.6.5 REST OF MIDDLE EAST & AFRICA
                    TABLE 110 REST OF MIDDLE EAST & AFRICA: CAST ELASTOMER MARKET, BY END-USE INDUSTRY, 2019–2022 (USD MILLION)
                    TABLE 111 REST OF MIDDLE EAST & AFRICA: CAST ELASTOMER MARKET, BY END-USE INDUSTRY, 2023–2028 (USD MILLION)
 
10 COMPETITIVE LANDSCAPE (Page No. - 121)
     10.1 INTRODUCTION 
     10.2 STRATEGIES ADOPTED BY KEY PLAYERS 
             TABLE 112 OVERVIEW OF STRATEGIES ADOPTED BY KEY CAST ELASTOMER MANUFACTURERS
     10.3 MARKET SHARE ANALYSIS 
             10.3.1 RANKING OF KEY MARKET PLAYERS, 2022
                        FIGURE 25 RANKING OF TOP 5 PLAYERS IN CAST ELASTOMER MARKET, 2022
             10.3.2 MARKET SHARE OF KEY PLAYERS
                        TABLE 113 CAST ELASTOMER: DEGREE OF COMPETITION
                        FIGURE 26 CAST ELASTOMER MARKET: SHARE OF KEY PLAYERS
     10.4 COMPANY FOOTPRINT ANALYSIS 
             TABLE 114 COMPANY FOOTPRINT: APPLICATION
             TABLE 115 COMPANY FOOTPRINT: TYPE
             TABLE 116 COMPANY FOOTPRINT: REGION
     10.5 COMPANY EVALUATION MATRIX 
             10.5.1 STARS
             10.5.2 EMERGING LEADERS
             10.5.3 PERVASIVE PLAYERS
             10.5.4 PARTICIPANTS
                        FIGURE 27 CAST ELASTOMER MARKET (GLOBAL): COMPETITIVE EVALUATION MATRIX, 2022
     10.6 COMPETITIVE BENCHMARKING 
             TABLE 117 CAST ELASTOMER SEPARATORS MARKET: DETAILED LIST OF KEY START-UPS/SMES
             TABLE 118 CAST ELASTOMER MARKET: SME PLAYERS APPLICATION FOOTPRINT
             TABLE 119 CAST ELASTOMER MARKET: SME PLAYERS TYPE FOOTPRINT
             TABLE 120 CAST ELASTOMER MARKET: SME PLAYERS REGION FOOTPRINT
     10.7 START-UP/SME EVALUATION MATRIX 
             10.7.1 RESPONSIVE COMPANIES
             10.7.2 STARTING BLOCKS
             10.7.3 PROGRESSIVE COMPANIES
             10.7.4 DYNAMIC COMPANIES
                        FIGURE 28 CAST ELASTOMER MARKET: START-UPS/SMES EVALUATION MATRIX
     10.8 COMPETITIVE SITUATIONS AND TRENDS 
             10.8.1 NEW PRODUCT LAUNCHES
                        TABLE 121 CAST ELASTOMER MARKET: NEW PRODUCT LAUNCHES (2020–2023)
             10.8.2 DEALS
                        TABLE 122 CAST ELASTOMER MARKET: DEALS (2017–2023)
             10.8.3 OTHER DEVELOPMENTS
                        TABLE 123 CAST ELASTOMER MARKET: OTHER DEVELOPMENTS (2016–2023)
 
11 COMPANY PROFILES (Page No. - 138)
(Business Overview, Products/Solutions/Services offered, Recent Developments, Deals, MnM view, Right to win, Strategic choices, Weakness and competitive threats) *
     11.1 KEY PLAYERS 
             11.1.1 BASF
                        TABLE 124 BASF: COMPANY OVERVIEW
                        FIGURE 29 BASF: COMPANY SNAPSHOT
                        TABLE 125 BASF: PRODUCT OFFERINGS
                        TABLE 126 BASF: OTHER
             11.1.2 DOW
                        TABLE 127 DOW: COMPANY OVERVIEW
                        FIGURE 30 DOW: COMPANY SNAPSHOT
                        TABLE 128 DOW: PRODUCT OFFERINGS
                        TABLE 129 DOW: DEALS
                        TABLE 130 DOW: OTHER
             11.1.3 HUNTSMAN CORPORATION
                        TABLE 131 HUNTSMAN CORPORATION: COMPANY OVERVIEW
                        FIGURE 31 HUNTSMAN CORPORATION: COMPANY SNAPSHOT
                        TABLE 132 HUNTSMAN CORPORATION: PRODUCT OFFERINGS
                        TABLE 133 HUNTSMAN CORPORATION: DEALS
                        TABLE 134 HUNTSMAN CORPORATION: OTHER DEVELOPMENTS
             11.1.4 COVESTRO AG
                        TABLE 135 COVESTRO AG: COMPANY OVERVIEW
                        FIGURE 32 COVESTRO AG: COMPANY SNAPSHOT
                        TABLE 136 COVESTRO AG: PRODUCT OFFERINGS
                        TABLE 137 COVESTRO AG: PRODUCT LAUNCH
             11.1.5 LANXESS
                        TABLE 138 LANXESS: COMPANY OVERVIEW
                        FIGURE 33 LANXESS: COMPANY SNAPSHOT
                        TABLE 139 LANXESS: PRODUCT OFFERINGS
                        TABLE 140 LANXESS: PRODUCT LAUNCH
                        TABLE 141 LANXESS: DEALS
                        TABLE 142 LANXESS: OTHER DEVELOPMENTS
             11.1.6 ERA POLYMERS
                        TABLE 143 ERA POLYMERS: COMPANY OVERVIEW
                        TABLE 144 ERA POLYMERS: PRODUCT OFFERINGS
             11.1.7 MITSUI CHEMICALS, INC.
                        TABLE 145 MITSUI CHEMICALS, INC.: COMPANY OVERVIEW
                        FIGURE 34 MITSUI CHEMICALS, INC.: COMPANY SNAPSHOT
                        TABLE 146 MITSUI CHEMICALS INC.: PRODUCT OFFERINGS
                        TABLE 147 MITSUI CHEMICALS, INC.: DEALS
                        TABLE 148 MITSUI CHEMICALS, INC.: OTHER
             11.1.8 NOTEDOME LTD.
                        TABLE 149 NOTEDOME LTD.: COMPANY OVERVIEW
                        FIGURE 35 NOTEDOME LTD.: COMPANY SNAPSHOT
                        TABLE 150 NOTEDOME LTD.: PRODUCT OFFERINGS
             11.1.9 TOSOH CORPORATION
                        TABLE 151 TOSOH CORPORATION: COMPANY OVERVIEW
                        FIGURE 36 TOSOH CORPORATION: COMPANY SNAPSHOT
                        TABLE 152 TOSOH CORPORATION: PRODUCT OFFERINGS
                        TABLE 153 TOSOH CORPORATION: OTHER
             11.1.10 WANHUA CHEMICAL GROUP CO., LTD.
                        TABLE 154 WANHUA CHEMICAL GROUP CO., LTD.: COMPANY OVERVIEW
                        FIGURE 37 WANHUA CHEMICAL GROUP CO., LTD.: COMPANY SNAPSHOT
                        TABLE 155 WANHUA CHEMICAL GROUP CO., LTD.: PRODUCT OFFERINGS
                        TABLE 156 WANHUA CHEMICAL GROUP CO., LTD.: DEALS
                        TABLE 157 WANHUA CHEMICAL GROUP CO., LTD.: OTHER
*Details on Business Overview, Products/Solutions/Services offered, Recent Developments, Deals, MnM view, Right to win, Strategic choices, Weakness and competitive threats might not be captured in case of unlisted companies.
     11.2 OTHER PLAYERS 
             11.2.1 ALCHIMICA S.A.
                        TABLE 158 ALCHIMICA S.A. : COMPANY OVERVIEW
             11.2.2 CARLISLE POLYURETHANE SYSTEMS
                        TABLE 159 CARLISLE POLYURETHANE SYSTEMS: COMPANY OVERVIEW
             11.2.3 CHEMLINE, INC.
                        TABLE 160 CHEMLINE, INC.: COMPANY OVERVIEW
             11.2.4 COIM GROUP
                        TABLE 161 COIM GROUP: COMPANY OVERVIEW
             11.2.5 HERIKON B.V.
                        TABLE 162 HERIKON B.V.: COMPANY OVERVIEW
             11.2.6 JAYANTILAL J. GANDHI CHEMICALS PVT. LTD.
                        TABLE 163 JAYANTILAL J. GANDHI CHEMICALS PVT. LTD.: COMPANY OVERVIEW
             11.2.7 LUC GROUP
                        TABLE 164 LUC GROUP: COMPANY OVERVIEW
             11.2.8 POLYCOAT PRODUCTS
                        TABLE 165 POLYCOAT PRODUCTS: COMPANY OVERVIEW
             11.2.9 RECKLI
                        TABLE 166 RECKLI: COMPANY OVERVIEW
             11.2.10 SAPICI S.P.A.
                        TABLE 167 SAPICI S.P.A. : COMPANY OVERVIEW
             11.2.11 SIKA ADVANCED RESINS
                        TABLE 168 SIKA ADVANCED RESINS: COMPANY OVERVIEW
             11.2.12 SYNTHESIA TECHNOLOGY GROUP
                        TABLE 169 SYNTHESIS TECHNOLOGY GROUP: COMPANY OVERVIEW
             11.2.13 TAIWAN PU CORPORATION
                        TABLE 170 TAIWAN PU CORPORATION: COMPANY OVERVIEW
             11.2.14 TSE INDUSTRIES
                        TABLE 171 TSE INDUSTRIES: COMPANY OVERVIEW
             11.2.15 VCM POLYURETHANES
                        TABLE 172 VCM POLYURETHANES: COMPANY OVERVIEW
 
12 APPENDIX (Page No. - 178)
     12.1 INSIGHTS OF INDUSTRY EXPERTS 
     12.2 DISCUSSION GUIDE 
     12.3 KNOWLEDGESTORE: MARKETSANDMARKETS’ SUBSCRIPTION PORTAL 
     12.4 CUSTOMIZATION OPTIONS 
     12.5 RELATED REPORTS 
     12.6 AUTHOR DETAILS 

The study involved four major activities in estimating the market size of the cast elastomer market. Exhaustive secondary research was done to collect information on the market, the peer market, and the parent market. The next step was to validate these findings, assumptions, and sizing with industry experts across the value chain through primary research. Both top-down and bottom-up approaches were employed to estimate the complete market size. Thereafter, the market breakdown and data triangulation procedures were used to estimate the market size of the segments and subsegments.

Secondary Research

In the secondary research process, various secondary sources have been referred to for identifying and collecting information for this study. These secondary sources include annual reports, press releases, investor presentations of companies, white papers, certified publications, trade directories, articles from recognized authors, the gold standard and silver standard websites, and databases.

Secondary research has been used to obtain key information about the value chain of the industry, the monetary chain of the market, the total pool of key players, market classification, and segmentation according to industry trends to the bottom-most level and regional markets. It was also used to obtain information about the key developments from a market-oriented perspective.

Primary Research

The cast elastomer market comprises several stakeholders in the value chain, which include raw material supplier, cast elastomer manufacturers, distributors , component manufacturers & end users. Various primary sources from the supply and demand sides of the cast elastomer market have been interviewed to obtain qualitative and quantitative information. The primary interviewees from the demand side include key opinion leaders in end-use sectors. The primary sources from the supply side include manufacturers, associations, and institutions involved in the cast elastomer industry.

Primary interviews were conducted to gather insights such as market statistics, data of revenue collected from the products and services, market breakdowns, market size estimations, market forecasting, and data triangulation. Primary research also helped in understanding the various trends related to type, end-use industry and region. Stakeholders from the demand side, such as CIOs, CTOs, and CSOs were interviewed to understand the buyer’s perspective on the suppliers, products, component providers, and their current usage of cast elastomer and the future outlook of their business, which will affect the overall market.

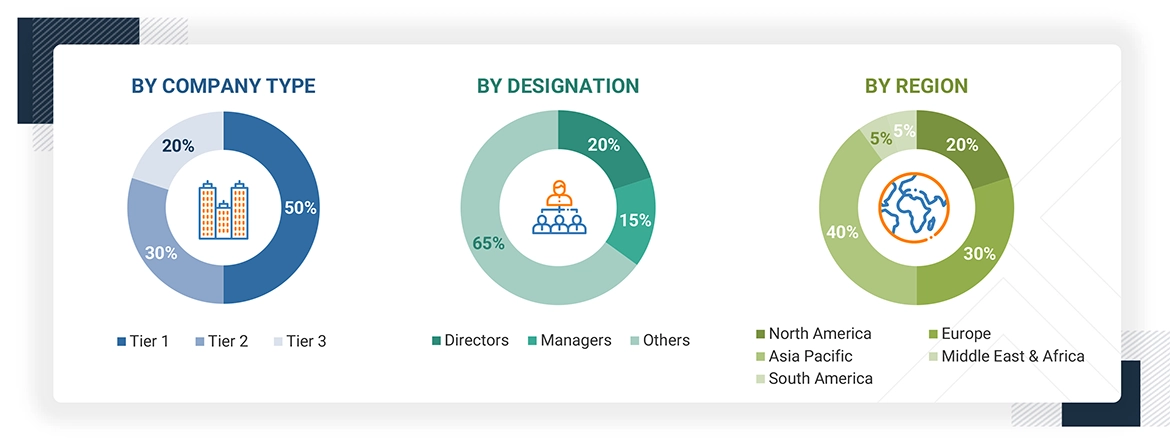
The breakdown of profiles of the primary interviewees is illustrated in the figure below:
Cast Elastomer Market Size, and Share

Note: Tier 1, Tier 2, and Tier 3 companies are classified based on their market revenue in 2023 available in the public domain, product portfolios, and geographical presence.

Other designations include consultants and sales, marketing, and procurement managers.

To know about the assumptions considered for the study, download the pdf brochure

Company Name

Designation

BASF (Germany)

Individual Industry Expert

Dow (US)

Sales Manager

 Huntsman Corporation (US)

Director

Covestro AG (Germany)

Marketing Manager

Era Polymers (Australia)

R&D Manager


Market Size Estimation

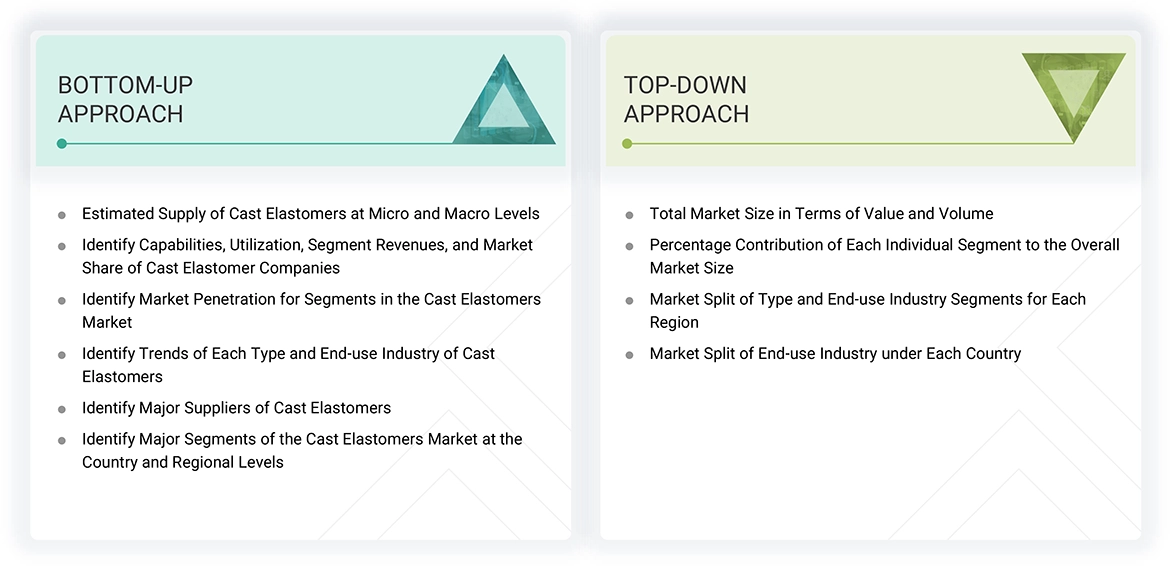
The top-down and bottom-up approaches have been used to estimate and validate the size of the cast elastomer market.

  • The key players in the industry have been identified through extensive secondary research.
  • The industry's supply chain has been determined through primary and secondary research.
  • All percentage shares, splits, and breakdowns have been determined using secondary sources and verified through primary sources.
  • All possible parameters that affect the markets covered in this research study have been accounted for, viewed in extensive detail, verified through primary research, and analyzed to obtain the final quantitative and qualitative data.
  • The research includes the study of reports, reviews, and newsletters of the key market players, along with extensive interviews for opinions with leaders such as directors and marketing executives.

Cast Elastomer Market: Bottum-Up Approach

Cast Elastomer Market Size, and Share

Note: All the shares are based on the global market size.

Source: Secondary Research, Interviews with Experts, and MarketsandMarkets Analysis

To know about the assumptions considered for the study, Request for Free Sample Report

Cast Elastomer  Market: Top-Down Approach

Cast Elastomer Market Size, and Share

Data Triangulation

After arriving at the total market size from the estimation process explained above, the overall market has been split into several segments and sub-segments. To complete the overall market engineering process and arrive at the exact statistics for all the segments and sub-segments, the data triangulation and market breakdown procedures have been employed, wherever applicable. The data has been triangulated by studying various factors and trends from both the demand and supply sides. Along with this, the market size has been validated by using both the top-down and bottom-up approaches and primary interviews. Hence, for every data segment, there have been three sources—top-down approach, bottom-up approach, and expert interviews. The data was assumed correct when the values arrived from the three sources matched.

Market Definition

Cast elastomers are polyurethane-based systems prepared by reacting isocyanates, polyols, and chain extenders. These polymeric elastomers bridge the gap between elastomers and plastics by offering the performance benefits of engineering plastics, ceramics, and metals, as well as flexibility and resiliency of conventional elastomers. They are cost-effective but cannot be melted and reformed. These materials are durable and frequently used for casting processes in end-use industries such as mining, oil & gas, industrial, agricultural & food processing, sports, and automotive.

Key Stakeholders

  • Cast elastomer manufacturers
  • Raw material suppliers
  • Cast elastomer components manufacturers
  • End-use companies, cast elastomer companies
  • Cast elastomer traders, distributors, and suppliers
  • Research organizations
  • Industry associations
  • Governments and research organizations

Report Objectives

  • To define, describe, and forecast the size of the cast elastomer market, in terms of value and volume.
  • To provide detailed information regarding the major factors (drivers, opportunities, restraints, and challenges) influencing the growth of the market.
  • To estimate and forecast the market size based on type, end-use industry and region.
  • To forecast the size of the market with respect to major regions, namely, Europe, North America, Asia Pacific, Middle East & Africa, and South America, along with their key countries.
  • To strategically analyze micromarkets1 with respect to individual growth trends, prospects, and their contribution to the overall market.
  • To analyze opportunities in the market for stakeholders and provide a competitive landscape of market leaders.
  • To track and analyze recent developments such as expansions, new product launches, partnerships & agreements, and acquisitions in the market.
  • To strategically profile key market players and comprehensively analyze their core competencies.

Available Customizations

Along with the given market data, MarketsandMarkets offers customizations according to the company’s specific needs. The following customization options are available for the report:

Regional Analysis

  • Further breakdown of a region with respect to a particular country or additional application

Company Information

  • Detailed analysis and profiles of additional market players
Custom Market Research Services

We will customize the research for you, in case the report listed above does not meet with your exact requirements. Our custom research will comprehensively cover the business information you require to help you arrive at strategic and profitable business decisions.

Request Customization

Instant Answers with GPT - Ask Now!

Ask real questions. Get complete answers !
Report Code
CH 6406
Published ON
Jul, 2023
Choose License Type
BUY NOW
  • SHARE
X
Request Customization
Speak to Analyst
Speak to Analyst
OR FACE-TO-FACE MEETING
PERSONALIZE THIS RESEARCH
  • Triangulate with your Own Data
  • Get Data as per your Format and Definition
  • Gain a Deeper Dive on a Specific Application, Geography, Customer or Competitor
  • Any level of Personalization
REQUEST A FREE CUSTOMIZATION
LET US HELP YOU!
  • What are the Known and Unknown Adjacencies Impacting the Cast Elastomer Market
  • What will your New Revenue Sources be?
  • Who will be your Top Customer; what will make them switch?
  • Defend your Market Share or Win Competitors
  • Get a Scorecard for Target Partners
CUSTOMIZED WORKSHOP REQUEST
  • Call Us
  • +1-888-600-6441 (Corporate office hours)
  • +1-888-600-6441 (US/Can toll free)
  • +44-800-368-9399 (UK office hours)
CONNECT WITH US
ABOUT TRUST ONLINE
©2024 MarketsandMarkets Research Private Ltd. All rights reserved
DMCA.com Protection Status Website Feedback