Ceramic Textile Market by Fiber Type (RCF, Low Bio-Persistent, and Polycrystalline), Form (Cloth, Ropes, Tapes, Sleeving, and Braids), End-Use Industry (Industrial and Transportation), and Region - Global Forecast to 2021


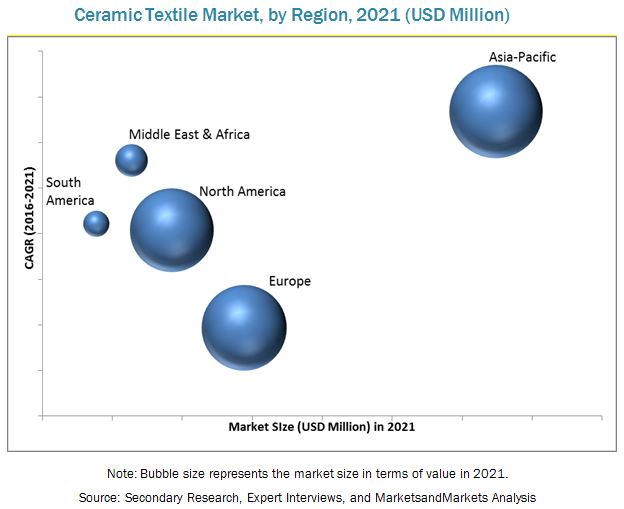
[160 Pages Report] The global ceramic textile market is projected USD 132.5 Million by 2021 from USD 74.5 Million in 2015, and is projected to register a CAGR of 9.94% in terms of value, between 2016 and 2021. High heat resistance capability of ceramic fibers in high temperature applications would drive the market. Emerging application industries, such as aerospace and alternate energy, would boost the ceramic textile market.
Objectives of the Study
- To define, describe, and forecast the ceramic textile market on the basis of type, form, end-use industry, and region
- To forecast the ceramic textile market size with respect to five main regions, namely, North America, Europe, Asia-Pacific, the Middle East & Africa, and South America
- To provide detailed information regarding the major factors (drivers, restraints, opportunities, and industry-specific challenges) influencing the growth of the market
- To analyze the opportunities in the market for stakeholders and details of the competitive landscape for market leaders
- To analyze competitive developments such as new product developments, expansions, acquisitions, joint ventures, mergers, and R&D in the ceramic textile market
- To profile key players and comprehensively analyze their market shares and core competencies
Years considered for this report
2014 � Historical Year
2015 � Base Year
2016 � Estimated Year
2021 � Projected Year
Research Methodology
This study aims to estimate the market size for ceramic textiles for 2016 and forecast it to 2021. It provides a detailed qualitative and quantitative analysis of the market. Various secondary sources, such as directories, industry journals, and databases, have been used to identify and collect information useful for an extensive commercial study of the ceramic textile market. Primary sources such as experts from related industries and suppliers have been interviewed to obtain and verify critical information and assess prospects of the ceramic textile market.
To know about the assumptions considered for the study, download the pdf brochure
The ceramic textile value chain includes ceramic fiber manufacturers such as Morgan Thermal Ceramics (U.K.), Unifrax Ltd. (U.S), Shandong Luyang Share Co. Ltd. (China), and Isolite Insulating Products (Japan) and ceramic textile distributors such as Morgan Thermal Ceramics (U.K.) and Unifrax Ltd. (U.S).
Target Audiences:
- Ceramic fiber manufacturers
- Ceramic textiles formulators
- Raw material suppliers
- Manufacturing technology providers
- Industry associations
- Manufacturers in end-use industries
�The study answers several questions for stakeholders, primarily which market segments to focus on in the next two to five years for prioritizing efforts and investments and the competitive landscape of the market�.
Scope of the Report:
The ceramic textile market is segmented as follows:
On the basis of Fiber Type:
- RCF
- Low bio-persistent
- Polycrystalline ceramic fibers
On the basis of Form
- Cloth
- Ropes
- Tapes
- Sleeving
- Braids
On the basis of End-Use Industry:
- Transportation
- Industrial
On the basis of Region:
- Asia-Pacific
- Europe
- North America
- Middle East & Africa
- South America
The market is further analyzed according to key countries in each of these regions.
Available Customizations
With the given market data, MarketsandMarkets offers customizations as per the company�s specific needs. The following customization options are available for this report:
Product Analysis
- A product matrix that provides a detailed comparison of the product portfolios of each company
Regional Analysis
- Further breakdown of the ceramic textile market in the rest of Asia-Pacific into Australia, New Zealand, and others
The global ceramic textile market size was USD 74.5 Million in 2015 and is projected to register a CAGR of 9.94% in terms of value, between 2016 and 2021. Properties of ceramics to contaminate heat in high temperature applications would drive the market. High number of emerging application industries, such as aerospace and alternate energy, would boost the ceramic textile market.
Refractory ceramic fiber (RCF) is the largest segment of the ceramic textile market. RCF is a versatile material. It can be spun or blown into bulk, air-laid into a blanket, folded into modules, converted into papers, boards, and shapes, die-cut into gaskets, twisted into yarns, woven into rope and cloth, and blended into liquid binders for mastics and cements. It is lightweight and has low thermal conductivities, excellent resistance to thermal shock, outstanding electrical resistivity, excellent insulating properties, superior corrosion resistance, and good acoustical properties.
The ceramic textile market is dominated by the industrial end-use industry. It would also grow with the highest CAGR during the forecast period. This is mainly due to the growing petrochemical, steel, and aluminum end-use industries in the global market. High demand for end products from industries such as iron & steel, aluminum, petrochemicals, and others are driving the production of ceramic fibers.
Ceramic cloth is the largest market in the form segment of ceramic textiles. Properties of ceramic cloth such as insulation, good performance at low temperatures, and heat insulation contribute to its large market size. It has wide applications such as welding foundry works, aluminum and steel mills, boiler insulation and seal, shipyards, refineries, power plants, and chemical plants. Braids would be the fastest-growing segment in the market. The characteristics of braids such as maximum resistance to mechanical abuse, superior strength, minimal unraveling would trigger the growth of the segment.
Asia-Pacific is the largest and fastest-growing market for ceramic textiles. Infrastructural growth in Asia-Pacific and increasing industrialization are responsible for the same. Most of the emerging economies are also situated in this region. Moreover, large transportation projects are increasing in this region to cater the needs of growing population.
Ceramic textiles are carcinogenic in nature and they have durability issues. These factors impose restraints on the growth of the market.
Ibiden Co. Ltd. (Japan), Luyang Energy-Saving Materials Co., Ltd. (China), Isolite Insulating Products Co., Ltd. (Japan), Kyocera Corporation (Japan), Mineral Seal Corporation (U.S.), Morgan Advanced Materials Corporation (U.K.), Rath Inc. (U.S.), Rauschert Steinbach GmbH (Germany), The 3M Company (U.S.), Unifrax Corporation (U.S.), and Zircar Zirconia, Inc. (U.S.) are some of the key players that are actively present in the ceramic textile market. They have majorly focused on new product launches and expansions to grow in the market.
To speak to our analyst for a discussion on the above findings, click Speak to Analyst
 Exclusive indicates content/data unique to MarketsandMarkets and not available with any competitors.
Table of Contents
1 Introduction (Page No. - 16)
1.1 Objectives of the Study
1.2 Market Definition
1.3 Market Scope
1.3.1 Markets Covered
1.3.2 Years Considered for the Study
1.4 Limitations
1.5 Stakeholders
2 Research Methodology (Page No. - 19)
2.1 Research Data
2.1.1 Secondary Data
2.1.1.1 Key Data From Secondary Sources
2.1.2 Primary Data
2.1.2.1 Key Data From Primary Sources
2.1.2.2 Key Industry Insights
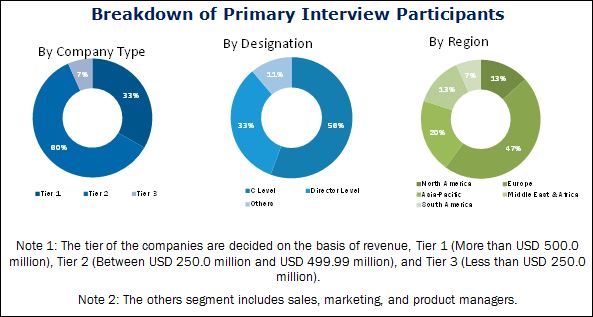
2.1.2.3 Breakdown of Primary Interviews
2.2 Market Size Estimation
2.2.1 Bottom-Up Approach
2.2.2 Top-Down Approach
2.3 Ceramic Textiles: Data Triangulation
2.4 Research Assumptions
3 Executive Summary (Page No. - 27)
4 Premium Insights (Page No. - 32)
4.1 Ceramic Textiles Market in Asia-Pacific, By Type and Country
4.2 Asia-Pacific Dominates the Ceramic Textiles Market
4.3 Ceramic Textiles Market, By Leading Countries, 2016-2021 (Ton)
5 Market Overview (Page No. - 35)
5.1 Introduction
5.2 Ceramic Fibers Used as Insulation Material in High Temperature Applications
5.3 Market Segmentation
5.3.1 By Fiber Type
5.3.2 By Form Type
5.3.3 By End-Use Industry
5.4 Market Dynamics
5.4.1 Drivers
5.4.1.1 High Heat Resistance Capability of Ceramic Fiber in High Temperature Applications
5.4.1.2 Growth of End-Use Industries
5.4.2 Restraints
5.4.2.1 Carcinogenic Nature of RCF
5.4.3 Opportunities
5.4.3.1 Emerging Applications in Aerospace and Alternative Energy for Ceramic Textiles
5.4.4 Challenges
5.4.4.1 Huge Dependence on the Exports of Iron & Steel Industry in China
5.4.4.2 Durability Issues
6 Industry Trends (Page No. - 42)
6.1 Introduction
6.2 Value Chain Analysis
6.2.1 Raw Material
6.2.2 Ceramic Fiber Manufacturers
6.2.3 Ceramic Textiles Formulators
6.2.4 Distribution Network
6.3 Price Analysis
6.3.1 Factors Affecting the Price of Ceramic Textiles
6.3.1.1 Raw Material/Feedstock
6.3.1.2 Labor Cost
6.3.1.3 Currency Exchange Rate
6.3.2 Prices Variation - Ceramic Textile Products
6.4 Porter�s Five Forces Analysis
6.4.1 Threat From New Entrants
6.4.2 Bargaining Power of Suppliers
6.4.3 Threat of Substitutes
6.4.4 Bargaining Power of Buyers
6.4.5 Intensity of Competitive Rivalry
6.5 Recent Ceramic Textile Patents (2012�2016)
7 Ceramic Textiles Market, By Fiber Type (Page No. - 50)
7.1 Introduction
7.2 Classification of Ceramic Fiber
7.2.1 Vitreous Alumina-Silica Ceramic Fiber
7.2.1.1 Refractory Ceramic Fiber (RCF)
7.2.1.2 Low Bio-Persistence Ceramic Fiber
7.2.2 Polycrystalline Ceramic Fiber
8 Ceramic Textile Market, By Form Type (Page No. - 62)
8.1 Introduction
8.2 Cloth
8.3 Ropes
8.4 Tapes
8.5 Sleeving
8.6 Braids
8.7 Others
9 Ceramic Textiles Market, By End-Use Industry (Page No. - 74)
9.1 Introduction
9.2 Industrial
9.2.1 Petrochemicals
9.2.2 Iron & Steel
9.2.3 Aluminium
9.2.4 Power Generation
9.2.5 Others
9.3 Transportation
9.3.1 Aerospace
9.3.2 Automotive and Marine
10 Ceramic Textiles Market, By Region (Page No. - 81)
10.1 Introduction
10.2 North America
10.2.1 Overview
10.2.2 U.S.
10.2.3 Canada
10.2.4 Mexico
10.3 Europe
10.3.1 Overview
10.3.2 Germany
10.3.3 France
10.3.4 U.K.
10.3.5 Italy
10.3.6 Russia
10.3.7 Turkey
10.3.8 Rest of Europe
10.4 Asia-Pacific
10.4.1 Overview
10.4.2 China
10.4.3 Japan
10.4.4 South Korea
10.4.5 India
10.4.6 Indonesia
10.4.7 Thailand
10.4.8 Vietnam
10.4.9 Rest of Asia-Pacific
10.5 Middle East & Africa
10.5.1 Overview
10.5.2 Saudi Arabia
10.5.3 UAE
10.5.4 South Africa
10.5.5 Rest of Middle East & Africa
10.6 South America
10.6.1 Brazil
10.6.2 Rest of South America
11 Competitive Landscape (Page No. - 128)
11.1 Overview
11.2 Market Share Analysis
11.3 Competitive Situation and Trends
11.4 Competitive Benchmarking and Landscape
11.4.1 New Product Launch
11.4.2 Merger & Acquisition
12 Company Profile (Page No. - 133)
(Overview, Financial*, Products & Services, Strategy, and Developments)
12.1 Morgan Advanced Materials Corporation
12.2 Kyocera Corporation
12.3 Ibiden Co. Ltd.
12.4 Isolite Insulating Products Co. Ltd.
12.5 3M Company
12.6 Rath Inc.
12.7 Unifrax Corporation
12.8 Luyang Energy-Saving Materials Co. Ltd.
12.9 Mineral Seal Corporation
12.10 Rauschert Steinbach GmbH
12.11 Zircar Zirconia, Inc.
12.12 Other Key Players
*Details Might Not Be Captured in Case of Unlisted Companies.
13 Appendix (Page No. - 154)
13.1 Insights From Industry Experts
13.2 Discussion Guide
13.3 Introducing RT: Real-Time Market Intelligence
13.4 Available Customizations
13.5 Related Reports
13.6 Knowledge Store: Marketsandmarkets Subscription Portal
List of Tables (128 Tables)
Table 1 Energy Consumption, By Industry
Table 2 Growth of End-Use Industry, 2008-2013
Table 3 Ceramic Textiles Market, Average Price, By End-Products, 2014-2021(USD/Ton)
Table 4 Ceramic Textiles Average Price, By Fiber Type, 2014-2021 (USD/Ton)
Table 5 Exposure Limits for RCF in Various Regions
Table 6 Recent Oem Insulation Patents (2012�2016)
Table 7 Global Ceramic Textiles Market Size, By Fiber Type, 2014�2021 (USD Million)
Table 8 Global Ceramic Textiles Market Size, By Fiber Type, 2014�2021 (Ton)
Table 9 Comparison Between RCF and Asbestos Fibers
Table 10 RCF Ceramic Fiber Market Size, By Region, 2014�2021 (Ton)
Table 11 RCF Ceramic Fiber Market Size, By Region, 2014�2021 (USD Million)
Table 12 Low Bio-Persistent Ceramic Fiber Market Size, By Region, 2014�2021 (USD Million)
Table 13 Low Bio-Persistent Ceramic Fiber Market Size, By Region, 2014�2021 (Ton)
Table 14 Comparison Between Polycrystalline Ceramic Fiber and Vitreous Alumina-Silica Ceramic Fiber
Table 15 Polycrystalline Ceramic Fiber Market Size, By Region, 2014�2021 (USD Million)
Table 16 Polycrystalline Ceramic Fiber Market Size, By Region, 2014�2021 (Ton)
Table 17 Global Ceramic Textiles Market Size, By Form Type, 2014�2021 (USD Million)
Table 18 Global Ceramic Textiles Market Size, By Form Type, 2014�2021 (Ton)
Table 19 Cloth Ceramic Textile Market Size, By Region, 2014�2021 (Ton)
Table 20 Cloth Ceramic Textile Market Size, By Region, 2014�2021 (USD Million)
Table 21 Ropes Ceramic Textile Market Size, By Region, 2014�2021 (Ton)
Table 22 Ropes Ceramic Textile Market Size, By Region, 2014�2021 (USD Million)
Table 23 Tapes Ceramic Textile Market Size, By Region, 2014�2021 (Ton)
Table 24 Tapes Ceramic Textile Market Size, By Region, 2014�2021 (USD Million)
Table 25 Sleeving Ceramic Textile Market Size, By Region, 2014�2021 (Ton)
Table 26 Sleeving Ceramic Textile Market Size, By Region, 2014�2021 (USD Million)
Table 27 Braids Ceramic Textile Market Size, By Region, 2014�2021 (Ton)
Table 28 Braids Ceramic Textile Market Size, By Region, 2014�2021 (USD Million)
Table 29 Others Ceramic Textile Market Size, By Region, 2014�2021 (Ton)
Table 30 Others Ceramic Textile Market Size, By Region, 2014�2021 (USD Million)
Table 31 Global Ceramic Textiles Market Size, By End-Use Industry, 2014-2021 (USD Million)
Table 32 Global Ceramic Textiles Market Size, By End-Use Industry, 2014-2021 (Ton)
Table 33 Ceramic Textiles Market Size in Industrial End-Use Industry, By Region, 2014�2021 (USD Million)
Table 34 Ceramic Textiles Market Size in Industrial End-Use Industry, By Region, 2014-2021 (Ton)
Table 35 Ceramic Textiles Market Size in Transportation End-Use Industry, By Region, 2014-2021 (USD Million)
Table 36 Ceramic Textiles Market Size in Transportation End-Use Industry, By Region, 2014-2021 (Ton)
Table 37 Global Ceramic Textiles Market Size, By Region, 2014�2021 (USD Million)
Table 38 Global Ceramic Textiles Market Size, By Region, 2014�2021 (Ton)
Table 39 North America: Ceramic Textiles Market Size, By Country, 2014�2021 (USD Million)
Table 40 North America: Ceramic Textiles Market Size, By Country, 2014�2021 (Ton)
Table 41 North America: Ceramic Textiles Market Size, By Fiber Type, 2014�2021 (USD Million)
Table 42 North America: Ceramic Textiles Market Size, By Fiber Type, 2014�2021 (Ton)
Table 43 North America: Ceramic Textiles Market Size, By Form Type, 2014�2021 (USD Million)
Table 44 North America: Ceramic Textiles Market Size, By Form Type, 2014�2021 (Ton)
Table 45 North America: Ceramic Textiles Market Size, By End-Use Industry, 2014�2021 (USD Million)
Table 46 North America: Ceramic Textiles Market Size, By End-Use Industry, 2014�2021 (Ton)
Table 47 U.S.: Ceramic Textiles Market Size, By Form Type, 2014�2021 (USD Million)
Table 48 U.S.: Ceramic Textiles Market Size, By Form Type, 2014�2021 (Ton)
Table 49 Canada: Ceramic Textiles Market Size, By Form Type, 2014�2021 (USD Million)
Table 50 Canada: Ceramic Textiles Market Size, By Form Type, 2014�2021 (Ton)
Table 51 Mexico: Ceramic Textiles Market Size, By Form Type, 2014�2021 (USD Million)
Table 52 Mexico: Ceramic Textiles Market Size, By Form Type, 2014�2021 (Ton)
Table 53 Europe: Ceramic Textiles Market Size By Region, 2014�2021 (USD Million)
Table 54 Europe: Ceramic Textiles Market Size, By Region, 2014�2021 (Ton)
Table 55 Europe: Ceramic Textiles Market Size, By Fiber Type, 2014�2021 (USD Million)
Table 56 Europe: Ceramic Textiles Market Size, By Fiber Type, 2014�2021 (Ton)
Table 57 Europe: Ceramic Textiles Market Size, By Form Type, 2014�2021 (USD Million)
Table 58 Europe: Ceramic Textiles Market Size, By Form Type, 2014�2021 (Ton)
Table 59 Europe: Ceramic Textiles Market Size, By End-Use Industry, 2014�2021 (USD Million)
Table 60 Europe: Ceramic Textiles Market Size, By End-Use Industry, 2014�2021 (Ton)
Table 61 Germany: Ceramic Textiles Market Size, By Form Type, 2014�2021 (USD Million)
Table 62 Germany: Ceramic Textiles Market Size, By Form Type, 2014�2021 (Ton)
Table 63 France: Ceramic Textiles Market Size, By Form Type, 2014�2021 (USD Million)
Table 64 France: Ceramic Textiles Market Size, By Form Type, 2014�2021 (Ton)
Table 65 U.K.: Ceramic Textiles Market Size, By Form Type, 2014�2021 (USD Million)
Table 66 U.K.: Ceramic Textiles Market Size, By Form Type, 2014�2021 (Ton)
Table 67 Italy: Ceramic Textiles Market Size, By Form Type, 2014�2021 (USD Million)
Table 68 Italy: Ceramic Textiles Market Size, By Form Type, 2014�2021 (Ton)
Table 69 Russia: Ceramic Textiles Market Size, By Form Type, 2014�2021 (USD Million)
Table 70 Russia: Ceramic Textiles Market Size, By Form Type, 2014�2021 (Ton)
Table 71 Turkey: Ceramic Textiles Market Size, By Form Type, 2014�2021 (USD Million)
Table 72 Turkey: Ceramic Textiles Market Size, By Form Type, 2014�2021 (Ton)
Table 73 Rest of Europe: Ceramic Textiles Market Size, By Form Type, 2014�2021 (USD Million)
Table 74 Rest of Europe: Ceramic Textiles Market Size, By Form Type, 2014�2021 (Ton)
Table 75 Asia-Pacific: Ceramic Textile Market Size, By Region, 2014�2021 (USD Million)
Table 76 Asia-Pacific: Ceramic Textile Market Size, By Region, 2014�2021 (Ton)
Table 77 Asia-Pacific: Ceramic Textile Market Size, By Fiber Type, 2014�2021 (USD Million)
Table 78 Asia-Pacific: Ceramic Textile Market Size, By Fiber Type, 2014�2021 (Ton)
Table 79 Asia-Pacific: Ceramic Textile Market Size, By Form Type, 2014�2021 (USD Million)
Table 80 Asia-Pacific: Ceramic Textile Market Size, By Form Type, 2014�2021 (Ton)
Table 81 Asia-Pacific: Ceramic Textile Market Size, By End-Use Industry, 2014�2021 (USD Million)
Table 82 Asia-Pacific: Ceramic Textile Market Size, By End-Use Industry, 2014�2021 (Ton)
Table 83 China: Ceramic Textile Market Size, By Form Type, 2014�2021 (USD Million)
Table 84 China: Ceramic Textile Market Size, By Form Type, 2014�2021 (Ton)
Table 85 Japan: Ceramic Textile Market Size, By Form Type, 2014�2021 (USD Million)
Table 86 Japan: Ceramic Textile Market Size, By Form Type, 2014�2021 (Ton)
Table 87 South Korea: Ceramic Textile Market Size, By Form Type, 2014�2021 (USD Million)
Table 88 South Korea: Ceramic Textile Market Size, By Form Type, 2014�2021 (Ton)
Table 89 India: Ceramic Textile Market Size, By Form Type, 2014�2021 (USD Million)
Table 90 India: Ceramic Textile Market Size, By Form Type, 2014�2021 (Ton)
Table 91 Indonesia: Ceramic Textile Market Size, By Form Type, 2014�2021 (USD Million)
Table 92 Indonesia: Ceramic Textile Market Size, By Form Type, 2014�2021 (Ton)
Table 93 Thailand: Ceramic Textile Market Size, By Form Type, 2014�2021 (USD Million)
Table 94 Thailand: Ceramic Textile Market Size, By Form Type, 2014�2021 (Ton)
Table 95 Vietnam: Ceramic Textile Market Size, By Form Type, 2014�2021 (USD Million)
Table 96 Vietnam: Ceramic Textile Market Size, By Form Type, 2014�2021 (Ton)
Table 97 Rest of Asia-Pacific: Ceramic Textile Market Size, By Form Type, 2014�2021 (USD Million)
Table 98 Rest of Asia-Pacific: Ceramic Textile Market Size, By Form Type, 2014�2021 (Ton)
Table 99 Middle East & Africa: Ceramic Textile Market Size, By Region, 2014�2021 (USD Million)
Table 100 Middle East & Africa: Ceramic Textile Market Size, By Region, 2014�2021 (Ton)
Table 101 Middle East & Africa: Ceramic Textile Market Size, By Fiber Type, 2014�2021 (USD Million)
Table 102 Middle East & Africa: Ceramic Textile Market Size, By Fiber Type, 2014�2021 (Ton)
Table 103 Middle East & Africa: Ceramic Textile Market Size, By Form Type, 2014�2021 (USD Million)
Table 104 Middle East & Africa: Ceramic Textile Market Size, By Form Type, 2014�2021 (Ton)
Table 105 Middle East & Africa: Ceramic Textile Market Size, By End-Use Industry, 2014�2021 (USD Million)
Table 106 Middle East & Africa: Ceramic Textile Market Size, By End-Use Industry, 2014�2021 (Ton)
Table 107 Saudi Arabia: Ceramic Textile Market Size, By Form Type, 2014�2021 (USD Million)
Table 108 Saudi Arabia: Ceramic Textile Market Size, By Form Type, 2014�2021 (Ton)
Table 109 UAE: Ceramic Textile Market Size, By Form Type, 2014�2021 (USD Million)
Table 110 UAE: Ceramic Textile Market Size, By Form Type, 2014�2021 (Ton)
Table 111 South Africa: Ceramic Textile Market Size, By Form Type, 2014�2021 (USD Million)
Table 112 South Africa: Ceramic Textile Market Size, Form Type, 2014�2021 (Ton)
Table 113 Rest of Middle East & Africa: Ceramic Textile Market Size, By Form Type, 2014�2021 (USD Million)
Table 114 Rest of Middle East & Africa: Ceramic Textile Market Size, By Form, 2014�2021 (Ton)
Table 115 South America: Ceramic Textile Market Size, By Region, 2014�2021 (USD Million)
Table 116 South America: Ceramic Textile Market Size, By Region, 2014�2021 (Ton)
Table 117 South America: Ceramic Textile Market Size, By Fiber Type, 2014�2021 (USD Million)
Table 118 South America; Ceramic Textile Market Size, By Fiber Type, 2014�2021 (Ton)
Table 119 South America: Ceramic Textile Market Size, By Form Type, 2014�2021 (USD Million)
Table 120 South America: Ceramic Textile Market Size, By Form Type, 2014�2021 (Ton)
Table 121 South America: Ceramic Textile Market Size, By End-Use Industry, 2014�2021 (USD Million)
Table 122 South America: Ceramic Textile Market Size, By End-Use Industry, 2014�2021 (Ton)
Table 123 Brazil: Ceramic Textile Market Size, By Form Type, 2014�2021 (USD Million)
Table 124 Brazil: Ceramic Textile Market Size, By Form Type, 2014�2021 (Ton)
Table 125 Rest of South America: Ceramic Textile Market Size, By Form Type, 2014�2021 (USD Million)
Table 126 Rest of South America: Ceramic Textile Market Size, By Form Type, 2014�2021 (Ton)
Table 127 New Product Launch, 2012�2016
Table 128 Merger & Acquisition, 2010�2016
List of Figures (55 Figures)
Figure 1 Ceramic Textiles Market: Research Design
Figure 2 Primary Interviews
Figure 3 Market Size Estimation: Bottom-Up Approach
Figure 4 Market Size Estimation: Top-Down Approach
Figure 5 Data Triangulation
Figure 6 Assumptions in the Research Study
Figure 7 RCF Projected to Be the Fastest-Growing Fiber Type in Ceramic Textiles Market During Forecast Period
Figure 8 Ceramic Textiles Market Snapshot, By Form Type (2016 vs 2021)
Figure 9 Ceramic Textiles Market Size (Volume), By End-Use Industry, 2015 and 2021
Figure 10 Asia-Pacific to Be Fastest-Growing Market for Ceramic Textiles Between 2016 and 2021
Figure 11 Attractive Opportunities in Ceramic Textiles Market, 2016�2021
Figure 12 Asia-Pacific Was the Largest Market for Ceramic Textiles in 2015
Figure 13 Ceramic Cloth Accounted for the Largest Market Share in Asia-Pacific in 2015
Figure 14 China is the Largest Market for Ceramic Textiles
Figure 15 China Accounted for Largest Share of Global Ceramic Textiles Market in 2015
Figure 16 Ceramic Textiles Market, By Region
Figure 17 Drivers, Restraints, Opportunities, and Challenges for the Ceramic Textiles Market
Figure 18 Value Chain for Ceramic Textiles Industry
Figure 19 Porter�s Five Forces Analysis
Figure 20 RCF Accounted for the Largest Share of the Overall Ceramic Textiles Market in 2015, (Tons)
Figure 21 RCF: Application Areas
Figure 22 Asia-Pacific to Dominate the RCF Market Between 2016 and 2021
Figure 23 Low Bio-Persistent Ceramic Fiber: Properties and Advantages
Figure 24 Low Bio-Persistent Ceramic Fiber: Application Areas
Figure 25 Europe Dominated the Low Bio-Persistent Ceramic Fiber Market in 2015
Figure 26 Europe: Largest Market for Polycrystalline Ceramic Fiber in 2015
Figure 27 Cloth and Ropes: Most Widely Used Ceramic Textile, By Form Type
Figure 28 Asia-Pacific to Be the Fastest Growing Market for Cloth Ceramic Textile Between 2016 and 2021
Figure 29 Asia-Pacific to Dominate Ropes Ceramic Textile Market, 2016�2021
Figure 30 Tapes Ceramic Textile Market: Asia-Pacific to Witness Highest Growth, 2016�2021
Figure 31 Asia-Pacific Dominates Sleeving Ceramic Textile Market
Figure 32 Asia-Pacific Dominated the Braids Ceramic Textile Market
Figure 33 Asia-Pacific Accounts for Largest Share of Others Ceramic Textile Market
Figure 34 Industrial Segment: the Largest End-Use Industry of Ceramic Textiles Market
Figure 35 Ceramic Textiles Market: Asia-Pacific to Witness Fastest-Growth in Industrial End-Use Segment Between 2016�2021
Figure 36 Asia-Pacific to Dominate Ceramic Textiles Market in Transportation End-Use Industry Segment During the Forecast Period
Figure 37 Regional Snapshot (2015): Rapidly Growing Markets are Emerging as New Hotspots
Figure 38 U.S. Was the Key Ceramic Textiles Market in North America in 2015
Figure 39 Germany Accounted for the Largest Market Share in Europe
Figure 40 Regional Snapshot (2015): Asia-Pacific to Be the Largest Market for Ceramic Textiles
Figure 41 China: Largest Market for Ceramic Textiles in Asia-Pacific
Figure 42 Brazil: Ceramic Textile Market
Figure 43 Companies Adopted New Product Launches as the Key Growth Strategy in the Last Four Years
Figure 44 Market Share Analysis: Top 10 Market Players
Figure 45 New Product Launch: Most Popular Growth Strategy Between 2012 and 2016
Figure 46 Morgan Advanced Materials Corporation: Company Snapshot
Figure 47 Morgan Advanced Materials: SWOT Analysis
Figure 48 Kyocera Corporation: Company Snapshot
Figure 49 Kyocera Corporation: SWOT Analysis
Figure 50 Ibiden Co. Ltd.: Company Snapshot
Figure 51 Ibiden Co. Ltd.: SWOT Analysis
Figure 52 Isolite Insulating Products Co. Ltd.: SWOT Analysis
Figure 53 3M Company.: Company Snapshot
Figure 54 3M Company:SWOT Analysis
Figure 55 Rath Inc.: Company Snapshot


Growth opportunities and latent adjacency in Ceramic Textile Market