
Ceramic Tiles Market

Ceramic Tiles Market by Type (Porcelain, Ceramic), Application (Floor Tiles, Internal Wall Tiles, External Wall Tiles), End-use Sector (Residential, Non-residential), Finish (Matt, Gloss), Construction Type, and Region - Global Forecast to 2030


CERAMIC TILES MARKET
Source: Secondary Research, Interviews with Experts, MarketsandMarkets Analysis | Updated on : April 29, 2026
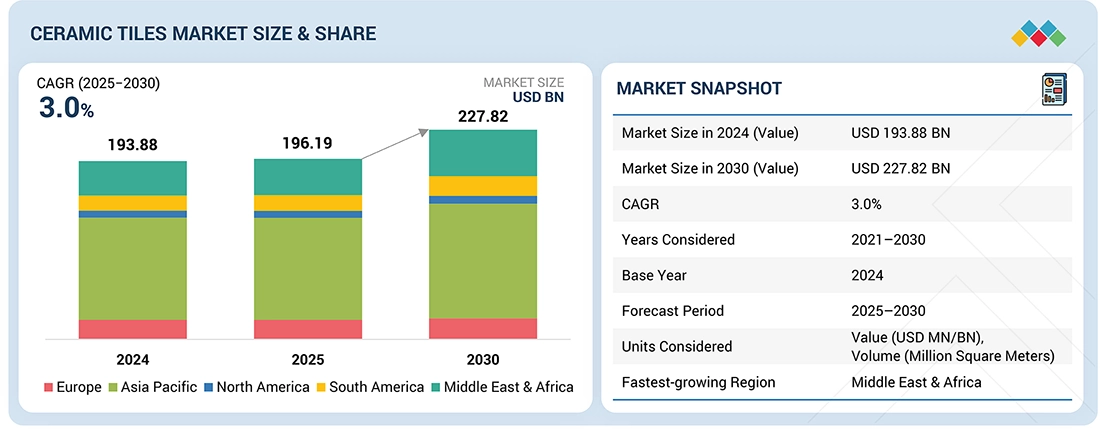
The ceramic tiles market is projected to reach USD 227.82 billion by 2030 from USD 196.19 billion in 2025, growing at a CAGR of 3.0% from 2025 to 2030. Ceramic tiles are made of clay, silica, dyes, and many other materials. They are thin, though some can be up to 20 mm thick. Raw materials are ground and compressed through different methods and undergo several heating and cooling processes. The combination of various materials and manufacturing processes leads to the production of tiles with mixed characteristics. Fired clay is the most common and is obtained using the semi-dry pressing technique with one or more firings. The surface is coated, offering various colors and designs. Rapid urbanization and infrastructure development are increasing the demand for ceramic tiles in different construction projects. The durability of ceramic tiles makes them an ideal choice for the residential and commercial sectors.
KEY TAKEAWAYS
-
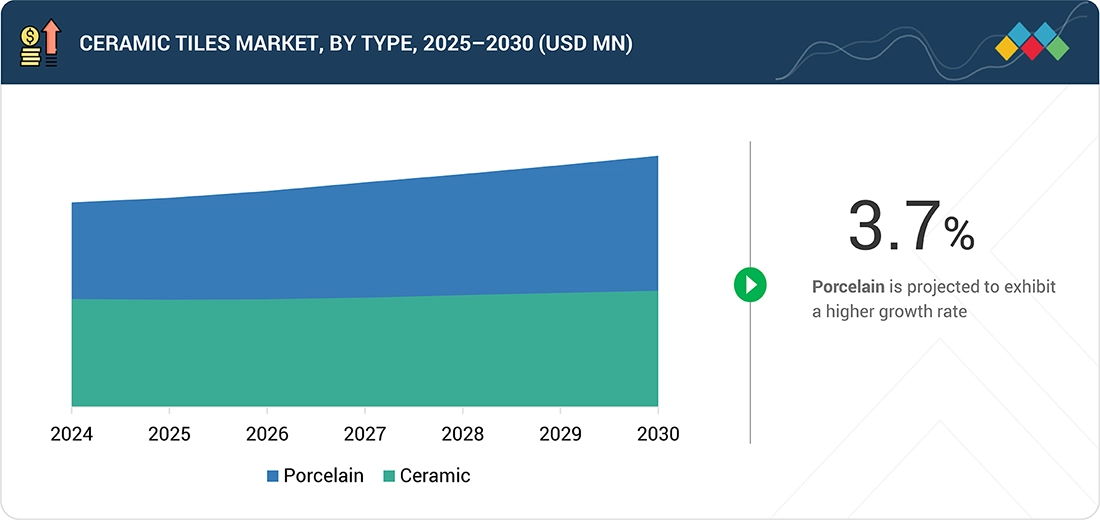
BY TYPEThe ceramic tiles market by type includes porcelain and ceramic. Porcelain dominates the market in terms of demand, as its density makes it more resistant to wear and tear.
-
BY APPLICATIONThe ceramic tiles market by application includes flooring, interior walls, exterior walls, and other applications. Flooring is the fastest-growing segment because of its superior strength, water resistance, and low maintenance requirements.
-
BY END-USE SECTORThe ceramic tiles market by end-use sector includes residential and non- residential. Residential dominates the market in terms of demand, due to the increasing working population and millennials aspiring to homeownership.
-
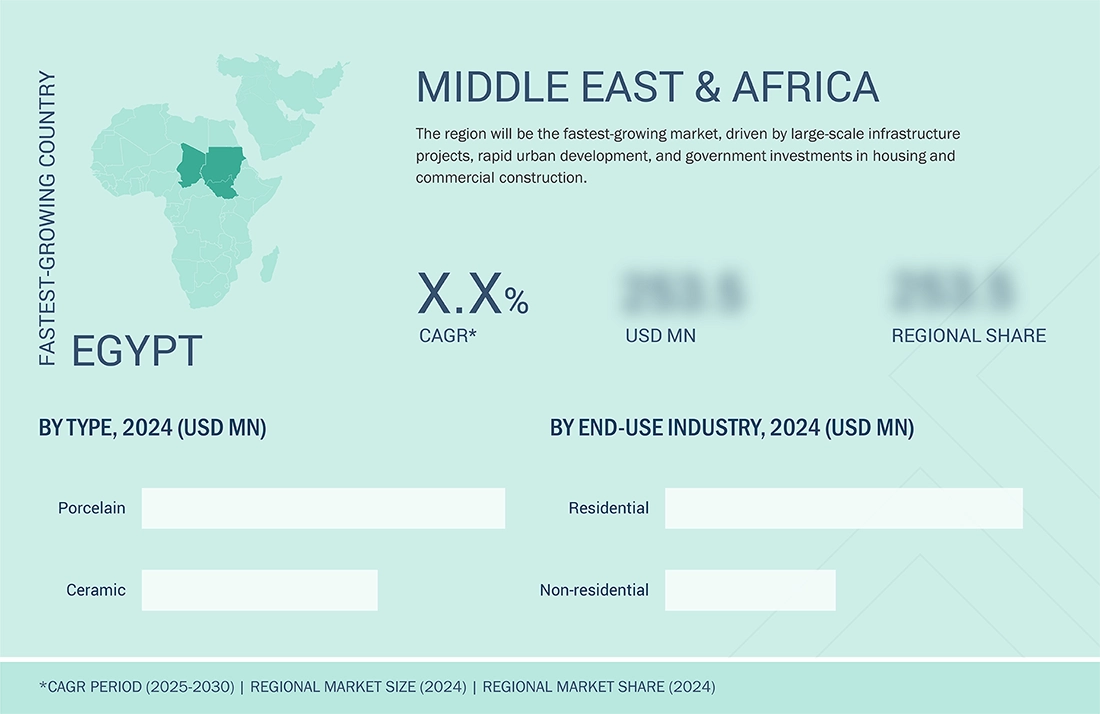
BY REGIONThe market in the Middle East & Africa is expected to grow the fastest, driven by population growth, urbanization, and increased demand for good infrastructure.
-
COMPETITIVE LANDSCAPEThe market is driven by strategic product launches, collaborations, acquisitions, and expansions from leading players such as Mohawk Industries, Inc., Grupo Lamosa, Siam Cement Public Company Limited, Pamesa Ceramica, RAK Ceramics, and Ceramica Carmelo Fior. These companies are strong in their home regions and are exploring geographic diversification options to grow their businesses.
Technological advancements in tile manufacturing and rising demand for ceramic tiles in emerging markets are expected to create growth opportunities for companies in the ceramic tiles market. However, the natural gas crisis and intense competition are expected to be the challenges for the market players.
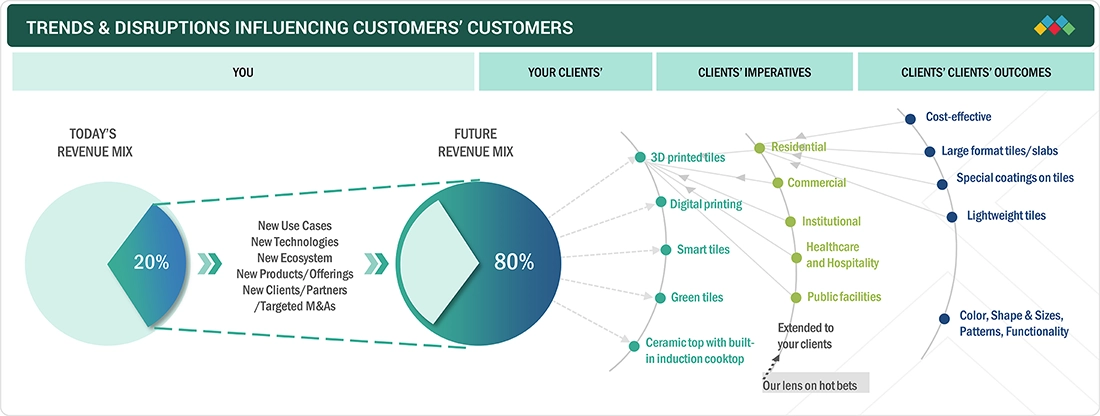
TRENDS & DISRUPTIONS IMPACTING CUSTOMERS' CUSTOMERS
Changes in customer trends and disruptions impact consumers' businesses. These trends and disruptions directly affect the end consumers of tile buyers, such as homeowners, real estate developers, and businesses. At the same time, disruptions like fluctuating raw material costs, digital design tools, and innovations in installation methods are pushing tile manufacturers and distributors to adapt quickly.
Source: Secondary Research, Interviews with Experts, MarketsandMarkets Analysis
MARKET DYNAMICS
Level
-
Increasing population & urbanization

-
Growing investments in the construction industry

Level
-
Volatile raw raw material prices

-
Increasing regulations, tariffs, and anti-dumping measures

Level
-
Office-to-residential conversions unlock new growth avenues for the ceramic tiles market

-
Introduction of 3D tiles and digital technologies printing

Level
-
Natural gas crisis in different regions

-
Extremely competitive market

Source: Secondary Research, Interviews with Experts, MarketsandMarkets Analysis
Driver: Increasing investments in infrastructure development
The increasing investments in the infrastructure sector are expected to drive the growth of the ceramic tiles market. Governments of different countries are investing in developing and upgrading infrastructure, including residential, commercial, and public properties. These developments have increased the demand for ceramic tiles—a vital construction material. As per the International Monetary Fund (IMF), it is estimated that the spending required to meet the Sustainable Development Goals (SDGs) in 2030 will amount to USD 2.6 trillion, or 2.5% of the 2030 world GDP, in 121 emerging economies and low-income developing countries. Ceramic tiles are known for their versatility and durability. They are more sustainable than vinyl tiles and are available in various designs. These tiles are ideal for flooring and wall applications in different construction projects. The surge in infrastructure development has increased the need for high-quality tiles, boosting the growth of the ceramic tiles market.
Restraint: Volatile raw material prices
Different raw materials, such as clay and feldspar, are used to make ceramic tiles. Raw material prices fluctuate because of supply chain constraints in different regions, geopolitical tensions, war situations (the recent US sanctions on Russian goods), and the implementation of strict environmental regulations. Such scenarios lead to higher production costs. It is difficult for manufacturers to keep prices stable. Additionally, the increasing prices can squeeze profit margins, making it harder for firms to invest in new technologies and research.
Opportunity: High demand in Asia Pacific
According to the World Bank, new climate-smart infrastructure could cost low-income and middle-income countries almost 2–8% (USD 640 billion–USD 2.7 trillion) of GDP annually by 2030. The emerging markets are expected to account for most of the projected increase in infrastructure spending by 2050. Asia Pacific has witnessed expansion in its manufacturing capabilities and has a large, skilled workforce. Besides, the region has an abundant base of raw materials. Hence, it offers opportunities for ceramic tile manufacturers and suppliers looking to capitalize on the region's increasing demand.
Challenge: Natural gas crisis in different regions
The Russia-Ukraine war has affected many industries and sectors globally, including the ceramic tiles industry. The fluctuations and increased natural gas prices are the major challenges in the current scenario. Natural gas constitutes 30–40% of the production cost of ceramic tiles. Hence, it is a critical energy source for firing kilns. The increase in its price directly raises production costs. The ceramic tiles industry requires a significant gas daily and is therefore becoming highly vulnerable to price volatility. The increased costs are expected to consequently raise the prices of ceramic tiles, reducing demand and squeezing the profit margins of manufacturers.
Ceramic Tiles Market: COMMERCIAL USE CASES ACROSS INDUSTRIES
| COMPANY | USE CASE DESCRIPTION | BENEFITS |
|---|---|---|
 |
Developed bio-based ceramic tiles eliminating the need for high-temperature kiln firing; incorporated graphene for added strength and durability | 80–90% lower carbon emissions vs. traditional tiles, reduced energy consumption, improved tile strength (+20%), enhanced durability, and eco-friendly positioning |
Logos and trademarks shown above are the property of their respective owners. Their use here is for informational and illustrative purposes only.
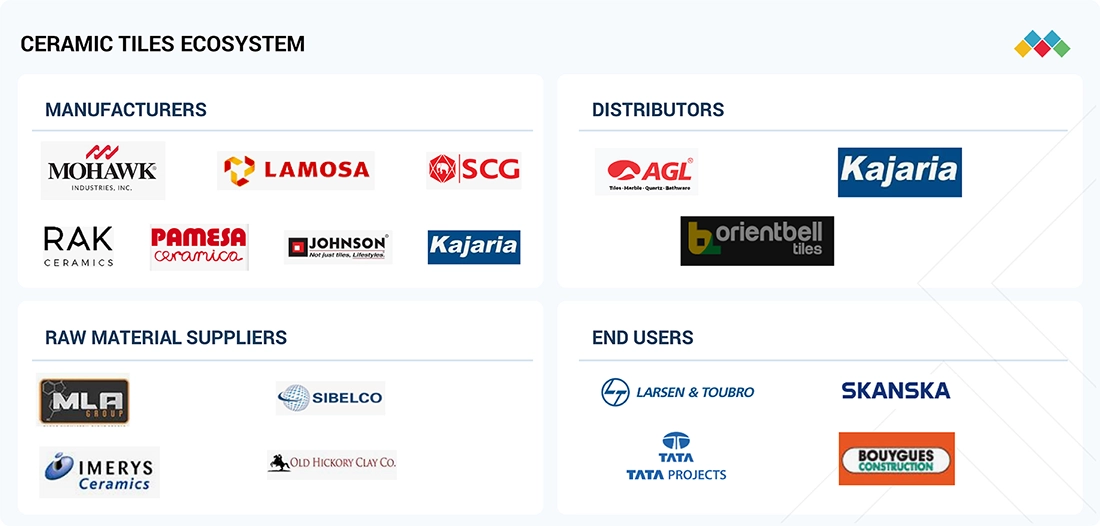
MARKET ECOSYSTEM
The ceramic tiles market ecosystem consists of several players. It starts with raw material suppliers who provide clay, feldspar, silica, and other minerals. Manufacturers then process these into ceramic tiles through designing, glazing, and finishing. After that, distributors, wholesalers, and retailers supply tiles to builders, contractors, interior designers, and homeowners. Finally, end users include residential and non-residential projects.
Logos and trademarks shown above are the property of their respective owners. Their use here is for informational and illustrative purposes only.
MARKET SEGMENTS
Source: Secondary Research, Interviews with Experts, MarketsandMarkets Analysis
Ceramic Tiles Market, By Type
Large-format tiles are gaining popularity in interior design. The size of slab tiles can be extended up to 5 x 10 ft. or more. Porcelain tiles are durable and known for their aesthetic appeal. Their large size reduces grout lines, thus creating a seamless and cohesive look. The combination of colors, patterns, and various benefits makes large-format porcelain tiles the fastest-growing segment in the ceramic tiles market.
Ceramic Tiles Market, By Application
The flooring application segment is expected to dominate the ceramic tiles market during the forecast period. Among the other tile types, ceramic tiles are the most durable option for this application. Floor tiles can be easily maintained and are wear & tear-free. These attributes make them perfect for high-traffic areas. Floor tiles come in different options and are versatile. Thus, they suit the needs of any aesthetic and design, while others have exciting finishes for functional necessity. In addition, ceramic tiles are well-suited for areas requiring water and stain resistance (homes, offices, or industries).
Ceramic Tiles Market, By End-use Sector
Residential construction (individual/family living, single-family homes, detached homes, duplexes, triplexes, flats, apartments, townhouses, housing cooperatives, and condominiums) requires aesthetic and cost-effective flooring solutions. The residential segment is expected to dominate the ceramic tiles market during the forecast period, as many regions and countries are witnessing an increase in construction and remodeling activities due to the rise in people's migration to cities and increased focus on improving aesthetics.
REGION
The Middle East & Africa is projected to be the fastest-growing ceramic tiles market
Significant investments in urban infrastructure and construction industries drive the market growth in the Middle East & Africa. Increasing construction activities and public sector finance have provided ceramic tile manufacturers with opportunities to develop innovative products. The increasing demand for aesthetic products with high durability, moisture resistance, and fire resistance characteristics is expected to drive the ceramic tiles market in the region. The region has a significantly large population, which leads to a substantial demand for residential construction. Global players have started expanding their businesses, particularly in Africa, due to the availability of cheap labor, low exchange rates, and lenient environmental, health, and safety laws. The geographic proximity of Africa and the Middle East with Asia Pacific and Europe has made the Middle East & Africa an emerging destination for manufacturing facilities.
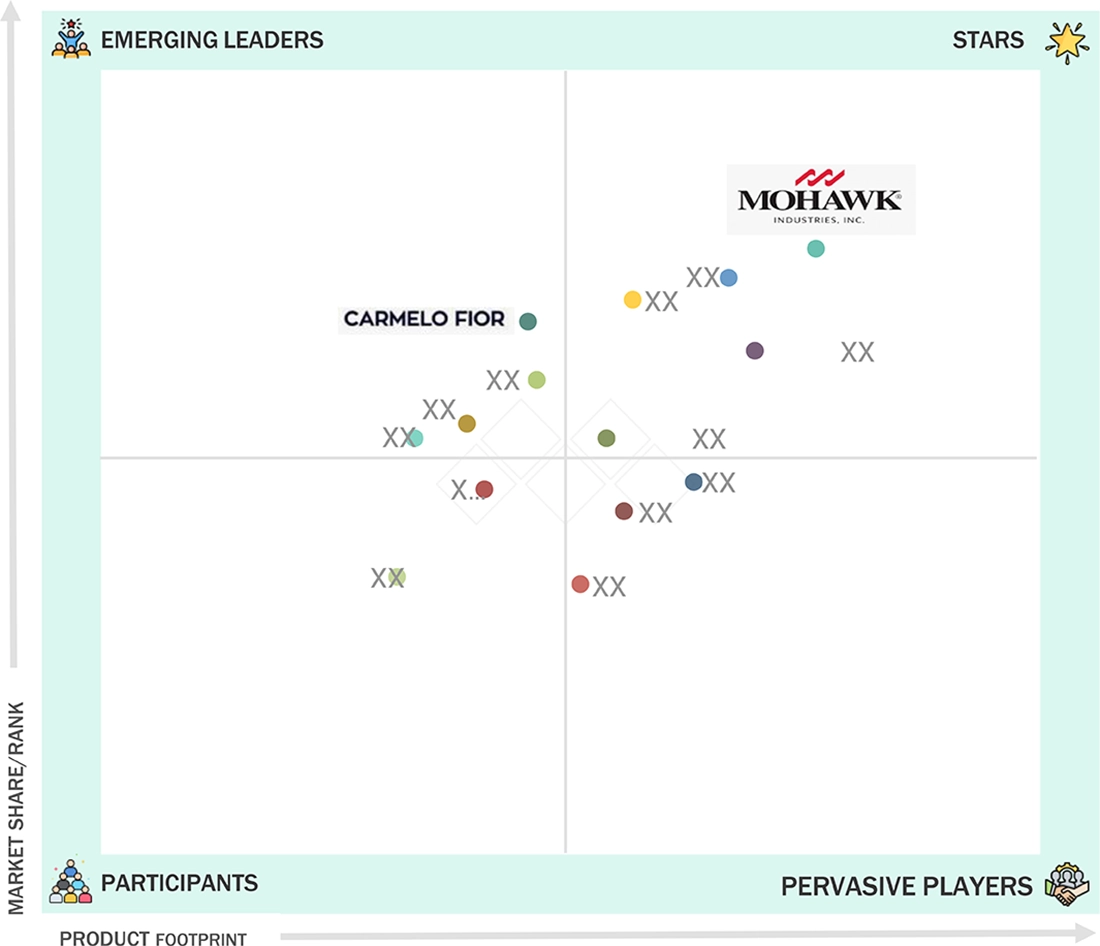
Ceramic Tiles Market: COMPANY EVALUATION MATRIX
In the ceramic tiles market matrix, Mohawk Industries, Inc. (Star), leads the market. Known for its focus on innovation and sustainability, Mohawk invests in advanced technologies to improve product performance and minimize environmental impact. Ceramica Carmelo Fior (Emerging Leader) is gaining traction. The company has four manufacturing facilities, with a monthly capacity of 8 million square meters of floors and coverings.
Source: Secondary Research, Interviews with Experts, MarketsandMarkets Analysis
KEY MARKET PLAYERS
MARKET SCOPE
| REPORT METRIC | DETAILS |
|---|---|
| Market Size in 2024 (Value) | USD 193.88 BN |
| Market Forecast in 2030 (Value) | USD 227.82 BN |
| Growth Rate | CAGR of 3.0% from 2025 to 2030 |
| Years Considered | 2021–2030 |
| Base Year | 2024 |
| Forecast Period | 2025–2030 |
| Units Considered | Value (USD MN/BN), Volume (Million Square Meters) |
| Report Coverage | Revenue forecast, company ranking, competitive landscape, growth factors, and trends |
| Segments Covered | By Type: Porcelain and Ceramic By Application: Flooring, Internal Walls, External Walls, and Others By End-use Sector: Residential and Non-residential By Finish: Matt and Gloss By Construction Type: New Construction and Renovation |
| Regions Covered | North America, Asia Pacific, Europe, South America, the Middle East & Africa |
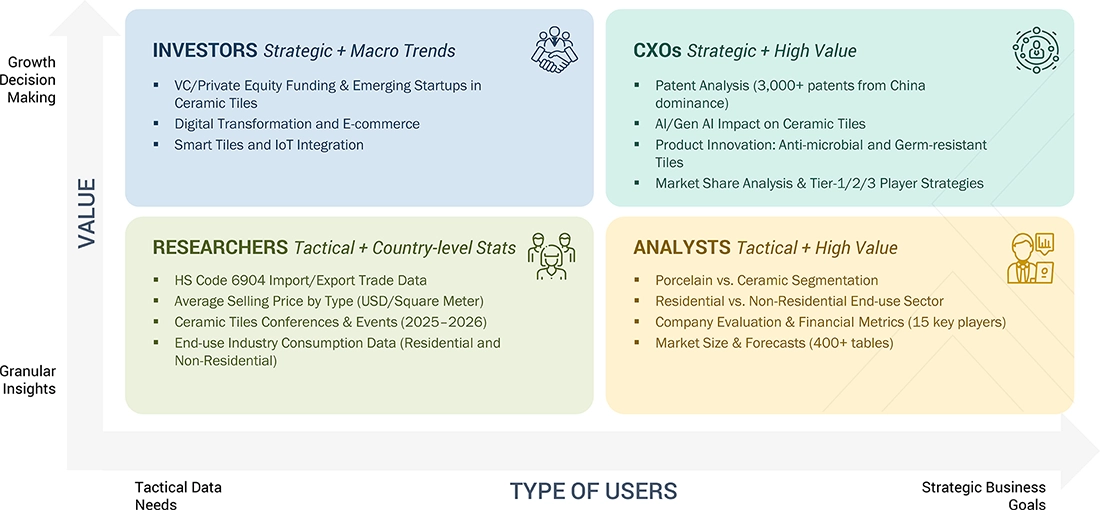
WHAT IS IN IT FOR YOU: Ceramic Tiles Market REPORT CONTENT GUIDE
DELIVERED CUSTOMIZATIONS
We have successfully delivered the following deep-dive customizations:
| CLIENT REQUEST | CUSTOMIZATION DELIVERED | VALUE ADDS |
|---|---|---|
| Detailed Ceramic Tile Market Analysis for 60 Countries | Market sizing and forecasting of ceramic tile demand in 60 countries, segmented by type, application, end-user, and distribution channel Additional segmentation delivered- By size (small, medium, large, extra-large) | Country-specific construction infrastructure trends Recent developments in regulations, investments, and projects influencing ceramic tile demand in all 60 countries |
| Asia Pacific-based Ceramic Tiles Market | Detailed company profiles of ceramic tile competitors (financials, product portfolio, production capacity) End-use industry mapping (residential and non-residential) | Identified & profiled 15+ ceramic tile producers across Asia Pacific Mapped demand trends across high-growth segments Assessment of government regulations, sustainability initiatives, and trade dynamics |
RECENT DEVELOPMENTS
- October 2024 : RAK Ceramics signed a framework agreement with Sobha Constructions LLC, a leading multinational construction company that is part of the Sobha Group, to supply premium ceramic and porcelain tiles for the company's upcoming projects.
- June 2024 : RAK Ceramics successfully completed the acquisition of the remaining 8% stake in RAK Porcelain LLC, making it a wholly owned subsidiary.
- November 2022 : RAK Ceramics created the "Imagine Your Space" metaverse experience. This digital space enhances the customer experience by enabling users to discover the most innovative collections.
- October 2022 : Grupo Lamosa entered into an agreement to acquire Baldocer. Baldocer is a company dedicated to manufacturing, designing, and selling ceramic floor and wall tiles.
- November 2021 : RAK Ceramics collaborated with ELIE SAAB and launched its ELIE SAAB bathroom and surface collections in Dubai.
Table of Contents
 Exclusive indicates content/data unique to MarketsandMarkets and not available with any competitors.
Methodology
The study involved four main activities to estimate the current global size of the ceramic tiles market. Extensive secondary research was conducted to collect information on the market, its peer markets, and the parent market. The next step was to validate these findings, assumptions, and sizes with industry experts across the ceramic tiles value chain through primary research. Both top-down and bottom-up approaches were used to estimate the overall size of the ceramic tiles market. Subsequently, market segmentation and data triangulation procedures were applied to determine the size of different segments and sub-segments of the market.
Secondary Research
During the secondary research process, various sources such as D&B Hoovers, Factiva, Bloomberg BusinessWeek, and Dun & Bradstreet were used to gather information for this study on the ceramic tiles market. These sources included annual reports, press releases and investor presentations of companies, white papers, certified publications, articles by recognized authors, regulatory bodies, trade directories, and databases. The secondary research helped obtain essential information on the industry’s value chain, the key players, market classification, and segmentation from both market and technology perspectives.
Primary Research
Various primary sources from both the supply and demand sides of the ceramic tiles market were interviewed to gather qualitative and quantitative information. The primary sources from the supply side included industry experts such as Chief Executive Officers (CEOs), vice presidents, marketing directors, sales professionals, and other key executives from leading companies and organizations in the ceramic tiles industry. The breakdown of the profiles of primary respondents is as follows:
The following is a breakdown of the primary respondents:

Notes: Companies are classified based on their revenue–Tier 1 = >USD 7 billion, Tier 2 = USD 500 million to USD 7 billion, and Tier 3 = < USD 500 million.
Other designations include sales, marketing, and product managers.
To know about the assumptions considered for the study, download the pdf brochure
Market Size Estimation
Both the top-down and bottom-up approaches were employed to estimate and validate the global ceramic tiles market size. These methods were also widely used to measure the size of various related market segments. The research methodology used to estimate the market size included the following details:
- The key players were identified through comprehensive secondary research.
- In terms of value, the industry’s supply chain and market size were determined through primary and secondary research methods.
- All percentage shares, splits, and breakdowns were derived from secondary sources and confirmed through primary sources.
- All relevant parameters affecting the markets covered in this study were thoroughly considered, examined in detail, verified through primary research, and analyzed to produce final quantitative and qualitative data.
- The research includes analyzing reports, reviews, and newsletters of major industry players and in-depth interviews with key officials such as directors and marketing executives.

Data Triangulation
After determining the overall market size through the estimation process described above, the total market was divided into several segments and sub-segments. Data triangulation and market breakdown methods were used, where applicable, to complete the overall market analysis and determine accurate statistics for all segments and sub-segments of the ceramic tiles market. The data was triangulated by examining various factors and trends from both the demand and supply sides.
Furthermore, the market size was validated using both top-down and bottom-up approaches. It was then confirmed through primary interviews. Therefore, for each data segment, there are three sources—top-down approach, bottom-up approach, and expert interviews. The data were considered accurate when the values from the three sources aligned.
Market Definition
The ceramic tiles includes a broad range of products primarily made from clay and other natural materials, used for flooring, interior and exterior walls, and various architectural applications in both residential and commercial sectors. This global market is fueled by factors such as urbanization, construction activity, and interior design trends, with regional differences shaped by economic conditions and cultural preferences. Major trends involve technological advances in production, increasing demand for eco-friendly products, and the adoption of innovative designs.
Stakeholders
- Raw material suppliers
- Ceramic tile manufacturers
- Government & regulatory bodies
- Research organizations
- Associations and industry bodies
- End-use sectors
- Traders and distributors
Report Objectives
- To estimate and forecast the ceramic tiles market, in terms of value and volume
- To provide detailed information about the major factors (drivers, restraints, opportunities, and challenges) influencing the market growth
- To define, describe, and forecast the market size, based on type, application, end-use sector, and region
- To forecast the market size along with segments and submarkets, in key regions: North America, Europe, Asia Pacific, Middle East & Africa, and South America, along with their key countries
- To strategically analyze micromarkets, with respect to individual growth trends, prospects, and their contribution to the total market
- To analyze growth opportunities in the market for stakeholders and provide details on the competitive landscape for market leaders
- To strategically profile key players and comprehensively analyze their market shares and core competencies
- To analyze competitive developments, such as mergers & acquisitions, expansions & investments, and agreements in the ceramic tiles market
- To provide the impact of AI/Gen AI on the market
Key Questions Addressed by the Report
What are the major drivers for the growth of the ceramic tiles market?
Increasing population, urbanization, and investments in the infrastructure sector are the primary drivers of ceramic tiles market growth.
What are the major challenges in the ceramic tiles market?
The major challenges include the gas crisis and intense market competition.
What are the restraining factors for the ceramic tiles market?
Fluctuating raw material prices and global war and recession scenarios are key restraints for the market.
What is the key opportunity for the players in the ceramic tiles market?
High demand for ceramic tiles in the Asia Pacific region presents significant growth opportunities for market players.
Who are the key players in the global ceramic tiles market?
Key players include Mohawk Industries Inc. (US), Grupo Lamosa (Mexico), Pamesa Ceramica (Spain), RAK Ceramics (UAE), Siam Cement Public Company Limited (Thailand), Kajaria Ceramics (India), and Ceramica Carmelo For (Brazil).
How is the ceramic tiles market aligned?
The ceramic tiles market is fragmented, with many global, regional, and domestic companies. These players have strong procurement and distribution networks, enabling cost-efficient production.
Need a Tailored Report?
Customize this report to your needs
Get 10% FREE Customization
Customize This ReportPersonalize This Research
- Triangulate with your Own Data
- Get Data as per your Format and Definition
- Gain a Deeper Dive on a Specific Application, Geography, Customer or Competitor
- Any level of Personalization
Let Us Help You
- What are the Known and Unknown Adjacencies Impacting the Ceramic Tiles Market
- What will your New Revenue Sources be?
- Who will be your Top Customer; what will make them switch?
- Defend your Market Share or Win Competitors
- Get a Scorecard for Target Partners

Custom Market Research Services
We Will Customise The Research For You, In Case The Report Listed Above Does Not Meet With Your Requirements
Get 10% Free CustomisationTESTIMONIALS

We at Nissan Chemicals Corporation have been clients of MarketsandMarkets for more than a year now. We recently consulted MarketsandMarkets for a study, the team at MarketsandMarkets was extremely professional and organized. The business insights were very detailed and aligned well with our expectations that really helped us formulate the Business Plans and device new strategies for development themes. MarketsandMarkets offers a unique combination of expertise and dedicated engagement model. Their research findings have helped us in designing our Pricing Strategy which will make it easier for us to predict the future sales and profits for the next ten years. We look forward to working with MarketsandMarkets in the future.
VP of Strategy & New Business Development
Leading Specialty Chemical Company
The MarketsandMarkets Engagement Model, composed of both the Knowledge Store and advisory custom research, has greatly helped us in understanding our markets and making strategic decisions. The Knowledge Store is a fast way to allow everyone in our organization to understand more about most any market they are interested in. The ability to then get custom research done and get answers to specific strategic questions and market insight has been spectacular. The Markets and Markets team feel more like colleagues than vendors and their services have helped us change our culture where statements of things like growth opportunities and competitive position are always backed by industry research.

Rich Gibson,
Director, Corporate Strategy
Milliken & Company,
Leading Industrial Manufacturer of specialty chemical, floor covering, performance and protective textile materials, and healthcaremilliken.com
MarketsandMarkets is a trusted resource that helps us to better understand markets that are near-adjacencies-whether its technology, value chain or geography. Their Knowledge Store platform provides a dashboard of markets and their characteristics which is easy to use and saves us time.
Adam Shaw,
Market Development and Strategy Manager
AdvanSix Inc. USA,
An American Leader in Chemicalswww.advansix.com
The Knowledge Store from MarketsandMarkets is a valuable tool which has helped my team acquire greater insight in to the end markets that our business serves. This has enabled us to help our company build stronger strategies throughout our planning process.
TOSHIO KINOSHITA
Senior Chif Consultion Research & Consulting Division
Mitsubishi Chemical Research Corporation,
Leading Manufacturer of Chemical Productswww.mitsubishichem-res.co.jp/en/

We recently engaged with MarketsandMarkets for a study, the team not only clearly understood our business objectives but was also extremely professional in the way they handled the entire project. The study was efficiently conducted in a phase-wise manner, and the engagement model furnished us with high-quality business insights that far exceeded our expectations at each phase. We were especially happy that MarketsandMarkets could provide us with both, an English as well as a Japanese version of the study. A special thanks to the Analyst Team and Client Services Team, whose fluency in Japanese enhanced our comfort level, as we could converse with them in our preferred language.
Independent entrepreneurs
Arrow Precision
We approached MarketsandMarkets for study on Proppants Market, and their work exceeded our expectations. The study conducted was comprehensive and enabled us to view the market through the various dimensions. In addition, the team was extraordinarily responsive throughout the process and resolved our queries on time. I strongly recommend MarketsandMarkets and will certainly consider them for additional market assessments we will need in the future.
Global engineering company, Japan
Deputy Manager,
Strategic Planning OfficeThe high-quality insights shared by the MarketsandMarkets team helped us understand the pharmaceutical plant designers in a specific geography. It also captured the risks that we may likely face in communicating with our potential partners. The study would enable us identify partners, which would impact our future growth.


Growth opportunities and latent adjacency in Ceramic Tiles Market