Chemical Protective Clothing Market by Type (Aramid & Blends, PBI, Polyamide, Cotton Fibers, Laminated Polyester, Polyolefin & Blends, UHMW Polyethylene, and Others), End-Use Industry (Construction & Manufacturing, Oil & Gas, Healthcare/Medical, Firefighting & Law Enforcement, Mining, Military, and Others), & by User Type (Industrial, and Personal) - Global Forecast to 2020


The chemical protective clothing market is estimated to have accounted for USD 0.91 Billion in 2014 and is projected to reach USD 1.29 Billion by 2020, registering a CAGR of 5.8% between 2015 and 2020. In this report, 2014 is considered as the base year and forecast period is between 2015 and 2020. The global chemical protective clothing market has been segmented on the basis of type, end-use industry, user type and region. The chemical protective clothing market for aramid & blends accounted for the major share in 2014, owing to excellent thermal resistance property. Aramid & blends is in high demand from end-use industries such as construction & manufacturing, oil & gas, healthcare, and others.
The construction & manufacturing industry accounted for the largest share in the chemical protective clothing market in 2014. This is due to the rapid growth of the construction & manufacturing industry in developing nations. The use of chemical protective clothing in the military is expected to grow at the highest CAGR during the forecast period. The increasing use of chemical as well as biological weapons in war is forcing countries to provide better quality chemical protective clothing to their soldiers.
The industrial users segment accounted for the major share of the chemical protective clothing market. The dominance of industrial users segment is attributed to strict safety and precautionary measures imposed by government in every manufacturing facility.
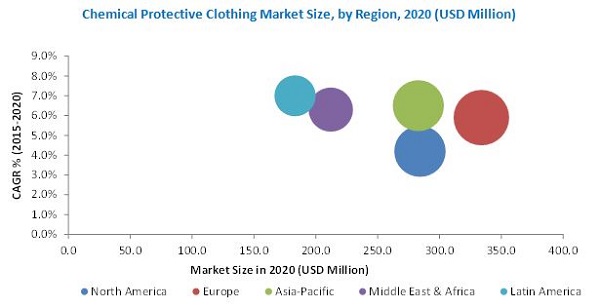
The European chemical protective clothing market accounted for the largest market share of 25% in 2014. The dominance of Europe in the market is attributed to stringent safety-related legislations in the region. The Latin American chemical protective clothing market is expected to witness high growth during the forecast period. The emerging petrochemical and pharmaceutical industry in the region is pushing the use of chemical protective clothing in the region.
In this report, market sizes have been derived using both bottom-up and top-down approaches. The market size for each type [aramid & blends, PBI, polyamide, cotton fibers, laminated polyester, polyolefin & blends, UHMW polyethylene, and others] for different regions and countries has been identified using secondary and primary research. The overall chemical protective clothing market size for various regions and countries has been calculated by adding this individual market size. The market size for chemical protective clothing at regional level has been further broken down on the basis of end-use industries, using percentage split gathered during the research. For future growth (CAGR) trends of the chemical protective clothing market, the end-use industries construction & manufacturing, oil & gas, healthcare/medical, firefighting & law enforcement, mining, military, and others and others have been analyzed. Findings of this study have been verified through primary research by conducting extensive interviews with key officials, such as CEOs, VPs, directors, and executives. The breakdown of profiles of primary interviewees is depicted in the below figure:
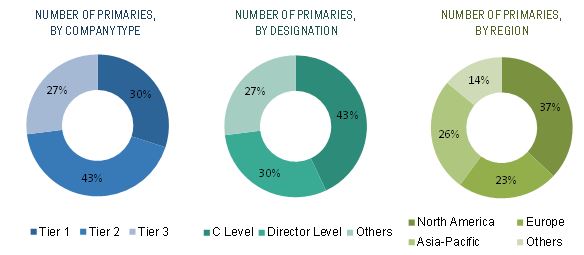
To know about the assumptions considered for the study, download the pdf brochure
Chemical protective clothing can be made by using various kinds of raw materials. The raw material for chemical protective clothing is synthetic fibers. These synthetic fibers are made from synthesized polymer in petrochemical industries. Synthetic fibers are processed by fiber material manufacturers to make different kind of chemical protective fiber materials. The companies engaged in manufacturing protective fiber materials are PBI Performance products (U.S.), DuPont (U.S.), and Teijin Limited (Japan). The various types of fibers are processed by chemical protective clothing manufacturers to produce different types of chemical protective clothing. The companies involved in manufacturing chemical protective clothing are Ansell Limited (U.S.), Honeywell (U.S.), DuPont (U.S.), and Teijin (Japan). As per their transportation and distribution network, companies decide their suppliers and also the market on which they can target. Companies such as Ansell Limited (U.S.), Lakeland Industries (U.S.), Sioen Industries (Belgium), and 3M (U.S) have their presence all across the globe which has helped them to become the key players in chemical protective clothing industry
The major chemical protective clothing manufacturers are Ansell Limited (Australia), 3M Company (U.S.), Honeywell International (U.S.), Lakeland Industries (U.S.), Kimberly Clark Corp (U.S.), MAS (U.S.), W. L. Gore & Associates Inc. (U.S.), Respirex (U.S.), Kappler Inc. (U.S.), E.I. DuPont DE Nemours (U.S.), International Enviroguard (U.S.), Delta Plus Group (U.S.), Sion Industries NV (Belgium), and Teijin limited (Japan).
The target audiences for the chemical protective clothing market report are as follows:
- Chemical protective clothing manufacturers
- Chemical protective clothing suppliers
- Government and research organizations
- Companies engaged in material R&D
- Raw material suppliers
- Service providers
- End users such as construction, manufacturing, oil & gas, military, mining, and other companies
Scope of the Report
This report categorizes the global market for chemical protective clothing on the basis of type, end-use industries, user type, and region.
- Market Segmentation, by Type:
The chemical protective clothing market has been segmented on the basis of type:
- Aramid & Blends
- PBI, Polyamide
- Cotton Fibers
- Laminated Polyester
- Polyolefin & Blends
- UHMW Polyethylene
- Others
- Market Segmentation, End-Use Industry:
The chemical protective clothing market has been segmented on the basis of end-use industry:
- Construction & Manufacturing
- Oil & Gas
- Healthcare/Medical
- Firefighting & Law Enforcement
- Mining
- Military
- Others
- Market Segmentation, by User Type:
The chemical protective clothing market has been segmented on the basis of user type:
- Industrial
- Personal
- Market Segmentation, by Region:
The chemical protective clothing market has been segmented on the basis region:
- Europe
- North America
- Asia-Pacific
- Middle East & Africa
- Latin America
Available Customizations:
With the given market data, MarketsandMarkets offers customizations according to the company�s specific needs. The following customization options (not limited to) are available for the report:
Regional Analysis
- Further breakdown of a region with respect to a particular country, additional application, and/or type
Country Information
- Additional country information (up to 3)
Company Information
- Detailed analysis and profiling of additional market players (up to 5)
The global chemical protective clothing market is projected to reach USD 1.29 Billion by 2020, registering a CAGR of 5.8% between 2015 and 2020. Rapid industrialization and increasing safety concerns against risky working environment is a key driver of the chemical protective clothing market. The construction & manufacturing industry consumed more than 32% of chemical protective clothing in 2014. In addition, the increasing stringent government requirements in the developed regions are expected to drive the increasing demand for chemical protective clothing during the forecast period.
The construction & manufacturing industry dominated the chemical protective clothing market. This is due to the rapid growth in construction & manufacturing industry and improving standard of living in the developing nations, which also led to development of other industries, driving the chemical protective clothing market. The use of chemical protective clothing in the military is expected to grow at the highest CAGR during the forecast period. The increasing use of chemical as well as biological weapons in war is forcing countries to provide better quality chemical protective clothing to their soldiers.
The chemical protective clothing market is classified on the basis of type, namely, aramid & blends, PBI, polyamide, cotton fibers, laminated polyester, polyolefin & blends, UHMW polyethylene, and others. It is dominated by aramid & blends mainly due to the increased demand for high-quality chemical protective clothing from end-use industries such as construction & manufacturing, oil & gas, healthcare, and others. PBI registered the highest CAGR between 2015 and 2020, owing to excellent long term protection in the extreme temperatures.
The chemical protective clothing market is classified on the basis of user type into industrial, and personal. Industrial is the major as well as the fastest growing user type, accounting for maximum share for the chemical protective clothing market in 2014. This is attributed to strict safety and precautionary measures imposed by government in every manufacturing facility.
Currently, Europe is the largest market for chemical protective clothing. Significant investment in R&D and strict government regulations are contributing to the high demand for the development and usage of high performance materials in the production of chemical protective clothing in the region. Additionally the increasing demand from end-use industries such as oil & gas, healthcare, firefighting, and construction & manufacturing in the region, are expected to drive the increasing demand for chemical protective clothing.
The Latin America is projected to be the fastest-growing market between 2015 and 2020. The growth of the chemical protective clothing market in Latin America and Asia- Pacific is propelled by the increasing demand from the construction & manufacturing, oil & gas, healthcare, and other end-use industries.
The major factor restraining the growth of the chemical protective clothing market is the high price of specialized chemical protective clothing. The manufacturing cost of chemical protective clothing is high, owing to the use of high-performing fabrics as well as multiple testing phases. Besides the high price of these clothing, price competition is another factor which is restraining the market growth. Customers demand high-end products at competitive prices resulting in high price sensitivity and low brand loyalty. Another factor restraining growth of the chemical protective clothing market is increasing automation in end-use industries which is reducing manpower size in industries which in-turn will have negative impact to the chemical protective clothing market.
Some of the important chemical protective clothing companies are Ansell Limited (Australia), 3M Company (U.S.), Honeywell International (U.S.), Lakeland Industries (U.S.), Kimberly Clark Corp (U.S.), MAS (U.S.), W. L. Gore & Associates Inc. (U.S.), Respirex (U.S.), Kappler Inc. (U.S.), E.I. DuPont DE Nemours (U.S.), International Enviroguard (U.S.), Delta Plus Group (U.S.), Sion Industries NV (Belgium), and Teijin limited (Japan). The players in this market need to compete with each other with respect to prices, and offer wide range of products to meet the market requirements.
To speak to our analyst for a discussion on the above findings, click Speak to Analyst
 Exclusive indicates content/data unique to MarketsandMarkets and not available with any competitors.
Table of Contents
1 Introduction (Page No. - 16)
1.1 Objectives of the Study
1.2 Market Definition
1.3 Market Scope
1.3.1 Markets Covered
1.3.2 Years Considered in the Report
1.3.3 Currency & Pricing
1.4 Limitations
1.5 Stakeholders
2 Research Methodology (Page No. - 19)
2.1 Research Data
2.1.1 Secondary Data
2.1.1.1 Key Data From Secondary Sources
2.1.2 Primary Data
2.1.2.1 Key Data From Primary Sources
2.1.2.2 Key Industry Insights
2.1.2.3 Breakdown of Primaries
2.2 Market Size Estimation
2.2.1 Bottom-Up Approach
2.2.2 Top-Down Approach
2.3 Market Breakdown & Data Triangulation
2.4 Research Assumptions and Limitations
3 Executive Summary (Page No. - 27)
4 Premium Insights (Page No. - 31)
4.1 Significant Opportunities for Chemical Protective Clothing Market
4.2 Market: Key Regions
4.3 Market in Europe
4.4 Market Attractiveness
4.5 Life Cycle Analysis, By Region
5 Market Overview (Page No. - 37)
5.1 Introduction
5.2 Market Segmentation
5.2.1 By Type
5.2.2 By Region
5.2.3 By End-Use Industry
5.2.4 By User Type
5.3 Market Dynamics
5.3.1 Drivers
5.3.1.1 Stringent Regulatory Requirement
5.3.1.2 Increased Focus on Work Safety
5.3.1.3 Growing Demand for Emerging Economies
5.3.2 Restraints
5.3.2.1 High Price of Specialized Clothing
5.3.2.2 Increased Automation in End-Use Industry
5.3.3 Opportunities
5.3.3.1 Use of Phase Change Material
5.3.3.2 Multifunctional Clothing
5.3.3.3 Nano Technology
5.4 Burning Issues
5.4.1 Increased Comfort Along With Functionality
6 Industry Trends (Page No. - 45)
6.1 Introduction
6.2 Value Chain Analysis
6.2.1 Raw Material
6.2.2 Making Protective Material
6.2.3 Making Chemical Protective Clothing
6.2.4 Distribution Network
6.2.5 End User
6.3 Porter�s Five Forces Analysis
6.3.1 Threat of New Entrants
6.3.2 Threat of Substitutes
6.3.3 Bargaining Power of Suppliers
6.3.4 Bargaining Power of Buyers
6.3.5 Intensity of Competitive Rivalry
6.4 Strategic Benchmarking
6.4.1 New Product Launches
6.4.2 Mergers & Acquisitions
7 Chemical Protective Clothing Market, By Type (Page No. - 50)
7.1 Introduction
7.2 Market Size & Projection
7.3 Aramid & Blends
7.4 PBI
7.5 Polyamide
7.6 Cotton Fiber
7.7 Laminated Polyesters
7.8 Polyolefin & Blends
7.9 UHMW Polyethylene
7.10 Others (Various Rubber Types and Leather)
8 Chemical Protective Clothing Market, By End-Use Industry (Page No. - 63)
8.1 Introduction
8.2 Market Size and Projection
8.3 Construction & Manufacturing
8.4 Oil & Gas
8.5 Healthcare/Medical
8.6 Firefighting & Law Enforcement
8.7 Military
8.8 Mining
8.9 Other End-Use Industries
9 Chemical Protective Clothing Market, By Region (Page No. - 75)
9.1 Introduction
9.2 Europe
9.2.1 Germany
9.2.2 France
9.2.3 Italy
9.2.4 U.K.
9.3 North America
9.3.1 U.S.
9.3.2 Canada
9.3.3 Mexico
9.4 Asia-Pacific
9.4.1 China
9.4.2 Japan
9.4.3 India
9.5 Middle East & Africa
9.5.1 Saudi Arabia
9.5.2 UAE
9.5.3 South Africa
9.5.4 Iraq
9.5.5 Kuwait
9.6 Latin America
9.6.1 Brazil
9.6.2 Venezuela
9.6.3 Argentina
9.6.4 Chile
10 Protective Clothing Market, By Users Type (Page No. - 104)
10.1 Introduction
10.2 Industrial Users
10.3 Personal Users
11 Competitive Landscape (Page No. - 108)
11.1 Overview
11.1.1 New Product Launches: the Most Popular Growth Strategy
11.2 Maximum Developments in North America Between 2011-2015
11.3 Maximum Developments in 2013
11.4 Ansell Limited: the Most Active Player
11.5 Competitive Situation & Trends
11.5.1 New Product Launches
11.5.2 Mergers & Acquisitions
11.5.3 Contracts & Agreements
12 Company Profiles (Page No. - 115)
(Overview, Financial*, Products & Services, Strategy, and Developments)
12.1 Introduction
12.2 Ansell Limited
12.3 Lakeland Industries, Inc.
12.4 Kimberly Clark Corp
12.5 3M Co.
12.6 Honeywell International Inc.
12.7 Sioen Industries NV
12.8 MSA
12.9 W. L. Gore & Associates, Inc.
12.10 Respirex
12.11 Kappler Inc.
12.12 E.I. Dupont Nemours and Co.
12.13 Delta Plus Group
12.14 Teijin Limited
12.15 International Enviroguard Inc.
*Details Might Not Be Captured in Case of Unlisted Companies
13 Appendix (Page No. - 143)
13.1 Insights From Industry Experts
13.2 Discussion Guide
13.3 Introducing RT: Real Time Market Intelligence
13.4 Available Customizations
13.5 Related Reports
List of Tables (65 Tables)
Table 1 U.S. Ppe Provisions and Mandatory Standards
Table 2 Direct & Hidden Costs of Workplace Accidents
Table 3 Chemical Protective Clothing Market Size, By Type, 2013�2020 (USD Million)
Table 4 Aramid & Blends Market Size for Chemical Protective Clothing, By Region, 2013�2020 (USD Million)
Table 5 PBI Market Size for Chemical Protective Clothing, By Region, 2013�2020 (USD Million)
Table 6 Polyamide Market Size for Chemical Protective Clothing, By Region, 2013�2020 (USD Million)
Table 7 Cotton Fibers Market Size, By Region, 2013�2020 (USD Million)
Table 8 Laminated Polyesters Market Size for Chemical Protective Clothing, By Region, 2013�2020 (USD Million)
Table 9 Polyolefin & Blends Market Size for Chemical Protective Clothing, By Region, 2013�2020 (USD Million)
Table 10 UHMW Polyethylene & Blends Market Size for Chemical Protective Clothing, By Region, 2013�2020 (USD Million)
Table 11 Other Material Market Size for Chemical Protective Clothing, By Region, 2013�2020 (USD Million)
Table 12 Chemical Protective Clothing Market Size, By End-Use Industry, 2013�2020 (USD Million)
Table 13 Market Size for Construction & Manufacturing Industry, By Region, 2013�2020 (USD Million)
Table 14 Market Size for Oil & Gas Industry, By Region, 2013�2020 (USD Million)
Table 15 Chemical Protective Clothing Market Size for Healthcare/Medical Industry, By Region, 2013�2020 (USD Million)
Table 16 Chemical Protective Clothing Market Size for Firefighting & Law Enforcement, By Region, 2013-2020 (USD Million)
Table 17 Market Size for Military, By Region, 2013�2020 (USD Million)
Table 18 Market Size for Mining Industry, By Region, 2013�2020 (USD Million)
Table 19 Market Size for Other End-Use Industries, By Region, 2013�2020 (USD Million)
Table 20 Market Size, By Region, 2013�2020 (USD Million)
Table 21 Europe: Chemical Protective Clothing Market Size, By Country, 2013�2020 (USD Million)
Table 22 Europe: Market Size, By Type, 2013�2020 (USD Million)
Table 23 Europe: Market Size, By End-Use Industry, 2013�2020 (USD Million)
Table 24 Europe: Market Size , By Users Type, 2013�2020 (USD Million)
Table 25 Germany: Market, By Type, 2013-2020 (USD Million)
Table 26 France: Chemical Protective Clothing, By Type, 2013-2020 (USD Millon)
Table 27 Italy: Chemical Protective Clothing, By Type, 2013-2020 (USD Millon)
Table 28 U.K.: Chemical Protective Clothing, By Type, 2013-2020 (USD Millon)
Table 29 North America: Chemical Protective Clothing Market Size ,By Country, 2013�2020 (USD Million)
Table 30 North America: Market Size , By Type, 2013�2020 (USD Million)
Table 31 North America: Market Size By End-Use Industry, 2013�2020 (USD Million)
Table 32 North America: Market Size, By Users Type, 2013�2020 (USD Million)
Table 33 U.S.: Market, By Type, 2013-2020 (USD Million)
Table 34 Canada: Market, By Type, 2013-2020 (USD Millon)
Table 35 Mexico: Chemical Protective Clothing, By Type, 2013-2020 (USD Millon)
Table 36 Asia-Pacific: Chemical Protective Clothing Market Size, By Country, 2013�2020 (USD Million)
Table 37 Asia-Pacific: Market Size , By Type, 2013�2020 (USD Million)
Table 38 Asia-Pacific: Market Size, By End-Use Industry, 2013�2020 (USD Million)
Table 39 Asia-Pacific: Market Size , By Users Type, 2013�2020 (USD Million)
Table 40 China: Market, By Type, 2013-2020 (USD Million)
Table 41 Japan: Market, By Type, 2013-2020 (USD Millon)
Table 42 India: Chemical Protective Clothing, By Type, 2013-2020 (USD Millon)
Table 43 Middle East & Africa: Market Size, By Country, 2013�2020 (USD Million)
Table 44 Middle East & Africa: Market Size , By Type, 2013�2020 (USD Million)
Table 45 Middle East & Africa: Market Size, By End-Use Industry, 2013�2020 (USD Million)
Table 46 Middle East & Africa: Market Size, By Users Type, 2013�2020 (USD Million)
Table 47 Saudi Arabia: Market Size, By Type, 2013-2020 (USD Million)
Table 48 UAE: Market Size, By Type, 2013-2020 (USD Millon)
Table 49 South Africa: Market Size, By Type, 2013-2020 (USD Millon)
Table 50 Iraq: Market Size, By Type, 2013-2020 (USD Millon)
Table 51 Kuwait: Market Size, By Type, 2013-2020 (USD Millon)
Table 52 Latin America: Chemical Protective Clothing Market Size, By Country, 2013�2020 (USD Million)
Table 53 Latin America: Market Size, By Type, 2013�2020 (USD Million)
Table 54 Latin America: Market Size, By End-Use Industry, 2013�2020 (USD Million)
Table 55 Latin America: Market Size, By Users Type, 2013�2020 (USD Million)
Table 56 Brazil: Market Size, By Type, 2013-2020 (USD Million)
Table 57 Venezuela: Market Size, By Type, 2013-2020 (USD Millon)
Table 58 Argentina: Market Size, By Type, 2013-2020 (USD Millon)
Table 59 Chile: Market Size, By Type, 2013-2020 (USD Millon)
Table 60 Chemical Protective Clothing Market Size, By Users Type, 2013�2020 (USD Million)
Table 61 Chemical Protective Clothing Market Size, By Industrial Users, 2013�2020 (USD Million)
Table 62 Chemical Protective Clothing Market Size, By Personal Users, 2013�2020 (USD Million)
Table 63 New Product Launches, 2011�2015
Table 64 Mergers & Acquisition, 2011�2015
Table 65 Contracts & Agreements, 2011�2015
List of Figures (69 Figures)
Figure 1 Chemical Protective Clothing Market: Research Design
Figure 2 Key Data From Secondary Sources
Figure 3 Key Data From Primary Sources
Figure 4 Breakdown of Primary Interviews, By Company Type, Designation, & Region
Figure 5 Market Size Estimation: Bottom-Up Approach
Figure 6 Market Size Estimation: Top-Down Approach
Figure 7 Market Breakdown & Data Triangulation
Figure 8 Aramid & Blends to Dominate the Chemical Protective Clothing Market, 2015�2020
Figure 9 Chemical Protective Clothing for Military to Register Highest CAGR Between 2015 and 2020
Figure 10 Latin America and Asia-Pacific to Register Higher CAGR Between 2015 and 2020
Figure 11 Europe Market to Account for the Largest Share of the Global Chemical Protective Clothing Market in 2015
Figure 12 High Growth in the Chemical Protective Clothing Market Between 2015 and 2020
Figure 13 Europe Expected to Be the Key Market for Chemical Protective Clothing Between 2015 and 2020
Figure 14 Germany Accounted for the Largest Share in Europe in 2014
Figure 15 Rapid Industrialization in Emerging Regions to Boost Demand for Chemical Protective Clothing Between 2015 and 2020
Figure 16 North America and Europe Expected to Reach Maturity Stage During the Forecast Period
Figure 17 Chemical Protective Clothing, Market Segmentation
Figure 18 Overview of the Forces Governing the Chemical Protective Clothing Market
Figure 19 PCM: Process Description
Figure 20 Value Chain Analysis for Chemical Protective Clothing: Raw Material Accounts for Biggest Value Addition
Figure 21 Porter�s Five Forces Analysis
Figure 22 Strategic Benchmarking: Ansell Limited Introduced A New Product to Protect Against Chemical, Biological, and Nuclear Threats
Figure 23 Strategic Benchmarking: Ansell Limited and 3M Co Improved Their Product Offerings Through Acquisitions
Figure 24 Aramid & Blends is the Most Used Fiber for Production of Chemical Protective Clothing
Figure 25 Europe Projected to Be the Largest User of Aramid & Blends for Production of Chemical Protective Clothing From 2015 to 2020
Figure 26 North America Projected to Be the Largest User of PBI for Producing Chemical Protective Clothing From 2015 to 2020
Figure 27 European Market to Be the Largest User of Polyamide Between 2015 and 2020
Figure 28 Cotton Fiber to Be Most Used Fiber in Asia-Pacific for Producing Chemical Protective Clothing Between 2015 and 2020
Figure 29 Asia Pacific Market Estimated to Be Largest Consumer of Laminated Polyester During Forecast Period (2015-2020)
Figure 30 European Market Estimated to Be Largest User of Polyolefin & Blends Between 2015 and 2020
Figure 31 Asia-Pacific Market to Be Largest Consumer of UHMW Polyethylene Between 2015 and 2020
Figure 32 European Market Expected to Be Largest Consumer for Other Fibers During Forecast Period (2015-2020)
Figure 33 Military End-Use to Register the Highest CAGR in Next Five Years (2015�2020)
Figure 34 Asia-Pacific to Be Largest Market for Chemical Protective Clothing in Construction & Manufacturing Industry Between 2015 and 2020
Figure 35 North America to Be A Major Market for Chemical Protective Clothing in Oil & Gas Industry Between 2015 and 2020
Figure 36 European Chemical Protective Clothing Market Expected to Dominate the Market in Healthcare/Medical Industry During Forecast Period (2015-2020)
Figure 37 Europe to Surpass the Chemical Protective Clothing Market in Firefighting & Law Enforcement Industry By 2020
Figure 38 Asia-Pacific is the Largest Market for Chemical Protective Clothing in Military During Forecast Period
Figure 39 Asia-Pacific Accounts for Biggest Market Share in Global Chemical Protective Clothing Market in Mining Segment Between 2015 and 2020
Figure 40 North America and Europe Dominates the Chemical Protective Clothing Market During Forecast Period (2015-2020)
Figure 41 Regional Snapshot (2015-2020): India and Brazil Emerging as Strategic Locations for Chemical Protective Clothing Market
Figure 42 Europe Market Snapshot: Chemical Protective Clothing (2014�2020)
Figure 43 North America Snapshot: Chemical Protective Clothing (2014�2020)
Figure 44 Asia-Pacific Market Snapshot: Chemical Protective Clothing (2014�2020)
Figure 45 Middle East & Africa Chemical Protective Clothing Market Snapshot: UAE and Saudi Arabia to Be the Driving Markets (2014�2020)
Figure 46 Latin America Market Snapshot: Chemical Protective Clothing (2014�2020)
Figure 47 Latin America, Middle East & Africa, and Asia-Pacific Likely to Be Fastest-Growing Markets for Chemical Protective Clothing Between 2015 and 2020
Figure 48 Industrial Use of Chemical Protective Clothing Expected to Dominate Over Personal Use Between 2015 and 2020
Figure 49 Maximum Companies Adopted Organic Growth Strategies Between 2011 and 2015
Figure 50 Key Growth Strategies in Chemical Protective Clothing Market, 2011�2015
Figure 51 New Product Launches in North America Made It the Most Active Region Between 2011 and 2015
Figure 52 Market Developmental Share, 2011�2015
Figure 53 Market: Growth Strategies, By Company, 2011�2015
Figure 54 Regional Revenue Mix of Top 5 Market Players
Figure 55 Ansell Limited.: Company Snapshot
Figure 56 Ansell Limited: SWOT Analysis
Figure 57 Lakeland Industries, Inc: Company Snapshot
Figure 58 Lakeland Industries, Inc: SWOT Analysis
Figure 59 Kimberly Clark Corp: Company Snapshot
Figure 60 Kimberly Clark Corp: SWOT Analysis
Figure 61 3M Co.: Company Snapshot
Figure 62 Honeywell International Inc: Company Snapshot
Figure 63 Sioen Indutries NV: Company Snapshot
Figure 64 Sioen Industries NV: SWOT Analysis
Figure 65 MSA: Company Snapshot
Figure 66 E.I. Dupont De Nemours and Co.: Company Snapshot
Figure 67 Delta Plus Group: Company Snapshot
Figure 68 Teijin Limited.: Company Snapshot
Figure 69 Teijin Limited: SWOT Analysis


Growth opportunities and latent adjacency in Chemical Protective Clothing Market