Chemiluminescence Immunoassay Market by Product (Instrument, Consumable), Technology (Chemiluminescence Enzyme, Microparticle Chemiluminescence), Sample (Blood, Urine), Application (Infectious Disease, Oncology), End User - Global Forecast to 2028
Market Growth Outlook Summary
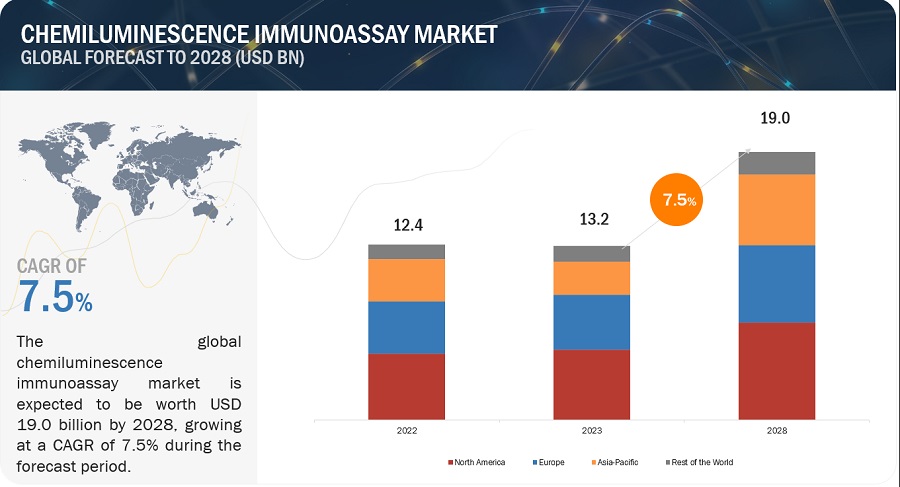
The global chemiluminescence immunoassay market growth forecasted to transform from $13.2 billion in 2023 to $19.0 billion by 2028, driven by a CAGR of 7.5%. Market growth is largely driven by the increasing prevalence of infectious diseases and cancer and the growing geriatric population in chemiluminescence immunoassay. On the other hand, the unfavorable reimbursement scenario and lack of skilled professionals may restrain the growth of this market to a certain extent.
Attractive Opportunities in the Chemiluminescence Immunoassay Market
To know about the assumptions considered for the study, Request for Free Sample Report
Chemiluminescence Immunoassay Market Dynamics
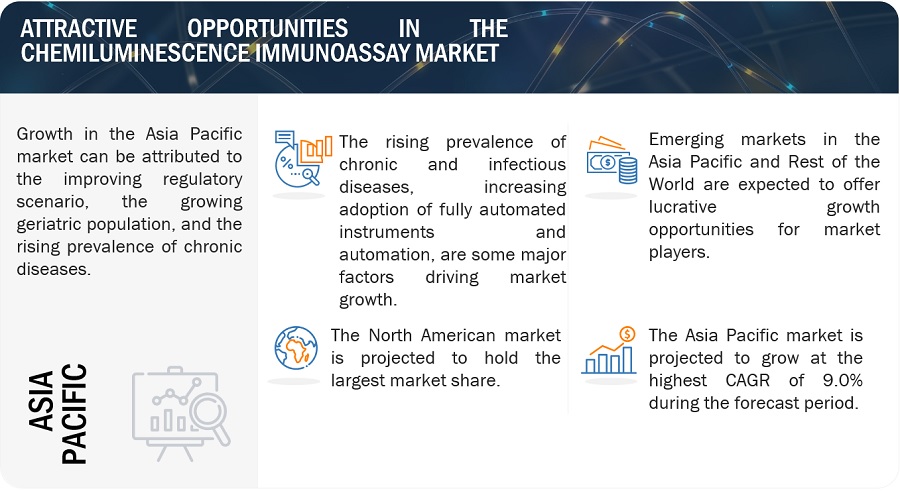
DRIVER: Rising incidence of chronic and infectious diseases across the globe
During recent years, there has been a significant rise in the occurrence of infectious as well as diseases. With rising prevalence the rate of their diagnosis has increased significantly across the globe. The WHO underlined the global concern of HIV, which claimed over 38.4 million in 2021. Due to the efforts of international organizations and the WHO, the disease has been managed with antiviral therapies. Diagnosis has substantially helped disease management. Besides, according to the IDF Diabetes Atlas, globally, about 537 million adults (20–79 years) are living with diabetes—1 in 10. This number is predicted to rise to 643 million by 2030 and 783 million by 2045. Over 3 in 4 adults with diabetes live in low- and middle-income countries. Diabetes is responsible for 6.7 million deaths in 2021—1 every 5 seconds. The increased prevalence of infectious and chronic diseases is hence a driving factor for the growth of the CLIA market.
OPPORTUNITY: Increasing number of collaborations and partnerships in the CLIA market
Collaboration and partnership are essential in the field of CLIA to drive innovation, expand applications, and advance the development and adoption of new technologies. Here are some key aspects of collaboration and partnership in the context of CLIA. Some of the recent developments include in February 2022, Sysmex established a business tie-up with KAINOS Laboratories to strengthen the former company’s offering of immunochemistry diagnostic reagents and develop diagnostic reagents for HISCL systems. These developments help in the growth of both the players involved, which eventually helps in the growth of the market.
RESTRAINT: High cost of CLIA related products
The high cost of CLIA systems and reagents can be a significant challenge to its widespread adoption and implementation. CLIA requires specialized equipment and instrumentation, including chemiluminescence analyzers, luminometers, and other laboratory devices. These instruments are often high-end and technologically advanced, which come with significantly higher costs for their purchase, maintenance, and calibration. Also, CLIA utilizes specific reagents and consumables, such as antibodies, detection agents, substrates, and assay plates. These systems may be sometimes unaffordable to small scale laboratories, or academic or research organizations which can hamper the adoption of CLIA systems, hence impacting growth of the market.
CHALLENGE: Lack of skilled professionals and aging workforce
The dearth of a skilled workforce has been a challenge for several decades, resulting in an aging workforce and declining enrolment in training programs. It takes almost five to ten years of continuous practice in clinical laboratory work for technicians to gain expertise.
Europe reportedly has low numbers of clinical technicians. The Gatsby Foundation stated in 2019 that over 1.5 million people serve in the health, engineering, science, and technology domains. Over 50,000 retire every year, and 700,000 technicians will be required to meet the soaring demands in the next decade. The Duquesne University School of Nursing has stated that by 2025, there will be a shortage of over 29,400 nurse practitioners and more than 400,000 home health aides.
Chemiluminescence Immunoassay Ecosystem/Market Map
Consumables segment accounted for the largest share of the chemiluminescence immunoassay industry in 2022, by product
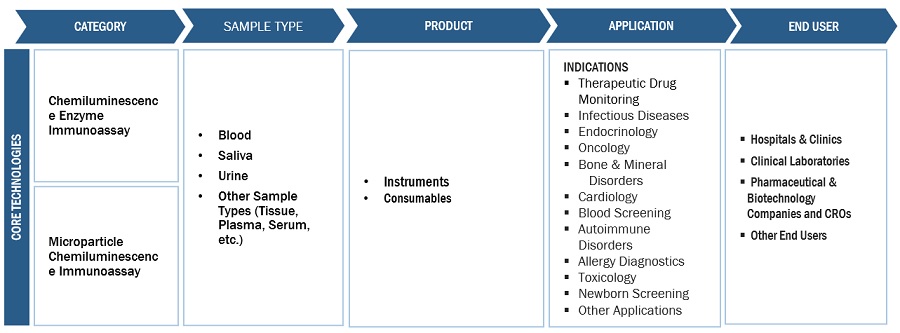
Based on product, the chemiluminescence immunoassay market is segmented as instruments and consumables. The consumables segment accounted for a significant share in the market in 2022. The recurring expenses associated with the frequent purchase of reagents & kits is a significant factor contributing to the market's growth. Besides, the availability of advanced consumables that offer better performance and reliability attributes to their widespread adoption resulting to the segment's growth.
Lab tests segment accounted for the largest share in the chemiluminescence immunoassay industry in 2022, by test type
On the basis of technology, the global chemiluminescence immunoassay market is categorized into Chemiluminescence Enzyme Technology (CLEIA), Electrochemiluminescence immunoassay (ECLI), and Microparticle Chemiluminescence Immunoassay. In 2022, the CLEIA segment held the largest share in the market, by technology. The growth of the segment can be attributed to its high sensitivity and a broad dynamic range of applications ranging from clinical diagnostics, pharmaceutical research, environmental analysis, and food safety testing, among others.
Blood sample segment accounted for the largest share in the chemiluminescence immunoassay industry in 2022, by sample type
Based on sample type, the chemiluminescence immunoassay market has been segmented into blood, saliva, urine, and other sample types. In 2022, the blood segment accounted for the largest share of the market. Blood enables the diagnosis of various indications that are not easily diagnosed using urine or saliva sample. Besides, with the rise in the number of blood donations and initiatives in support of blood screening, the segment is anticipated to also grow at the highest rate during the forecast period.
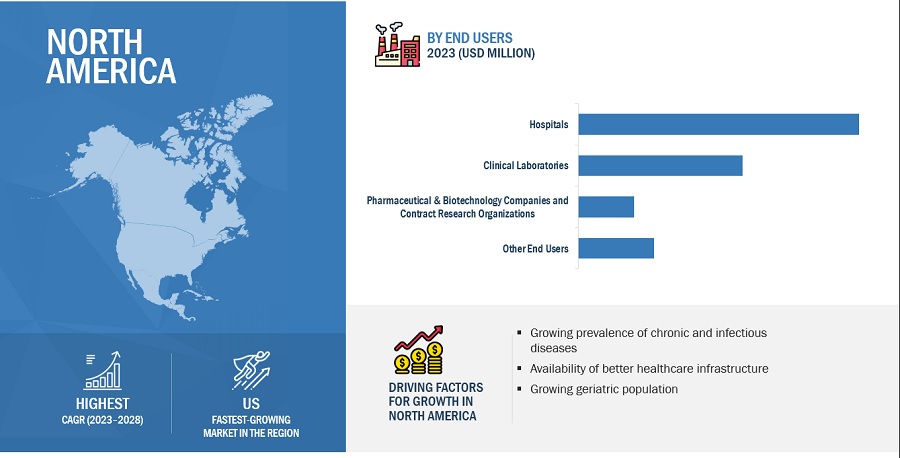
North America accounted for the largest share of the chemiluminescence immunoassay industry in 2022
The chemiluminescence immunoassay market is segmented into four major regions: North America, Europe, the Asia Pacific, and the Rest of the World. In 2022, North America emerged as the leading contributor, claiming the largest portion of the market share in the chemiluminescence immunoassay industry. With the presence of major players in the region, North America has witnessed various technological advancements in the field of chemiluminescence immunoassay. These companies have significant expertise, resources, and established sales networks, which contribute to the region’s market dominance. Examples of prominent chemiluminescence immunoassay companies in North America include Danaher Corporation (US) and Abbott Laboratories (US).
To know about the assumptions considered for the study, download the pdf brochure
The major players in this market are F. Hoffmann-La Roche Ltd. (Switzerland), Danaher Corporation. (US), Siemens Healthineers AG (Germany), Abbott Laboratories (US), and DiaSorin S.p.A. (Italy). The market leadership of these players is owing to their comprehensive product portfolios and expansive global footprint. These dominant market players have several advantages, including strong research and development budgets,strong marketing and distribution networks, and well-established brand recognition.
Scope of the Chemiluminescence Immunoassay Industry
|
Report Metric |
Details |
|
Market Revenue in 2023 |
$13.2 billion |
|
Projected Revenue by 2028 |
$19.0 billion |
|
Revenue Rate |
Poised to Grow at a CAGR of 7.5% |
|
Market Driver |
Rising incidence of chronic and infectious diseases across the globe |
|
Market Opportunity |
Increasing number of collaborations and partnerships in the CLIA market |
This research report categorizes the Chemiluminescence Immunoassay Market to forecast revenue and analyze trends in each of the following submarkets:
By Region
- North America
- Europe
- Asia Pacific
- Rest of the World
By Product
- Consumables
- Instruments
By Technology
- Chemiluminescence Enzyme Technology (CLEIA)
- Electrochemiluminescence immunoassay (ECLI)
- Microparticle Chemiluminescence Immunoassay
By Sample Type
- Blood
- Urine
- Saliva
- Other Sample Types
By Application
- Infectious Disease
- Endocrinology
- Oncology
- Cardiology
- Allergy Diagnostics
- Autoimmune Disorders
- Blood Screening
- Bone & Mineral Disorders
- Toxicology
- Newborn Screening
- Therapeutic Drug Monitoring
- Metabolic Disorder
- Gastroenterology
- Neurology
- Respiratory
- Other Applications
By End User
- Hospitals
- Clinical Laboratories
- Pharmaceuticals & Biotechnology Companies and Contract Research Organizations
- Other End Users
Recent Developments of Chemiluminescence Immunoassay Industry
- In May 2023, EUROIMMUN’s parent company PerkinElmer’s life science and diagnostics business segment, has been rebranded as Revvity.
- In December 2022, Mindray launched CLIA-based assays, IL-6, PCT, and sCD14-S, which have high sensitivity, a wide linearity range, great precision, and good anti-interference ability.
- In December 2022, Sysmex received manufacturing and marketing approval in Japan for the HISCL β-Amyloid 1-42 Assay Kit and the HISCL β-Amyloid 1-40 Assay Kit to measure amyloid beta (Aβ) in the blood.
- In November 2022 Getein Biotech, Inc. launched MAGICL 6000, a compact and innovative chemiluminescence immunoassay analyzer used in mid to high-workflow laboratories
- In June 2022, QuidelOrtho Corporation was formed through a transaction between Quidel Corporation and Ortho Clinical Diagnostics to form a leading in vitro diagnostics company.
Frequently Asked Questions (FAQ):
What is the projected market revenue value of the global chemiluminescence immunoassay market?
The global chemiluminescence immunoassay market boasts a total revenue value of $19.0 billion by 2028.
What is the estimated growth rate (CAGR) of the global chemiluminescence immunoassay market?
The global chemiluminescence immunoassay market has an estimated compound annual growth rate (CAGR) of 7.5% and a revenue size in the region of $13.2 billion in 2023.
To speak to our analyst for a discussion on the above findings, click Speak to Analyst


- 5.1 INTRODUCTION
-
5.2 MARKET DYNAMICSDRIVERS- Increasing incidences of chronic and infectious diseases globally- Advancements in improving chemiluminescence immunoassay technologies in recent years- Growth of biotechnology and biopharmaceutical industries- Rapid increase in geriatric population globally- Shift toward personalized medicines and individualized treatment decisionsRESTRAINTS- High cost of chemiluminescence systems and reagents- Lack of regular quality control procedures for monitoring and detecting cross-reactivity and interferenceOPPORTUNITIES- High growth prospects for players in emerging economies- Increasing number of collaborations and partnershipsCHALLENGES- Unfavorable reimbursement scenario and budgetary constraints in healthcare systems- Lack of skilled professionals and aging workforce
- 5.3 VALUE CHAIN ANALYSIS
- 5.4 SUPPLY CHAIN ANALYSIS
-
5.5 PORTER’S FIVE FORCES ANALYSISDEGREE OF COMPETITIONBARGAINING POWER OF SUPPLIERSBARGAINING POWER OF BUYERSTHREAT OF SUBSTITUTESTHREAT OF NEW ENTRANTS
-
5.6 KEY STAKEHOLDERS AND BUYING CRITERIAKEY STAKEHOLDERS IN BUYING PROCESSBUYING CRITERIA
-
5.7 REGULATORY LANDSCAPEUSCANADAEUROPEJAPANCHINAINDIAINDONESIARUSSIASAUDI ARABIAMEXICOBRAZILSOUTH KOREAMIDDLE EASTAFRICA
- 5.8 TECHNOLOGY ANALYSIS
-
5.9 TRADE ANALYSISTRADE ANALYSIS FOR CHEMILUMINESCENCE IMMUNOASSAYS
-
5.10 ECOSYSTEM MAPPINGROLE IN ECOSYSTEMKEY PLAYERS OPERATING IN CHEMILUMINESCENCE IMMUNOASSAY MARKET
-
5.11 PATENT ANALYSIS
- 5.12 KEY CONFERENCES AND EVENTS IN 2023–2024
-
5.13 PRICING ANALYSISAVERAGE SELLING PRICE, BY APPLICATION (KEY PLAYERS)
-
5.14 TRENDS/DISRUPTIONS IMPACTING CUSTOMERS’ BUSINESSES
- 6.1 INTRODUCTION
-
6.2 CONSUMABLESCONSUMABLES TO ACCOUNT FOR LARGEST SHARE OF CHEMILUMINESCENCE IMMUNOASSAY MARKET DURING STUDY PERIOD
-
6.3 INSTRUMENTSINCREASING ADVANCES WITH HIGH-THROUGHPUT CAPACITIES AND GROWING AUTOMATION TRENDS TO DRIVE MARKET
- 7.1 INTRODUCTION
-
7.2 CHEMILUMINESCENCE ENZYMEHIGH RELIABILITY OF BLOOD TESTS IN CLINICAL DIAGNOSTICS AND PHARMACEUTICAL RESEARCH TO DRIVE MARKET
-
7.3 ELECTROCHEMILUMINESCENCE IMMUNOASSAYINCREASED GENERATION OF EXCITED STATES THROUGH BETTER ELECTRODE VARIATION TO DRIVE MARKET
-
7.4 MICROPARTICLE CHEMILUMINESCENCE IMMUNOASSAYHIGHER COSTS AND GREATER CHANCES OF CROSS-REACTIVITY DUE TO MULTIPLEXING TO LIMIT MARKET
- 8.1 INTRODUCTION
-
8.2 BLOODHIGH RELIABILITY OF BLOOD TESTS FOR IMMUNOASSAY DIAGNOSTIC PROCEDURES AND HEALTH SCREENING TO DRIVE MARKET
-
8.3 URINEINCREASING USE IN LAW ENFORCEMENT AND DRUG TESTING CENTERS TO DRIVE MARKET
-
8.4 SALIVACONVENIENCE AND EASY TESTING OF BIOLOGICALLY ACTIVE PARTS OF HORMONES TO DRIVE MARKET
- 8.5 OTHER SAMPLE TYPES
- 9.1 INTRODUCTION
-
9.2 INFECTIOUS DISEASESRISING PREVALENCE OF INFECTIOUS DISEASES GLOBALLY AMONG ALL AGE GROUPS TO DRIVE MARKET
-
9.3 ENDOCRINOLOGYRISING INCIDENCES OF DIABETES GLOBALLY TO DRIVE MARKET
-
9.4 ONCOLOGYRISING BURDEN OF CANCER AND EMPHASIS ON EARLY DISEASE DIAGNOSIS TO DRIVE MARKET
-
9.5 CARDIOLOGYHIGH BURDEN OF CARDIOVASCULAR DISEASES AMONG ALL AGE GROUPS TO DRIVE MARKET
-
9.6 ALLERGY DIAGNOSTICSGROWING PREVALENCE OF ALLERGIES TO REGISTER INCREASED DEMAND FOR CHEMILUMINESCENCE IMMUNOASSAYS
-
9.7 BLOOD SCREENINGRISING VOLUME OF BLOOD DONATIONS AND INCREASING INCIDENCES OF BLOOD-RELATED DISORDERS TO DRIVE MARKET
-
9.8 AUTOIMMUNE DISORDERSGROWING PREVALENCE OF AUTOIMMUNE DISORDERS AND RISING ECONOMIC BURDEN OF DISEASE MANAGEMENT TO DRIVE MARKET
-
9.9 BONE & MINERAL DISORDERSHIGH DISORDER PREVALENCE TO INDICATE STRONG GROWTH OPPORTUNITIES FOR IMMUNOASSAYS
-
9.10 TOXICOLOGYINCREASED DRUG-OF-ABUSE TESTING AND HIGHER ILLICIT DRUG CONSUMPTION TO DRIVE MARKET
-
9.11 NEWBORN SCREENINGCHEMILUMINESCENCE IMMUNOASSAYS TO BE ROUTINELY USED AS FIRST-TIER NEWBORN SCREENING PROTOCOL
-
9.12 THERAPEUTIC DRUG MONITORINGRAPID DETECTION TIME AND GOOD SPECIFICITY TO DRIVE MARKET
-
9.13 METABOLIC DISORDERSRISING PREVALENCE OF METABOLIC DISORDERS TO DRIVE MARKET
-
9.14 GASTROENTEROLOGYINCREASING INCIDENCE OF GASTROINTESTINAL TRACT INFECTIONS AND SERIOUS GASTRIC DISEASES TO DRIVE MARKET
-
9.15 NEUROLOGYEFFECTIVE DETECTION, MONITORING, AND MANAGEMENT OF NEUROLOGICAL DISORDERS TO DRIVE SEGMENT
-
9.16 RESPIRATORYEASY DETECTION AND DIAGNOSIS OF RESPIRATORY DISEASES TO DRIVE MARKET
- 9.17 OTHER APPLICATIONS
- 10.1 INTRODUCTION
-
10.2 HOSPITALSGROWING PATIENT POPULATION AND TESTING VOLUMES TO DRIVE MARKET
-
10.3 CLINICAL LABORATORIESRISING CLINICAL TEST VOLUMES AND REQUIREMENTS TO DRIVE SEGMENT
-
10.4 PHARMACEUTICAL & BIOTECHNOLOGY COMPANIES AND CONTRACT RESEARCH ORGANIZATIONSRISING DRUG DISCOVERIES AND CLINICAL STUDIES TO DRIVE MARKET
- 10.5 OTHER END USERS
- 11.1 INTRODUCTION
-
11.2 NORTH AMERICAIMPACT OF ECONOMIC RECESSION ON NORTH AMERICAUS- US to hold largest share in North American chemiluminescence immunoassay market during forecast periodCANADA- Rising government initiatives and funding for early disease diagnosis to drive market
-
11.3 EUROPEIMPACT OF ECONOMIC RECESSION ON EUROPEGERMANY- Growing investments in clinical diagnostics research and increasing government spending on healthcare to drive marketFRANCE- Favorable reimbursement policies and increased investments in diagnostics to drive marketUK- Increasing number of accredited clinical laboratories and growing accessibility to IVD tests to drive marketITALY- Growing geriatric population and increasing support for research to drive marketSPAIN- Rising adoption of technologically advanced immunoassay systems to drive marketREST OF EUROPE
-
11.4 ASIA PACIFICIMPACT OF ECONOMIC RECESSION ON ASIA PACIFICJAPAN- Growing investments in clinical diagnostics research to drive marketCHINA- China to register highest growth rate in Asia Pacific chemiluminescence immunoassay market during study periodINDIA- Growing medical tourism and healthcare infrastructure to drive marketSOUTH KOREA- Rising healthcare spending for innovative IVD technologies to drive marketREST OF ASIA PACIFIC
-
11.5 REST OF THE WORLDIMPACT OF ECONOMIC RECESSION ON REST OF THE WORLDLATIN AMERICA- Rising incidence of infectious diseases and increasing geriatric population to drive marketMIDDLE EAST & AFRICA- Lack of skilled laboratory personnel and unfavorable reimbursement policies to limit market

- 12.1 OVERVIEW
- 12.2 STRATEGIES ADOPTED BY KEY PLAYERS
- 12.3 REVENUE ANALYSIS OF TOP MARKET PLAYERS
- 12.4 MARKET SHARE ANALYSIS
-
12.5 COMPANY EVALUATION MATRIX FOR KEY PLAYERSSTARSEMERGING LEADERSPERVASIVE PLAYERSPARTICIPANTS
-
12.6 COMPANY EVALUATION MATRIX FOR SMES/START-UPSPROGRESSIVE COMPANIESSTARTING BLOCKSRESPONSIVE COMPANIESDYNAMIC COMPANIES
- 12.7 COMPETITIVE BENCHMARKING
- 12.8 COMPANY FOOTPRINT ANALYSIS
-
12.9 COMPETITIVE SCENARIOKEY PRODUCT LAUNCHES AND APPROVALSKEY DEALSOTHER KEY DEVELOPMENTS
-
13.1 KEY PLAYERSF. HOFFMANN-LA ROCHE LTD.- Business overview- Products offered- MnM viewDANAHER CORPORATION- Business overview- Products offered- MnM viewSIEMENS HEALTHINEERS AG- Business overview- Products offered- MnM viewDIASORIN S.P.A.- Business overview- Products offeredABBOTT LABORATORIES- Business overview- Products offered- Recent developmentsSHENZHEN MINDRAY BIO-MEDICAL ELECTRONICS CO., LTD.- Business overview- Products offered- Recent developmentsSYSMEX CORPORATION- Business overview- Products offered- Recent developmentsDIATRON- Business overview- Products offeredGETEIN BIOTECH, INC.- Business overview- Products offered- Recent developmentsWERFEN- Business overview- Products offered- Recent developmentsQUIDELORTHO CORPORATION- Business overview- Products offered- Recent developmentsEUROIMMUN MEDIZINISCHE LABORDIAGNOSTIKA AG- Business overview- Products offered- Recent developments
-
13.2 OTHER PLAYERSMERCK KGAATOSOH CORPORATION (TOSOH BIOSCIENCE)TRIVITRON HEALTHCAREABNOVA CORPORATIONELABSCIENCEMACCURA BIOTECHNOLOGY CO., LTD.AUTOBIO DIAGNOSTICS CO., LTDJIANGSU ZECEN BIOTECH CO., LTDRAYTO LIFE AND ANALYTICAL SCIENCES CO., LTD.DAAN GENE CO., LTD.DYNEX TECHNOLOGIES, INC.ZYBIO INC.WIENER LABORATORIOS SAICTIANJIN ERA BIOLOGY TECHNOLOGY CO., LTD.
- 14.1 DISCUSSION GUIDE
- 14.2 KNOWLEDGESTORE: MARKETSANDMARKETS’ SUBSCRIPTION PORTAL
- 14.3 CUSTOMIZATION OPTIONS
- 14.4 RELATED REPORTS
- 14.5 AUTHOR DETAILS
- TABLE 1 RISK ASSESSMENT: CHEMILUMINESCENCE IMMUNOASSAY MARKET
- TABLE 2 HIGH CONSOLIDATION IN MARKET TO RESTRICT ENTRY OF NEW PLAYERS
- TABLE 3 INFLUENCE OF STAKEHOLDERS ON BUYING PROCESS FOR END USERS
- TABLE 4 KEY BUYING CRITERIA, BY END USER
- TABLE 5 US: CLASSIFICATION OF IMMUNOASSAY PRODUCTS
- TABLE 6 EUROPE: CLASSIFICATION OF IVD DEVICES
- TABLE 7 JAPAN: CLASSIFICATION OF IVD REAGENTS
- TABLE 8 JAPAN: TIME, COST, AND COMPLEXITY OF REGISTRATION PROCESS
- TABLE 9 CHINA: TIME, COST, AND COMPLEXITY OF REGISTRATION PROCESS
- TABLE 10 INDONESIA: REGISTRATION PROCESS FOR IVD DEVICES
- TABLE 11 RUSSIA: CLASSIFICATION OF IVD DEVICES
- TABLE 12 SAUDI ARABIA: TIME, COST, AND COMPLEXITY OF REGISTRATION PROCESS
- TABLE 13 MEXICO: TIME, COST, AND COMPLEXITY OF REGISTRATION PROCESS
- TABLE 14 SOUTH KOREA: TIME, COST, AND COMPLEXITY OF REGISTRATION PROCESS
- TABLE 15 RECENT PRODUCT LAUNCHES WITH ADVANCED TECHNOLOGIES IN CHEMILUMINESCENCE IMMUNOASSAY MARKET
- TABLE 16 IMPORT DATA FOR HS CODE 902780, BY COUNTRY, 2018–2022 (USD MILLION)
- TABLE 17 EXPORT DATA FOR HS CODE 902780, BY COUNTRY, 2018–2022 (USD MILLION)
- TABLE 18 LIST OF CONFERENCES AND EVENTS IN 2023–2024
- TABLE 19 PRICE RANGE OFFERED BY KEY PLAYERS, BY APPLICATION (USD)
- TABLE 20 CHEMILUMINESCENCE IMMUNOASSAY MARKET, BY PRODUCT, 2021–2028 (USD MILLION)
- TABLE 21 LIST OF CHEMILUMINESCENCE IMMUNOASSAY CONSUMABLES AVAILABLE
- TABLE 22 CHEMILUMINESCENCE IMMUNOASSAY MARKET FOR CONSUMABLES, BY REGION, 2021–2028 (USD MILLION)
- TABLE 23 LIST OF CHEMILUMINESCENCE IMMUNOASSAY INSTRUMENTS AVAILABLE
- TABLE 24 CHEMILUMINESCENCE IMMUNOASSAY MARKET FOR INSTRUMENTS, BY REGION, 2021–2028 (USD MILLION)
- TABLE 25 CHEMILUMINESCENCE IMMUNOASSAYS MARKET, BY TECHNOLOGY, 2021–2028 (USD MILLION)
- TABLE 26 CHEMILUMINESCENCE IMMUNOASSAYS MARKET FOR CHEMILUMINESCENCE ENZYME, BY REGION, 2021–2028 (USD MILLION)
- TABLE 27 CHEMILUMINESCENCE IMMUNOASSAYS MARKET FOR ELECTROCHEMILUMINESCENCE IMMUNOASSAY, BY REGION, 2021–2028 (USD MILLION)
- TABLE 28 CHEMILUMINESCENCE IMMUNOASSAYS MARKET FOR MICROPARTICLE CHEMILUMINESCENCE IMMUNOASSAY, BY REGION, 2021–2028 (USD MILLION)
- TABLE 29 CHEMILUMINESCENCE IMMUNOASSAYS MARKET, BY SAMPLE TYPE, 2021–2028 (USD MILLION)
- TABLE 30 CHEMILUMINESCENCE IMMUNOASSAYS MARKET FOR BLOOD, BY REGION, 2021–2028 (USD MILLION)
- TABLE 31 CHEMILUMINESCENCE IMMUNOASSAYS MARKET FOR URINE, BY REGION, 2021–2028 (USD MILLION)
- TABLE 32 CHEMILUMINESCENCE IMMUNOASSAYS MARKET FOR SALIVA, BY REGION, 2021–2028 (USD MILLION)
- TABLE 33 CHEMILUMINESCENCE IMMUNOASSAYS MARKET FOR OTHER SAMPLE TYPES, BY REGION, 2021–2028 (USD MILLION)
- TABLE 34 CHEMILUMINESCENCE IMMUNOASSAYS MARKET, BY APPLICATION, 2021–2028 (USD MILLION)
- TABLE 35 CHEMILUMINESCENCE IMMUNOASSAYS MARKET FOR INFECTIOUS DISEASES, BY REGION, 2021–2028 (USD MILLION)
- TABLE 36 CHEMILUMINESCENCE IMMUNOASSAYS MARKET FOR ENDOCRINOLOGY, BY REGION, 2021–2028 (USD MILLION)
- TABLE 37 INCREASING INCIDENCE OF CANCER, BY REGION, 2020 VS. 2030 VS. 2040 (MILLION)
- TABLE 38 CHEMILUMINESCENCE IMMUNOASSAYS MARKET FOR ONCOLOGY, BY REGION, 2021–2028 (USD MILLION)
- TABLE 39 CHEMILUMINESCENCE IMMUNOASSAYS MARKET FOR CARDIOLOGY, BY REGION, 2021–2028 (USD MILLION)
- TABLE 40 CHEMILUMINESCENCE IMMUNOASSAYS MARKET FOR ALLERGY DIAGNOSTICS, BY REGION, 2021–2028 (USD MILLION)
- TABLE 41 CHEMILUMINESCENCE IMMUNOASSAYS MARKET FOR BLOOD SCREENING, BY REGION, 2021–2028 (USD MILLION)
- TABLE 42 CHEMILUMINESCENCE IMMUNOASSAYS MARKET FOR AUTOIMMUNE DISORDERS, BY REGION, 2021–2028 (USD MILLION)
- TABLE 43 CHEMILUMINESCENCE IMMUNOASSAYS MARKET FOR BONE & MINERAL DISORDERS, BY REGION, 2021–2028 (USD MILLION)
- TABLE 44 CHEMILUMINESCENCE IMMUNOASSAYS MARKET FOR TOXICOLOGY, BY REGION, 2021–2028 (USD MILLION)
- TABLE 45 CHEMILUMINESCENCE IMMUNOASSAYS MARKET FOR NEWBORN SCREENING, BY REGION, 2021–2028 (USD MILLION)
- TABLE 46 CHEMILUMINESCENCE IMMUNOASSAYS MARKET FOR THERAPEUTIC DRUG MONITORING, BY REGION, 2021–2028 (USD MILLION)
- TABLE 47 CHEMILUMINESCENCE IMMUNOASSAYS MARKET FOR METABOLIC DISORDERS, BY REGION, 2021–2028 (USD MILLION)
- TABLE 48 CHEMILUMINESCENCE IMMUNOASSAYS MARKET FOR GASTROENTEROLOGY, BY REGION, 2021–2028 (USD MILLION)
- TABLE 49 CHEMILUMINESCENCE IMMUNOASSAYS MARKET FOR NEUROLOGY, BY REGION, 2021–2028 (USD MILLION)
- TABLE 50 CHEMILUMINESCENCE IMMUNOASSAYS MARKET FOR RESPIRATORY, BY REGION, 2021–2028 (USD MILLION)
- TABLE 51 CHEMILUMINESCENCE IMMUNOASSAYS MARKET FOR OTHER APPLICATIONS, BY REGION, 2021–2028 (USD MILLION)
- TABLE 52 CHEMILUMINESCENCE IMMUNOASSAY MARKET, BY END USER, 2021–2028 (USD MILLION)
- TABLE 53 CHEMILUMINESCENCE IMMUNOASSAY MARKET FOR HOSPITALS, BY REGION, 2021–2028 (USD MILLION)
- TABLE 54 CHEMILUMINESCENCE IMMUNOASSAY MARKET FOR CLINICAL LABORATORIES, BY REGION, 2021–2028 (USD MILLION)
- TABLE 55 CHEMILUMINESCENCE IMMUNOASSAY MARKET FOR PHARMACEUTICAL & BIOTECHNOLOGY COMPANIES AND CONTRACT RESEARCH ORGANIZATIONS, BY REGION, 2021–2028 (USD MILLION)
- TABLE 56 CHEMILUMINESCENCE IMMUNOASSAY MARKET FOR OTHER END USERS, BY REGION, 2021–2028 (USD MILLION)
- TABLE 57 CHEMILUMINESCENCE IMMUNOASSAY MARKET, BY REGION, 2021–2028 (USD MILLION)
- TABLE 58 NORTH AMERICA: CHEMILUMINESCENCE IMMUNOASSAY MARKET, BY COUNTRY, 2021–2028 (USD MILLION)
- TABLE 59 NORTH AMERICA: CHEMILUMINESCENCE IMMUNOASSAY MARKET, BY PRODUCT, 2021–2028 (USD MILLION)
- TABLE 60 NORTH AMERICA: CHEMILUMINESCENCE IMMUNOASSAY MARKET, BY TECHNOLOGY, 2021–2028 (USD MILLION)
- TABLE 61 NORTH AMERICA: CHEMILUMINESCENCE IMMUNOASSAY MARKET, BY SAMPLE TYPE, 2021–2028 (USD MILLION)
- TABLE 62 NORTH AMERICA: CHEMILUMINESCENCE IMMUNOASSAY MARKET, BY APPLICATION, 2021–2028 (USD MILLION)
- TABLE 63 NORTH AMERICA: CHEMILUMINESCENCE IMMUNOASSAY MARKET, BY END USER, 2021–2028 (USD MILLION)
- TABLE 64 US: CHEMILUMINESCENCE IMMUNOASSAY MARKET, BY PRODUCT, 2021–2028 (USD MILLION)
- TABLE 65 US: CHEMILUMINESCENCE IMMUNOASSAY MARKET, BY TECHNOLOGY, 2021–2028 (USD MILLION)
- TABLE 66 US: CHEMILUMINESCENCE IMMUNOASSAY MARKET, BY SAMPLE TYPE, 2021–2028 (USD MILLION)
- TABLE 67 US: CHEMILUMINESCENCE IMMUNOASSAY MARKET, BY APPLICATION, 2021–2028 (USD MILLION)
- TABLE 68 US: CHEMILUMINESCENCE IMMUNOASSAY MARKET, BY END USER, 2021–2028 (USD MILLION)
- TABLE 69 CANADA: ESTIMATED PREVALENCE OF DIABETES
- TABLE 70 CANADA: MACROECONOMIC INDICATORS
- TABLE 71 CANADA: CHEMILUMINESCENCE IMMUNOASSAY MARKET, BY PRODUCT, 2021–2028 (USD MILLION)
- TABLE 72 CANADA: CHEMILUMINESCENCE IMMUNOASSAY MARKET, BY TECHNOLOGY, 2021–2028 (USD MILLION)
- TABLE 73 CANADA: CHEMILUMINESCENCE IMMUNOASSAY MARKET, BY SAMPLE TYPE, 2021–2028 (USD MILLION)
- TABLE 74 CANADA: CHEMILUMINESCENCE IMMUNOASSAY MARKET, BY APPLICATION, 2021–2028 (USD MILLION)
- TABLE 75 CANADA: CHEMILUMINESCENCE IMMUNOASSAY MARKET, BY END USER, 2021–2028 (USD MILLION)
- TABLE 76 EUROPE: CHEMILUMINESCENCE IMMUNOASSAY MARKET, BY COUNTRY, 2021–2028 (USD MILLION)
- TABLE 77 EUROPE: CHEMILUMINESCENCE IMMUNOASSAY MARKET, BY PRODUCT, 2021–2028 (USD MILLION)
- TABLE 78 EUROPE: CHEMILUMINESCENCE IMMUNOASSAY MARKET, BY TECHNOLOGY, 2021–2028 (USD MILLION)
- TABLE 79 EUROPE: CHEMILUMINESCENCE IMMUNOASSAY MARKET, BY SAMPLE TYPE, 2021–2028 (USD MILLION)
- TABLE 80 EUROPE: CHEMILUMINESCENCE IMMUNOASSAY MARKET, BY APPLICATION, 2021–2028 (USD MILLION)
- TABLE 81 EUROPE: CHEMILUMINESCENCE IMMUNOASSAY MARKET, BY END USER, 2021–2028 (USD MILLION)
- TABLE 82 GERMANY: MACROECONOMIC INDICATORS
- TABLE 83 GERMANY: CHEMILUMINESCENCE IMMUNOASSAY MARKET, BY PRODUCT, 2021–2028 (USD MILLION)
- TABLE 84 GERMANY: CHEMILUMINESCENCE IMMUNOASSAY MARKET, BY TECHNOLOGY, 2021–2028 (USD MILLION)
- TABLE 85 GERMANY: CHEMILUMINESCENCE IMMUNOASSAY MARKET, BY SAMPLE TYPE, 2021–2028 (USD MILLION)
- TABLE 86 GERMANY: CHEMILUMINESCENCE IMMUNOASSAY MARKET, BY APPLICATION, 2021–2028 (USD MILLION)
- TABLE 87 GERMANY: CHEMILUMINESCENCE IMMUNOASSAY MARKET, BY END USER, 2021–2028 (USD MILLION)
- TABLE 88 FRANCE: CHEMILUMINESCENCE IMMUNOASSAY MARKET, BY PRODUCT, 2021–2028 (USD MILLION)
- TABLE 89 FRANCE: CHEMILUMINESCENCE IMMUNOASSAY MARKET, BY TECHNOLOGY, 2021–2028 (USD MILLION)
- TABLE 90 FRANCE: CHEMILUMINESCENCE IMMUNOASSAY MARKET, BY SAMPLE TYPE, 2021–2028 (USD MILLION)
- TABLE 91 FRANCE: CHEMILUMINESCENCE IMMUNOASSAY MARKET, BY APPLICATION, 2021–2028 (USD MILLION)
- TABLE 92 FRANCE: CHEMILUMINESCENCE IMMUNOASSAY MARKET, BY END USER, 2021–2028 (USD MILLION)
- TABLE 93 UK: MACROECONOMIC INDICATORS
- TABLE 94 UK: CHEMILUMINESCENCE IMMUNOASSAY MARKET, BY PRODUCT, 2021–2028 (USD MILLION)
- TABLE 95 UK: CHEMILUMINESCENCE IMMUNOASSAY MARKET, BY TECHNOLOGY, 2021–2028 (USD MILLION)
- TABLE 96 UK: CHEMILUMINESCENCE IMMUNOASSAY MARKET, BY SAMPLE TYPE, 2021–2028 (USD MILLION)
- TABLE 97 UK: CHEMILUMINESCENCE IMMUNOASSAY MARKET, BY APPLICATION, 2021–2028 (USD MILLION)
- TABLE 98 UK: CHEMILUMINESCENCE IMMUNOASSAY MARKET, BY END USER, 2021–2028 (USD MILLION)
- TABLE 99 ITALY: CHEMILUMINESCENCE IMMUNOASSAY MARKET, BY PRODUCT, 2021–2028 (USD MILLION)
- TABLE 100 ITALY: CHEMILUMINESCENCE IMMUNOASSAY MARKET, BY TECHNOLOGY, 2021–2028 (USD MILLION)
- TABLE 101 ITALY: CHEMILUMINESCENCE IMMUNOASSAY MARKET, BY SAMPLE TYPE, 2021–2028 (USD MILLION)
- TABLE 102 ITALY: CHEMILUMINESCENCE IMMUNOASSAY MARKET, BY APPLICATION, 2021–2028 (USD MILLION)
- TABLE 103 ITALY: CHEMILUMINESCENCE IMMUNOASSAY MARKET, BY END USER, 2021–2028 (USD MILLION)
- TABLE 104 SPAIN: CHEMILUMINESCENCE IMMUNOASSAY MARKET, BY PRODUCT, 2021–2028 (USD MILLION)
- TABLE 105 SPAIN: CHEMILUMINESCENCE IMMUNOASSAY MARKET, BY TECHNOLOGY, 2021–2028 (USD MILLION)
- TABLE 106 SPAIN: CHEMILUMINESCENCE IMMUNOASSAY MARKET, BY SAMPLE TYPE, 2021–2028 (USD MILLION)
- TABLE 107 SPAIN: CHEMILUMINESCENCE IMMUNOASSAY MARKET, BY APPLICATION, 2021–2028 (USD MILLION)
- TABLE 108 SPAIN: CHEMILUMINESCENCE IMMUNOASSAY MARKET, BY END USER, 2021–2028 (USD MILLION)
- TABLE 109 REST OF EUROPE: CHEMILUMINESCENCE IMMUNOASSAY MARKET, BY PRODUCT, 2021–2028 (USD MILLION)
- TABLE 110 REST OF EUROPE: CHEMILUMINESCENCE IMMUNOASSAY MARKET, BY TECHNOLOGY, 2021–2028 (USD MILLION)
- TABLE 111 REST OF EUROPE: CHEMILUMINESCENCE IMMUNOASSAY MARKET, BY SAMPLE TYPE, 2021–2028 (USD MILLION)
- TABLE 112 REST OF EUROPE: CHEMILUMINESCENCE IMMUNOASSAY MARKET, BY APPLICATION, 2021–2028 (USD MILLION)
- TABLE 113 REST OF EUROPE: CHEMILUMINESCENCE IMMUNOASSAY MARKET, BY END USER, 2021–2028 (USD MILLION)
- TABLE 114 ASIA PACIFIC: CHEMILUMINESCENCE IMMUNOASSAY MARKET, BY COUNTRY, 2021–2028 (USD MILLION)
- TABLE 115 ASIA PACIFIC: CHEMILUMINESCENCE IMMUNOASSAY MARKET, BY PRODUCT, 2021–2028 (USD MILLION)
- TABLE 116 ASIA PACIFIC: CHEMILUMINESCENCE IMMUNOASSAY MARKET, BY TECHNOLOGY, 2021–2028 (USD MILLION)
- TABLE 117 ASIA PACIFIC: CHEMILUMINESCENCE IMMUNOASSAY MARKET, BY SAMPLE TYPE, 2021–2028 (USD MILLION)
- TABLE 118 ASIA PACIFIC: CHEMILUMINESCENCE IMMUNOASSAY MARKET, BY APPLICATION, 2021–2028 (USD MILLION)
- TABLE 119 ASIA PACIFIC: CHEMILUMINESCENCE IMMUNOASSAY MARKET, BY END USER, 2021–2028 (USD MILLION)
- TABLE 120 JAPAN: CHEMILUMINESCENCE IMMUNOASSAY MARKET, BY PRODUCT, 2021–2028 (USD MILLION)
- TABLE 121 JAPAN: CHEMILUMINESCENCE IMMUNOASSAY MARKET, BY TECHNOLOGY, 2021–2028 (USD MILLION)
- TABLE 122 JAPAN: CHEMILUMINESCENCE IMMUNOASSAY MARKET, BY SAMPLE TYPE, 2021–2028 (USD MILLION)
- TABLE 123 JAPAN: CHEMILUMINESCENCE IMMUNOASSAY MARKET, BY APPLICATION, 2021–2028 (USD MILLION)
- TABLE 124 JAPAN: CHEMILUMINESCENCE IMMUNOASSAY MARKET, BY END USER, 2021–2028 (USD MILLION)
- TABLE 125 CHINA: CHEMILUMINESCENCE IMMUNOASSAY MARKET, BY PRODUCT, 2021–2028 (USD MILLION)
- TABLE 126 CHINA: CHEMILUMINESCENCE IMMUNOASSAY MARKET, BY TECHNOLOGY, 2021–2028 (USD MILLION)
- TABLE 127 CHINA: CHEMILUMINESCENCE IMMUNOASSAY MARKET, BY SAMPLE TYPE, 2021–2028 (USD MILLION)
- TABLE 128 CHINA: CHEMILUMINESCENCE IMMUNOASSAY MARKET, BY APPLICATION, 2021–2028 (USD MILLION)
- TABLE 129 CHINA: CHEMILUMINESCENCE IMMUNOASSAY MARKET, BY END USER, 2021–2028 (USD MILLION)
- TABLE 130 INDIA: CHEMILUMINESCENCE IMMUNOASSAY MARKET, BY PRODUCT, 2021–2028 (USD MILLION)
- TABLE 131 INDIA: CHEMILUMINESCENCE IMMUNOASSAY MARKET, BY TECHNOLOGY, 2021–2028 (USD MILLION)
- TABLE 132 INDIA: CHEMILUMINESCENCE IMMUNOASSAY MARKET, BY SAMPLE TYPE, 2021–2028 (USD MILLION)
- TABLE 133 INDIA: CHEMILUMINESCENCE IMMUNOASSAY MARKET, BY APPLICATION, 2021–2028 (USD MILLION)
- TABLE 134 INDIA: CHEMILUMINESCENCE IMMUNOASSAY MARKET, BY END USER, 2021–2028 (USD MILLION)
- TABLE 135 SOUTH KOREA: CHEMILUMINESCENCE IMMUNOASSAY MARKET, BY PRODUCT, 2021–2028 (USD MILLION)
- TABLE 136 SOUTH KOREA: CHEMILUMINESCENCE IMMUNOASSAY MARKET, BY TECHNOLOGY, 2021–2028 (USD MILLION)
- TABLE 137 SOUTH KOREA: CHEMILUMINESCENCE IMMUNOASSAY MARKET, BY SAMPLE TYPE, 2021–2028 (USD MILLION)
- TABLE 138 SOUTH KOREA: CHEMILUMINESCENCE IMMUNOASSAY MARKET, BY APPLICATION, 2021–2028 (USD MILLION)
- TABLE 139 SOUTH KOREA: CHEMILUMINESCENCE IMMUNOASSAY MARKET, BY END USER, 2021–2028 (USD MILLION)
- TABLE 140 REST OF ASIA PACIFIC: CHEMILUMINESCENCE IMMUNOASSAY MARKET, BY PRODUCT, 2021–2028 (USD MILLION)
- TABLE 141 REST OF ASIA PACIFIC: CHEMILUMINESCENCE IMMUNOASSAY MARKET, BY TECHNOLOGY, 2021–2028 (USD MILLION)
- TABLE 142 REST OF ASIA PACIFIC: CHEMILUMINESCENCE IMMUNOASSAY MARKET, BY SAMPLE TYPE, 2021–2028 (USD MILLION)
- TABLE 143 REST OF ASIA PACIFIC: CHEMILUMINESCENCE IMMUNOASSAY MARKET, BY APPLICATION, 2021–2028 (USD MILLION)
- TABLE 144 REST OF ASIA PACIFIC: CHEMILUMINESCENCE IMMUNOASSAY MARKET, BY END USER, 2021–2028 (USD MILLION)
- TABLE 145 REST OF THE WORLD: CHEMILUMINESCENCE IMMUNOASSAY MARKET, BY REGION, 2021–2028 (USD MILLION)
- TABLE 146 REST OF THE WORLD: CHEMILUMINESCENCE IMMUNOASSAY MARKET, BY PRODUCT, 2021–2028 (USD MILLION)
- TABLE 147 REST OF THE WORLD: CHEMILUMINESCENCE IMMUNOASSAY MARKET, BY TECHNOLOGY, 2021–2028 (USD MILLION)
- TABLE 148 REST OF THE WORLD: CHEMILUMINESCENCE IMMUNOASSAY MARKET, BY SAMPLE TYPE, 2021–2028 (USD MILLION)
- TABLE 149 REST OF THE WORLD: CHEMILUMINESCENCE IMMUNOASSAY MARKET, BY APPLICATION, 2021–2028 (USD MILLION)
- TABLE 150 REST OF THE WORLD: CHEMILUMINESCENCE IMMUNOASSAY MARKET, BY END USER, 2021–2028 (USD MILLION)
- TABLE 151 LATIN AMERICA: CHEMILUMINESCENCE IMMUNOASSAY MARKET, BY PRODUCT, 2021–2028 (USD MILLION)
- TABLE 152 LATIN AMERICA: CHEMILUMINESCENCE IMMUNOASSAY MARKET, BY TECHNOLOGY, 2021–2028 (USD MILLION)
- TABLE 153 LATIN AMERICA: CHEMILUMINESCENCE IMMUNOASSAY MARKET, BY SAMPLE TYPE, 2021–2028 (USD MILLION)
- TABLE 154 LATIN AMERICA: CHEMILUMINESCENCE IMMUNOASSAY MARKET, BY APPLICATION, 2021–2028 (USD MILLION)
- TABLE 155 LATIN AMERICA: CHEMILUMINESCENCE IMMUNOASSAY MARKET, BY END USER, 2021–2028 (USD MILLION)
- TABLE 156 MIDDLE EAST & AFRICA: CHEMILUMINESCENCE IMMUNOASSAY MARKET, BY PRODUCT, 2021–2028 (USD MILLION)
- TABLE 157 MIDDLE EAST & AFRICA: CHEMILUMINESCENCE IMMUNOASSAY MARKET, BY TECHNOLOGY, 2021–2028 (USD MILLION)
- TABLE 158 MIDDLE EAST & AFRICA: CHEMILUMINESCENCE IMMUNOASSAY MARKET, BY SAMPLE TYPE, 2021–2028 (USD MILLION)
- TABLE 159 MIDDLE EAST & AFRICA: CHEMILUMINESCENCE IMMUNOASSAY MARKET, BY APPLICATION, 2021–2028 (USD MILLION)
- TABLE 160 MIDDLE EAST & AFRICA: CHEMILUMINESCENCE IMMUNOASSAY MARKET, BY END USER, 2021–2028 (USD MILLION)
- TABLE 161 OVERVIEW OF STRATEGIES ADOPTED BY KEY MANUFACTURERS OF CHEMILUMINESCENCE IMMUNOASSAY PRODUCTS
- TABLE 162 CHEMILUMINESCENCE IMMUNOASSAY MARKET: DEGREE OF COMPETITION
- TABLE 163 CHEMILUMINESCENCE IMMUNOASSAY MARKET: DETAILED LIST OF KEY START-UPS/SMES
- TABLE 164 OVERALL COMPANY FOOTPRINT
- TABLE 165 COMPANY PRODUCT FOOTPRINT
- TABLE 166 COMPANY REGIONAL FOOTPRINT
- TABLE 167 CHEMILUMINESCENCE IMMUNOASSAY MARKET: KEY PRODUCT LAUNCHES AND APPROVALS, 2020–2023
- TABLE 168 CHEMILUMINESCENCE IMMUNOASSAY MARKET: KEY DEALS, 2020–2023
- TABLE 169 CHEMILUMINESCENCE IMMUNOASSAY MARKET: OTHER KEY DEVELOPMENTS, 2020–2023
- TABLE 170 F. HOFFMANN-LA ROCHE LTD.: COMPANY OVERVIEW
- TABLE 171 DANAHER CORPORATION: COMPANY OVERVIEW
- TABLE 172 SIEMENS HEALTHINEERS AG: COMPANY OVERVIEW
- TABLE 173 DIASORIN S.P.A.: COMPANY OVERVIEW
- TABLE 174 ABBOTT LABORATORIES: COMPANY OVERVIEW
- TABLE 175 SHENZHEN MINDRAY BIO-MEDICAL ELECTRONICS CO., LTD.: COMPANY OVERVIEW
- TABLE 176 SYSMEX CORPORATION: COMPANY OVERVIEW
- TABLE 177 DIATRON: COMPANY OVERVIEW
- TABLE 178 GETEIN BIOTECH, INC.: COMPANY OVERVIEW
- TABLE 179 WERFEN: COMPANY OVERVIEW
- TABLE 180 QUIDELORTHO CORPORATION: COMPANY OVERVIEW
- TABLE 181 EUROIMMUN MEDIZINISCHE LABORDIAGNOSTIKA AG: COMPANY OVERVIEW
- FIGURE 1 CHEMILUMINESCENCE IMMUNOASSAY MARKET SEGMENTATION
- FIGURE 2 RESEARCH DESIGN
- FIGURE 3 BREAKDOWN OF PRIMARY INTERVIEWS: SUPPLY AND DEMAND SIDE PARTICIPANTS
- FIGURE 4 BREAKDOWN OF PRIMARY INTERVIEWS (SUPPLY SIDE): BY COMPANY TYPE, DESIGNATION, AND REGION
- FIGURE 5 REVENUE SHARE ANALYSIS ILLUSTRATION
- FIGURE 6 MARKET ESTIMATION FROM IVD MARKET
- FIGURE 7 MARKET ESTIMATION FROM IMMUNOASSAY MARKET
- FIGURE 8 CAGR PROJECTIONS: SUPPLY SIDE ANALYSIS OF CHEMILUMINESCENCE IMMUNOASSAY MARKET
- FIGURE 9 TOP-DOWN APPROACH
- FIGURE 10 DATA TRIANGULATION METHODOLOGY
- FIGURE 11 CHEMILUMINESCENCE IMMUNOASSAY MARKET, BY PRODUCT, 2023 VS. 2028 (USD BILLION)
- FIGURE 12 CHEMILUMINESCENCE IMMUNOASSAY MARKET, BY TECHNOLOGY, 2023 VS. 2028 (USD BILLION)
- FIGURE 13 CHEMILUMINESCENCE IMMUNOASSAY MARKET, BY SAMPLE TYPE, 2023 VS. 2028 (USD BILLION)
- FIGURE 14 CHEMILUMINESCENCE IMMUNOASSAY MARKET, BY APPLICATION, 2023 VS. 2028 (USD BILLION)
- FIGURE 15 CHEMILUMINESCENCE IMMUNOASSAY MARKET, BY END USER, 2023 VS. 2028 (USD BILLION)
- FIGURE 16 GEOGRAPHICAL SNAPSHOT OF CHEMILUMINESCENCE IMMUNOASSAY MARKET
- FIGURE 17 INCREASING INCIDENCE OF DISEASES AND TECHNOLOGICAL ADVANCEMENTS TO DRIVE MARKET
- FIGURE 18 CONSUMABLES SEGMENT ACCOUNTED FOR LARGEST MARKET SHARE IN 2022
- FIGURE 19 CHINA AND INDIA TO REGISTER HIGHEST GROWTH DURING FORECAST PERIOD
- FIGURE 20 ASIA PACIFIC TO WITNESS HIGHEST GROWTH RATE DURING STUDY PERIOD
- FIGURE 21 DEVELOPING MARKETS TO REGISTER HIGHER GROWTH DURING STUDY PERIOD
- FIGURE 22 CHEMILUMINESCENCE IMMUNOASSAY MARKET: DRIVERS, RESTRAINTS, OPPORTUNITIES, AND CHALLENGES
- FIGURE 23 INCREASING INCIDENCES OF DIABETES (GLOBAL)
- FIGURE 24 NUMBER OF PEOPLE WITH CHRONIC CONDITIONS IN US, 1995–2030 (MILLION INDIVIDUALS)
- FIGURE 25 GLOBAL GERIATRIC POPULATION, BY REGION, 2019 VS. 2050 (MILLION)
- FIGURE 26 VALUE CHAIN ANALYSIS: MAJOR VALUE ADDED DURING MANUFACTURING AND ASSEMBLY PHASES
- FIGURE 27 DIRECT DISTRIBUTION TO BE PREFERRED STRATEGY FOR PROMINENT COMPANIES
- FIGURE 28 INFLUENCE OF STAKEHOLDERS ON BUYING PROCESS FOR END USERS
- FIGURE 29 KEY BUYING CRITERIA FOR MAJOR END USERS
- FIGURE 30 US: REGULATORY PROCESS FOR IVD DEVICES
- FIGURE 31 CANADA: REGULATORY PROCESS FOR IVD DEVICES
- FIGURE 32 JAPAN: REGULATORY PROCESS FOR IVD DEVICES
- FIGURE 33 INDIA: REGULATORY PROCESS FOR IVD DEVICES
- FIGURE 34 MEXICO: REGULATORY PROCESS FOR IVD DEVICES
- FIGURE 35 BRAZIL: REGULATORY PROCESS FOR IVD DEVICES
- FIGURE 36 ECOSYSTEM MAPPING OF CHEMILUMINESCENCE IMMUNOASSAY MARKET
- FIGURE 37 GLOBAL INCIDENCE OF DIABETES
- FIGURE 38 NORTH AMERICA: CHEMILUMINESCENCE IMMUNOASSAY MARKET SNAPSHOT
- FIGURE 39 ASIA PACIFIC: CHEMILUMINESCENCE IMMUNOASSAY MARKET SNAPSHOT
- FIGURE 40 REVENUE ANALYSIS OF TOP MARKET PLAYERS IN CHEMILUMINESCENCE IMMUNOASSAY MARKET
- FIGURE 41 CHEMILUMINESCENCE IMMUNOASSAY MARKET SHARE, BY KEY PLAYER (2022)
- FIGURE 42 CHEMILUMINESCENCE IMMUNOASSAY MARKET: COMPANY EVALUATION MATRIX FOR KEY PLAYERS
- FIGURE 43 CHEMILUMINESCENCE IMMUNOASSAY MARKET: COMPANY EVALUATION MATRIX FOR START-UPS/SMES
- FIGURE 44 F. HOFFMANN-LA ROCHE LTD.: COMPANY SNAPSHOT (2022)
- FIGURE 45 DANAHER CORPORATION: COMPANY SNAPSHOT (2022)
- FIGURE 46 SIEMENS HEALTHINEERS AG: COMPANY SNAPSHOT (2022)
- FIGURE 47 DIASORIN S.P.A.: COMPANY SNAPSHOT (2022)
- FIGURE 48 ABBOTT LABORATORIES: COMPANY SNAPSHOT (2022)
- FIGURE 49 SHENZHEN MINDRAY BIO-MEDICAL ELECTRONICS CO., LTD.: COMPANY SNAPSHOT (2021)
- FIGURE 50 SYSMEX CORPORATION: COMPANY SNAPSHOT (2022)
- FIGURE 51 STRATEC SE: COMPANY SNAPSHOT (2022)
- FIGURE 52 QUIDELORTHO CORPORATION: COMPANY SNAPSHOT (2022)
The objective of the study is analyze the key market dynamics such as drivers, opportunities, challenges, restraints, and key player strategies. To track companies developments such as product launches and approvals, expansions, collaborations, agreements, and partnerships of the leading players, the competitive landscape of the chemiluminescence immunoassay market to analyzes market players on various parameters within the broad categories of business and product strategy. Top-down and bottom-up approaches were use to estimate the market size. To estimate the market size of segments and subsegments the market breakdown and data triangulation were used.
The four steps involved in estimating the market size are
Collecting Secondary Data
The secondary research data collection process involves the usage of secondary sources, directories, databases (such as Bloomberg Businessweek, Factiva, and D&B), annual reports, investor presentations, and SEC filings of companies. Secondary research was used to identify and collect information useful for the extensive, technical, market-oriented, and commercial study of the chemiluminescence immunoassay market. A database of the key industry leaders was also prepared using secondary research.
Collecting Primary Data
The primary research data was conducted after acquiring knowledge about the chemiluminescence immunoassay market scenario through secondary research. A significant number of primary interviews were conducted with stakeholders from both the demand side (such clinical laboratories, hospitals, and academic & research institutes) and supply-side (such as included various industry experts, such as Directors, Chief X Officers (CXOs), Vice Presidents (VPs) from business development, marketing and product development teams, product manufacturers, wholesalers, channel partners, and distributors) across major countries of North America, Europe, Asia Pacific, the Middle East & Africa, and Latin America. Approximately 40% of the primary interviews were conducted with stakeholders from the demand side while those from the supply side accounted for the remaining 60%. Primary data for this report was collected through questionnaires, emails, and telephonic interviews.
A breakdown of the primary respondents is provided below:
Breakdown of Primary Participants
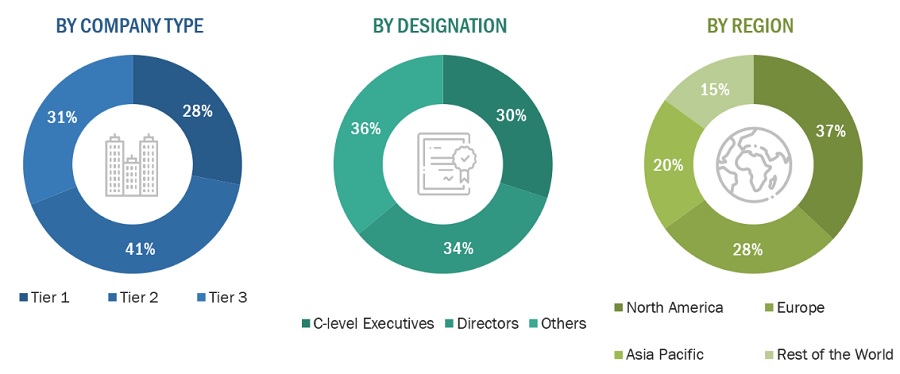
Note 1: Others include sales managers, marketing managers, and product managers.
Note 2: Tiers are defined based on a company’s total revenue. As of 2022: Tier 1 = >USD 1 billion, Tier 2 = USD 500 million to USD 1 billion, and Tier 3 <USD 500 million.
To know about the assumptions considered for the study, download the pdf brochure
|
COMPANY NAME |
DESIGNATION |
|
F. Hoffmann-La Roche Ltd. (Switzerland) |
Regional Head of Sales |
|
Danaher Corporation (US) |
Senior Product Manager |
|
Siemens Healthineers (Germany) |
Regional Manager |
|
Abbott Laboratories (US) |
General Manager |
Market Size Estimation
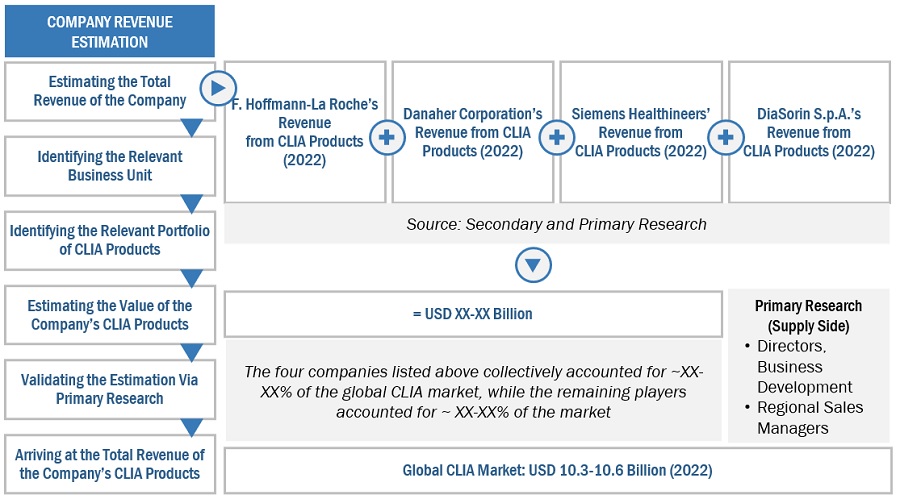
All major product manufacturers offering various chemiluminescence immunoassay were identified at the global/regional level. Revenue mapping was done for the major players and was extrapolated to arrive at the global market value of each type of segment. The market value chemiluminescence immunoassay market was also split into various segments and subsegments at the region and country level based on:
- Product mapping of various manufacturers for each type of chemiluminescence immunoassay market at the regional and country-level
- Relative adoption pattern of each chemiluminescence immunoassay market among key application segments at the regional and/or country-level
- Detailed primary research to gather qualitative and quantitative information related to segments and subsegments at the regional and/or country level.
- Detailed secondary research to gauge the prevailing market trends at the regional and/or country-level
Global Chemiluminescence Immunoassay Market Size: Botton Up Approach
To know about the assumptions considered for the study, Request for Free Sample Report
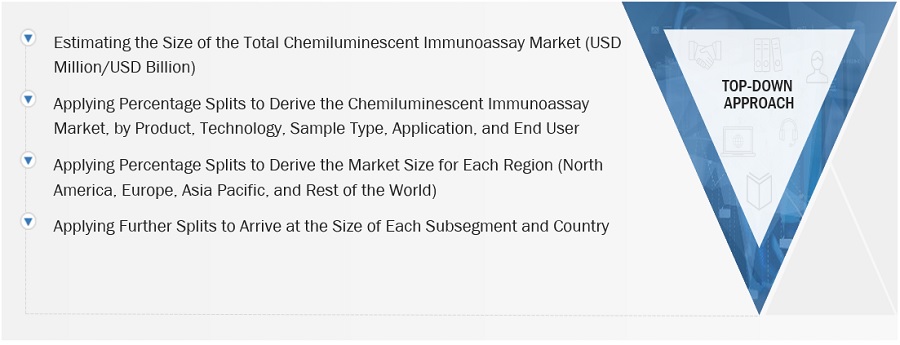
Global Chemiluminescence Immunoassay Market Size: Top Down Approach
Data Triangulation
After arriving at the overall market size—using the market size estimation processes—the market was split into several segments and subsegments. To complete the overall market engineering process and arrive at the exact statistics of each market segment and subsegment, the data triangulation, and market breakdown procedures were employed, wherever applicable. The data was triangulated by studying various factors and trends from both the demand and supply sides in the chemiluminescence immunoassay industry.
Market Definition
Chemiluminescent immunoassay (CLIA) is an immunoassay technique where the label, i.e., the indicator of the analytic reaction, is a luminescent molecule. CLIA is a variation of the standard enzyme immunoassay (EIA), a biochemical technique used in immunology. This variation technique can be used for diagnosis in medicine and in several other different industries for various applications. In recent years, CLIA has gained increasing attention in different fields, including clinical diagnosis, life science, food safety, environmental monitoring, and pharmaceutical analysis, due to its good specificity, high sensitivity, wide applications, simple equipment, and wide linear range.
Key Stakeholders
- Senior Management
- End User
- Finance/Procurement Department
- R&D Department
Report Objectives
- To provide detailed information about the factors influencing the market growth (such as drivers, restraints, opportunities, and challenges)
- To define, describe, segment, and forecast the chemiluminescence immunoassay market by product, technology, sample type, application, end user, and region
- To analyze market opportunities for stakeholders and provide details of the competitive landscape for key players
- To analyze micromarkets with respect to individual growth trends, prospects, and contributions to the overall chemiluminescence immunoassay market
- To forecast the size of the chemiluminescence immunoassay market in four main regions along with their respective key countries, namely, North America, Europe, the Asia Pacific and Rest of the world
- To profile key players in the chemiluminescence immunoassay market and comprehensively analyze their core competencies and market shares
- To track and analyze competitive developments, such as product launches and approvals; expansions; collaborations, and agreements, & partnerships; of the leading players in the chemiluminescence immunoassay market
- To benchmark players within the chemiluminescence immunoassay market using the Competitive Leadership Mapping framework, which analyzes market players on various parameters within the broad categories of business and product strategy
Available Customizations
MarketsandMarkets offers the following customizations for this market report
Country Information
- Additional country-level analysis of the chemiluminescence immunoassay market
Company profiles
- Additional three company profiles of players operating in the chemiluminescence immunoassay market.
Product Analysis
- Product matrix, which provides a detailed comparison of the product portfolio of each company in the chemiluminescence immunoassay market


Growth opportunities and latent adjacency in Chemiluminescence Immunoassay Market