Chromatography Resin Market in Drug Discovery by Type (Natural, Synthetic, Inorganic Media), Technique (Ion Exchange, Affinity, Hydrophobic Interaction, Size Exclusion, Multi-Modal), and Region - Global Forecast to 2022


[147 Pages Report] The Chromatography Resin Market in Drug Discovery was valued at USD 272.9 Million in 2016, and is projected to grow at a CAGR of 6.65% from 2017 to 2022. The base year considered for the study is 2016, and the forecast period is from 2017 to 2022.
The objectives of the report are:
- To define, segment, and project the size of the global chromatography resin market in drug discovery on the basis of type, technique, and region
- To provide information about the key factors influencing the growth of the market (drivers, restraints, opportunities, and industry-specific challenges)
- To strategically analyze micromarkets with respect to individual growth trends, prospects, and their contribution to the total market
- To analyze opportunities in the market for stakeholders and provide a competitive landscape of the market
- To project the size of the market in terms of value and volume, with respect to four main regions (along with their respective key countries), namely, North America, Europe, Asia-Pacific, and RoW
- To strategically profile key players and comprehensively analyze their core competencies
- To track and analyze competitive developments such as new product launches, contracts & agreements, expansion, joint ventures, and mergers & acquisitions in the chromatography resin market in drug discovery
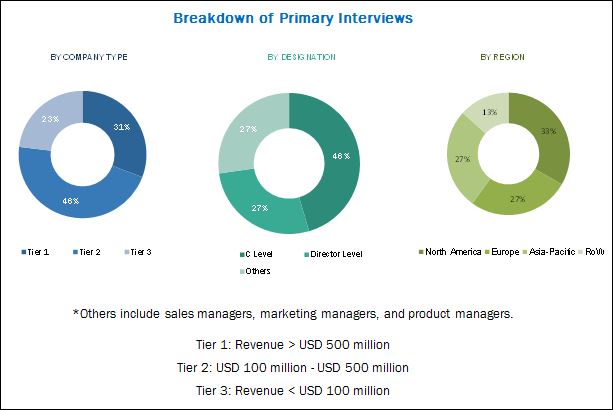
The research methodology used to estimate and project the market size included the top-down and bottom-up approaches. The total size of the chromatography resin market in drug discovery was calculated and accordingly weightages were provided for various segments. This was done on the basis of extensive primary interviews and secondary research based on the information available on websites of various associations such as the Chinese American Chromatography Association, Chromatography Society, and International Association for the Advancement of High Performance Thin Layer Chromatography (HPTLC Association). Primary research conducted for this report included extensive interviews with key people such as CEOs, VPs, directors, and executives. After arriving at the overall market size, the total market was split into several segments and subsegments. The data triangulation and market breakdown procedures were employed to complete the overall market engineering process and arrive at the exact statistics for all segments and subsegments. The breakdown of profiles of primary respondents is depicted in the figure below.
To know about the assumptions considered for the study, download the pdf brochure
The ecosystem of the chromatograhy resin market in drug discovery comprises distributors/suppliers of chromatography resins. Some of the major companies operating in this market are Bio-Rad Laboratories Inc. (U.S.), GE Healthcare (U.S.), Tosoh Corporation (Japan), Merck KGaA (U.S.), Pall Corporation (U.S.), Purolite Corporation (U.S.), and Thermo Fisher Scientific Inc. (U.S.).
Target Audience:
- Chromatography Resin Manufacturers, Distributors, and Suppliers
- End Users
- Government and Research Organizations
- Raw Material and Equipment Suppliers
- Associations and Industry Bodies
- Consulting Companies
- Investment Banks
�The study answers several questions for the stakeholders: primarily, which market segments they need to focus upon during the next two to five years to prioritize their efforts and investments.�
Scope of the Report
The research report categorizes the chromatography resin market in drug discovery into the following segments:
By Type:
- Natural Polymer
- Synthetic Polymer
- Inorganic Media
By Technique:
- Ion Exchange
- Affinity
- Hydrophobic Interaction
- Size Exclusion
- Multi-modal
- Others
By Region:
- North America
- Europe
- Asia-Pacific
- Rest of the World
Available Customizations
Along with the market data, MarketsandMarkets offers customizations according to the client-specific needs.
- Chromatography resin market in drug discovery, by other countries in the Rest of Asia-Pacific and Rest of Europe
- Detailed analysis and profiling of additional market players (up to five)
MarketsandMarkets projects that the market for chromatography resin in drug discovery will grow from USD 290.7 Million in 2017 to USD 401.1 Million by 2022, at a CAGR of 6.65% from 2017 to 2022. The growth of this market is expected to be driven by the rising demand from pharmaceuticals and biotechnology verticals.
The chromatography resin market in drug discovery is segmented on the basis of type, technique, and region. The ion exchange chromatography segment is estimated to be the most widely used technique. The high share of this segment, in terms of volume, can be attributed to the increasing demand for this technique in the pharmaceutical industry. Among types, the synthetic polymer segment is projected to grow at the highest CAGR during the forecast period. The demand for synthetic polymers is expected to be driven by their use in ion exchange chromatography. Polystyrene divinylbenzene is the most commonly used synthetic polymer, which is being increasingly used in ion exchange applications because of its better performance in comparison to natural polymer.
Industrial-scale purification of biopharmaceuticals and quantitative and qualitative analysis of drugs are the key application areas of chromatography resins. Chromatography is being increasingly used to manufacture biological drugs such as monoclonal antibodies and other recombinant proteins, which is expected to drive chromatography resin use in drug discovery.
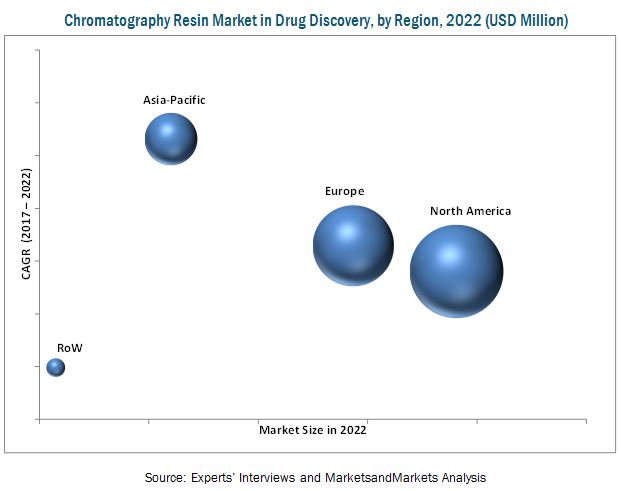
On the basis of region, the market for chromatography resin in drug discovery is segmented into North America, Europe, Asia-Pacific, and Rest of the World. The chromatography resin market in drug discovery in Asia-Pacific is projected to grow at the highest rate from 2017 to 2022, owing to the growth of generic drugs and biosimilars in countries, such as China, India, and South Korea. A large number of global pharmaceutical players are setting up R&D centers in these countries because of economic benefits and availability of skilled professionals.
The key constraint for the growth of the chromatography resin market in drug discovery is the lack of adequately skilled professionals. The pharmaceutical industry is currently witnessing a shortage of skilled professionals to operate chromatography instruments and perform techniques according to the industry requirements. The chromatography market has witnessed rapid technological advancements in the recent years. Therefore, proper usage of modern chromatography equipment requires expertise, relevant experience, and knowledge of different chromatography techniques.
New product launches, expansions, contracts & agreements, and acquisitions were the major strategies adopted by most of the market players. Companies such as General Electric Company (U.S.), Merck KGaA (Germany), Pall Corporation (U.S.), Bio-Rad Laboratories Inc. (U.S.), Thermo Fisher Scientific Inc. (U.S.), and Tosoh Corporation (Japan) were the key players who adopted these strategies to increase their customer base and widen their product portfolio. Companies aim to widen their product portfolio and geographic presence to cater the increasing demand from customers.
To speak to our analyst for a discussion on the above findings, click Speak to Analyst
 Exclusive indicates content/data unique to MarketsandMarkets and not available with any competitors.
Table of Contents
1 Introduction (Page No. - 15)
1.1 Objectives of the Study
1.2 Market Definition
1.3 Market Scope
1.3.1 Year Considered for the Study
1.4 Currency
1.5 Package Size
1.6 Stakeholders
2 Research Methodology (Page No. - 18)
2.1 Research Data
2.1.1 Secondary Data
2.1.1.1 Key Data From Secondary Sources
2.1.2 Primary Data
2.1.2.1 Key Data From Primary Sources
2.1.2.2 Breakdown of Primary Interviews
2.2 Market Size Estimation
2.3 Data Triangulation
2.4 Research Assumptions and Limitations
2.4.1 Assumptions
2.4.2 Limitations
3 Executive Summary (Page No. - 26)
4 Premium Insights (Page No. - 30)
4.1 Attractive Opportunities in Chromatography Resin Market in Drug Discovery
4.2 Chromatography Resin Market, By Region
4.3 Affinity Chromatography Resin Market in North America
4.4 Chromatography Resin Market Attractiveness
4.5 Chromatography Resin Market, By Technique
4.6 Chromatography Resin Market in Drug Discovery: Developing vs Developed Countries
5 Market Overview (Page No. - 34)
5.1 Introduction
5.2 Market Dynamics
5.2.1 Drivers
5.2.1.1 Increasing Demand for Therapeutic Antibodies
5.2.1.2 Increasing R&D in Biopharmaceuticals
5.2.2 Restraint
5.2.2.1 High Cost of Affinity Resin
5.2.3 Opportunities
5.2.3.1 High Growth of Biopharmaceutical R&D Activity in Asia-Pacific
5.2.3.2 Growing Demand for Disposable Pre-Packed Columns
5.2.4 Challenge
5.2.4.1 Lack of Adequate Skilled Professionals
6 Industry Trends (Page No. - 40)
6.1 Porter�s Five Forces Analysis
6.1.1 Threat of Substitutes
6.1.2 Bargaining Power of Suppliers
6.1.3 Bargaining Power of Buyers
6.1.4 Threat of New Entrants
6.1.5 Intensity of Competitive Rivalry
6.2 Macroeconomic Indicators
6.2.1 GDP Growth Rate Forecasts of Major Economies
6.2.2 General Healthcare Industry Trends
6.2.2.1 Contribution of Healthcare Industry in Asia-Pacific GDP
6.2.2.2 Contribution of Healthcare Industry in North American GDP
6.2.2.3 Contribution of Healthcare Industry in Europe GDP
7 Chromatography Resin Market in Drug Discovery, By Type (Page No. - 49)
7.1 Introduction
7.2 Market Size and Projection, By Type
7.3 Natural Polymer
7.4 Synthetic Polymer
7.5 Inorganic Media
8 Chromatography Resin Market in Drug Discovery, By Technique (Page No. - 53)
8.1 Introduction
8.2 Ion Exchange Chromatography
8.2.1 Market Size and Forecast, By Region
8.3 Affinity Chromatography
8.3.1 Market Size and Forecast, By Region
8.3.2 Protein A Affinity
8.3.3 Protein G/L Affinity
8.4 Hydrophobic Interaction Chromatography
8.4.1 Market Size and Forecast, By Region
8.5 Size Exclusion Chromatography
8.5.1 Market Size and Forecast, By Region
8.6 Multi-Modal Chromatography
8.6.1 Market Size and Forecast, By Region
8.7 Others
8.7.1 Partition Chromatography
8.7.2 Adsorption Chromatography
8.7.3 Market Size and Forecast, By Region
9 Chromatography Resin Market in Drug Discovery, By Region (Page No. - 65)
9.1 Introduction
9.1.1 Market Size and Forecast, By Region
9.2 North America
9.2.1 Market Size and Forecast, By Country
9.2.1.1 Market Size and Forecast, By Technique
9.2.2 U.S.
9.2.2.1 Market Size and Forecast, By Technique
9.2.3 Canada
9.2.3.1 Market Size and Forecast, By Technique
9.2.4 Mexico
9.2.4.1 Market Size and Forecast, By Technique
9.3 Europe
9.3.1 Market Size and Forecast, By Country
9.3.1.1 Market Size and Forecast, By Technique
9.3.2 Germany
9.3.2.1 Market Size and Forecast, By Technique
9.3.3 Scandinavia
9.3.3.1 Market Size and Forecast, By Technique
9.3.4 U.K.
9.3.4.1 Market Size and Forecast, By Technique
9.3.5 Austria & Switzerland
9.3.5.1 Market Size and Projection, By Technique
9.3.6 Spain
9.3.6.1 Market Size and Forecast, By Technique
9.3.7 France
9.3.7.1 Market Size and Forecast, By Technique
9.3.8 Rest of Europe
9.3.8.1 Market Size and Forecast, By Technique
9.4 Asia-Pacific
9.4.1 Market Size and Forecast, By Country
9.4.1.1 Market Size and Forecast, By Technique
9.4.2 Japan
9.4.2.1 Market Size and Forecast, By Technique
9.4.3 China
9.4.3.1 Market Size and Forecast, By Technique
9.4.4 India
9.4.4.1 Market Size and Forecast, By Technique
9.4.5 South Korea
9.4.5.1 Market Size and Forecast, By Technique
9.4.6 Rest of Asia-Pacific
9.4.6.1 Market Size and Forecast, By Technique
9.5 RoW
9.5.1 Market Size and Forecast, By Country
9.5.1.1 Market Size and Forecast, By Technique
9.5.2 Brazil
9.5.2.1 Market Size and Forecast, By Technique
9.5.3 Middle East
9.5.3.1 Market Size and Forecast, By Technique
9.5.4 Africa
9.5.4.1 Market Size and Forecast, By Technique
10 Competitve Landscape (Page No. - 106)
10.1 Introduction
10.1.1 Dynamic
10.1.2 Innovator
10.1.3 Vanguard
10.1.4 Emerging
10.2 Competitve Benchmarking
10.2.1 Product Offerings
10.2.2 Business Strategy
10.3 Market Share Analysis
10.3.1 Ge Healthcare
10.3.2 Tosoh Corporation
10.3.3 Bio-Rad Laboratories Inc.
11 Company Profiles (Page No. - 111)
(Overview, Products & Services, Strategies & Insights, Developments and MnM View)*
11.1 Ge Healthcare
11.2 Tosoh Corporation
11.3 Bio-Rad Laboratories, Inc.
11.4 Merck KGaA
11.5 Pall Corporation
11.6 Purolite Corporation
11.7 Thermo Fisher Scientific Inc.
11.8 Sepragen Corporation
11.9 Knauer Wissenschaftliche Gerate GmbH
11.10 Kaneka Corporation
11.11 Other Key Players
11.11.1 Sterogene Bioseparations Inc.
11.11.2 Avantor Performance Materials, Inc.
11.11.3 Genscript Biotech Corporation
11.11.4 Finex OY
11.11.5 Repligen Corporation
11.11.6 Novasep
11.11.7 Chemra GmbH
11.11.8 Sunresin New Materials Co. Ltd.
11.11.9 Biotoolomics Ltd.
11.11.10 Concise Separations
11.11.11 Mitsubishi Chemical Corporation
11.11.12 Eichrom Technologies Inc.
11.11.13 Agilent Technologies
11.11.14 Cube Biotech
11.11.15 JSR Life Sciences
11.11.16 Ningbo Zhengguang Resin Co., Ltd
*Details on Overview, Products & Services, Strategies & Insights, Developments and MnM View Might Not Be Captured in Case of Unlisted Companies.
12 Appendix (Page No. - 141)
12.1 Insights From Industry Experts
12.2 Discussion Guide
12.3 Knowledge Store: Marketsandmarkets� Subscription Portal
12.4 Introducing RT: Real-Time Market Intelligence
12.5 Available Customizations
12.6 Related Reports
12.7 Author Details
List of Tables (101 Tables)
Table 1 Advantages of Pre-Packed Columns
Table 2 Trends and Forecast of GDP, USD Billion, (2017�2022)
Table 3 Contribution of Healthcare Industry in Asia-Pacific GDP, USD Trillion (2012�2014)
Table 4 Contribution of Healthcare Industry in North America GDP, USD Trillion (2012�2014)
Table 5 Contribution of Healthcare Industry in Europe GDP, USD Trillion (2012�2014)
Table 6 Chromatography Resin Market Size in Drug Discovery, By Type, 2015�2022 (USD Million)
Table 7 Natural Polymer: Sources of Production
Table 8 Chromatography Resin Market Size in Drug Discovery, By Technique, 2015�2022 (Liter)
Table 9 Chromatography Resin Market Size in Drug Discovery, By Technique, 2015�2022 (USD Million)
Table 10 Chromatography Resin Market Size in IEX Chromatography, By Region, 2015�2022 (Liter)
Table 11 Chromatography Resin Market Size in IEX Chromatography, 2015�2022 (USD Million)
Table 12 Chromatography Resin Market Size in Affinity Chromatography, By Region, 2015�2022 (Liter)
Table 13 Chromatography Resin Market Size in Affinity Chromatography, By Region, 2015�2022 (USD Million)
Table 14 Affinity Chromatography Resin Market Size in Drug Discovery, By Type, 2015�2022 (USD Million)
Table 15 Protein A Resin Market Size in Drug Discovery, By Region, 2015�2022 (USD Million)
Table 16 Protein G/L Resin Market Size in Drug Discovery, By Region, 2015�2022 (USD Million)
Table 17 Protein A, G & L: Binding Capacities for Different Immunoglobulin Species
Table 18 Chromatography Resin Market Size in HIC, By Region, 2015�2022 (Liter)
Table 19 Chromatography Resin Market Size in HIC, By Region, 2015�2022 (USD Million)
Table 20 Chromatography Resin Market Size in SEC, By Region, 2015�2022 (Liter)
Table 21 Chromatography Resin Market Size in Size Exclusion Chromatography, By Region, 2015�2022 (USD Million)
Table 22 Chromatography Resin Market Size in Multi-Modal Chromatography, By Region, 2015�2022 (Liter)
Table 23 Chromatography Resin Market Size in Multi-Modal Chromatography, By Region, 2015�2022 (USD Million)
Table 24 Chromatography Resin Market Size in Other Chromatography Techniques, By Region, 2015�2022 (Liter)
Table 25 Chromatography Resin Market Size in Other Chromatography Techniques, By Region, 2015�2022 (USD Million)
Table 26 Chromatography Resin Market Size in Drug Discovery, By Region, 2015�2022 (Liter)
Table 27 Chromatography Resin Market Size in Drug Discovery, By Region, 2015�2022 (USD Million)
Table 28 North America: Chromatography Resin Market Size in Drug Discovery, By Country, 2015�2022 (Liter)
Table 29 North America: Market Size in Drug Discovery, By Country, 2015�2022 (USD Million)
Table 30 North America: Market Size in Drug Discovery, By Technique, 2015�2022 (Liter)
Table 31 North America: Market Size in Drug Discovery, By Technique, 2015�2022 (USD Million)
Table 32 North America: Affinity Chromatography Resin Market Size in Drug Discovery, By Type, 2015�2022 (USD Million)
Table 33 U.S.: Chromatography Resin Market Size in Drug Discovery, By Technique, 2015�2022 (Liter)
Table 34 U.S.: Market Size in Drug Discovery, By Technique, 2015�2022 (USD Million)
Table 35 U.S.: Affinity Chromatography Resin Market Size in Drug Discovery, By Type, 2015�2022 (USD Million)
Table 36 Canada: Chromatography Resin Market Size in Drug Discovery, By Technique, 2015�2022 (Liter)
Table 37 Canada: Market Size in Drug Discovery, By Technique, 2015�2022 (USD Million)
Table 38 Canada: Affinity Chromatography Resin Market Size in Drug Discovery, By Type, 2015�2022 (USD Million)
Table 39 Mexico: Chromatography Resin Market Size in Drug Discovery, By Technique, 2015�2022 (Liter)
Table 40 Mexico: Market Size in Drug Discovery, By Technique, 2015�2022 (USD Thousand)
Table 41 Mexico: Affinity Chromatography Resin Market Size in Drug Discovery, By Type 2015�2022 (USD Thousand)
Table 42 Europe: Chromatography Resin Market Size, By Country, 2015�2022 (Liter)
Table 43 Europe: Market Size, By Country, 2015�2022 (USD Million)
Table 44 Europe: Market Size, By Technique, 2015�2022 (Liter)
Table 45 Europe: Market Size, By Technique, 2015�2022 (USD Million)
Table 46 Europe: Affinity Chromatography Resin Market Size in Drug Discovery, By Type, 2015�2022 (USD Million)
Table 47 Germany: Chromatography Resin Market Size in Drug Discovery, By Technique, 2015�2022(Liter)
Table 48 Germany: Market Size in Drug Discovery, By Technique, 2015�2022 (USD Million)
Table 49 Germany: Affinity Chromatography Resin Market Size in Drug Discovery, By Type, 2015�2022 (USD Million)
Table 50 Scandinavia: Chromatography Resin Market Size in Drug Discovery, By Technique, 2015�2022 (Liter)
Table 51 Scandinavia: Market Size, By Technique, 2015�2022 (USD Thousand)
Table 52 Scandinavia: Affinity Chromatography Resin Market Size in Drug Discovery, By Type, 2015�2022 (USD Million)
Table 53 U.K.: Chromatography Resin Market Size in Drug Discovery, By Technique, 2015�2022 (Liter)
Table 54 U.K.: Market Size in Drug Discovery, By Technique, 2015�2022 (USD Million)
Table 55 U.K.: Affinity Chromatography Resin Market Size in Drug Discovery, By Type, 2015�2022 (USD Million)
Table 56 Austria & Switzerland: Chromatography Resin Market Size in Drug Discovery, By Technique, 2015�2022 (Liter)
Table 57 Austria & Switzerland: Market Size, By Technique, 2015�2022 (USD Thousand)
Table 58 Austria & Switzerland: Affinity Chromatography Resin Market Size in Drug Discovery, By Type, 2015�2022 (USD Million)
Table 59 Spain: Chromatography Resin Market Size in Drug Discovery, By Technique, 2015�2022 (Liter)
Table 60 Spain: Market Size in Drug Discovery, By Technique, 2015�2022 (USD Thousand)
Table 61 Spain: Affinity Chromatography Resin Market Size in Drug Discovery, By Type, 2015�2022 (USD Thousand)
Table 62 France: Chromatography Resin Market Size in Drug Discovery, By Technique, 2015�2022 (Liter)
Table 63 France: Market Size in Drug Discovery, By Technique, 2015�2022 (USD Thousand)
Table 64 France: Affinity Chromatography Resin Market Size in Drug Discovery, By Type, 2015�2022 (USD Thousand)
Table 65 Rest of Europe: Chromatography Resin Market Size in Drug Discovery, By Technique, 2015�2022 (Liter)
Table 66 Rest of Europe: Market Size, By Technique, 2015�2022 (USD Thousand)
Table 67 Rest of Europe: Affinity Chromatography Resin Market Size in Drug Discovery, By Type, 2015�2022 (USD Thousand)
Table 68 Asia-Pacific: Chromatography Resin Market Size in Drug Discovery, By Country, 2015�2022 (Liter)
Table 69 Asia-Pacific: Market Size in Drug Discovery, By Country, 2015�2022 (USD Million)
Table 70 Asia-Pacific: Market Size in Drug Discovery, By Technique, 2015�2022 (Liter)
Table 71 Asia-Pacific: Market Size in Drug Discovery, By Technique, 2015�2022 (USD Million)
Table 72 Asia-Pacific : Affinity Chromatography Resin Market Size in Drug Discovery, By Type, 2015�2022 (USD Million)
Table 73 Japan: Chromatography Resin Market Size in Drug Discovery, By Technique, 2015�2022 (Liter)
Table 74 Japan: Market Size in Drug Discovery, By Technique, 2015�2022 (USD Million)
Table 75 Japan: Affinity Chromatography Resin Market Size in Drug Discovery, By Type 2015�2022 (USD Million)
Table 76 China: Chromatography Resin Market Size, By Technique, 2015�2022 (Liter)
Table 77 China: Market Size, By Technique, 2015�2022 (USD Million)
Table 78 China : Affinity Chromatography Resin Market Size in Drug Discovery, By Type 2015�2022 (USD Million)
Table 79 India: Chromatography Resin Market Size in Drug Discovery, By Technique, 2015�2022 (Liter)
Table 80 India: Market Size in Drug Discovery, By Technique, 2015�2022 (USD Thousand)
Table 81 India: Affinity Chromatography Resin Market Size in Drug Discovery, By Type, 2015�2022 (USD Thousand)
Table 82 South Korea: Chromatography Resin Market Size in Drug Discovery, By Technique, 2015�2022 (Liter)
Table 83 South Korea: Market Size in Drug Discovery, By Technique, 2015�2022 (USD Thousand)
Table 84 South Korea: Affinity Chromatography Resin Market Size in Drug Discovery, By Type, 2015�2022 (USD Thousand)
Table 85 Rest of Asia-Pacific: Chromatography Resin Market Size in Drug Discovery, By Technique, 2015�2022 (Liter)
Table 86 Rest of Asia-Pacific: Market Size in Drug Discovery, By Technique, 2015�2022 (USD Thousand)
Table 87 Rest of Asia-Pacific: Affinity Chromatography Resin Market Size in Drug Discovery, By Type, 2015�2022 (USD Thousand)
Table 88 RoW: Chromatography Resin Market Size in Drug Discovery, By Country, 2015�2022 (Liter)
Table 89 RoW: Market Size in Drug Discovery, By Country, 2015�2022 (USD Million)
Table 90 RoW: Market Size in Drug Discovery, By Technique, 2015�2022 (Liter)
Table 91 RoW: Market Size in Drug Discovery, By Technique, 2015�2022 (USD Thousand)
Table 92 RoW: Affinity Chromatography Resin Market Size in Drug Discovery, By Type, 2015�2022 (USD Thousand)
Table 93 Brazil: Chromatography Resin Market Size in Drug Discovery, By Technique, 2015�2022 (Liter)
Table 94 Brazil: Market Size in Drug Discovery, By Technique, 2015�2022 (USD Thousand)
Table 95 Brazil: Affinity Chromatography Resin Market Size in Drug Discovery, By Type, 2015�2022 (USD Thousand)
Table 96 Middle East: Chromatography Resin Market Size in Drug Discovery, By Technique, 2015�2022 (Liter)
Table 97 Middle East: Market Size, By Technique, 2015�2022 (USD Thousand)
Table 98 Middle East: Affinity Chromatography Resin Market Size in Drug Discovery, By Type, 2015�2022 (USD Thousand)
Table 99 Africa: Chromatography Resin Market Size in Drug Discovery, By Technique, 2015�2022 (Liter)
Table 100 Africa: Market Size, By Technique, 2015�2022 (USD Thousand)
Table 101 Africa: Affinity Chromatography Resin Market Size in Drug Discovery, By Type, 2015�2022 (USD Thousand)
List of Figures (37 Figures)
Figure 1 Chromatography Resin Market in Drug Discovery: Market Segmentation
Figure 2 Chromatography Resin Market in Drug Discovery: Research Design
Figure 3 Market Size Estimation: Bottom-Up Approach
Figure 4 Market Size Estimation: Top-Down Approach
Figure 5 Chromatography Resin Market in Drug Discovery: Data Triangulation
Figure 6 Protein A Dominates Chromatography Resin Market in Drug Discovery
Figure 7 Affinity Chromatography Segment to Register Fastest Growth in Asia-Pacific
Figure 8 Asia-Pacific to Register Highest CAGR During Forecast Period
Figure 9 Asia-Pacific to Register Highest CAGR Between 2017 and 2022
Figure 10 Chromatography Resin Market in Drug Discovery, 2017 vs 2022
Figure 11 Asia-Pacific to Register Highest CAGR Between 2017 and 2022
Figure 12 U.S. Accounted for Largest Share in North America
Figure 13 China to Register Highest CAGR During Forecast Period
Figure 14 Affinity Chromatography Resin Segment to Register Highest CAGR During Forecast Period
Figure 15 China and India to Be Lucrative Markets for Chromatography Resin
Figure 16 Annual Approvals of Mab and Its Related Products in U.S. and Europe, 2003�2016
Figure 17 Mabs Therapeutics Market Growth, 2015�2020
Figure 18 Investment on Biopharmaceutical Research, 2005�2020 (USD Billion)
Figure 19 Porter�s Five Forces Analysis
Figure 20 Macroeconomic Indicators in China
Figure 21 Macroeconomic Indicators in U.S.
Figure 22 Macroeconomic Indicators in Germany
Figure 23 Synthetic Polymer to Register Highest CAGR During Forecast Period
Figure 24 Affinity Chromatography to Register Highest CAGR During Forecast Period
Figure 25 Asia-Pacific to Register Highest CAGR During Forecast Period
Figure 26 North American Market Snapshot: U.S. Accounts for Largest Share of Global Chromatography Resin Market
Figure 27 European Market Snapshot: Germany to Dominate Market During Forecast Period
Figure 28 Asia-Pacific Market Snapshot: China to Register Highest CAGR Between 2017 and 2022
Figure 29 RoW Market Snapshot: Brazil is the Largest Market
Figure 30 Dive Chart
Figure 31 Market Share Analysis for Chromatography Resin Market in Drug Discovery, 2016
Figure 32 GE Healthcare: Company Snapshot
Figure 33 Tosoh Corporation: Company Snapshot
Figure 34 Bio-Rad Laboratories, Inc.: Company Snapshot
Figure 35 Merck KGaA: Company Snapshot
Figure 36 Pall Corporation: Company Snapshot
Figure 37 Thermo Fisher Scientific Inc.: Company Snapshot


Growth opportunities and latent adjacency in Chromatography Resin Market