
Chromatography Resin Market

Chromatography Resin Market by Type (Natural, Synthetic, Inorganic Media), Technique ((Ion Exchange (Cation and Anion), Affinity (Hydrophobic Interaction, Mixed Mode)), Application (Pharmaceutical & Biotechnology), and Region - Global Forecast to 2030


CHROMATOGRAPHY RESINS MARKET SIZE & TRENDS
Source: Secondary Research, Interviews with Experts, MarketsandMarkets Analysis | Updated on : April 29, 2026
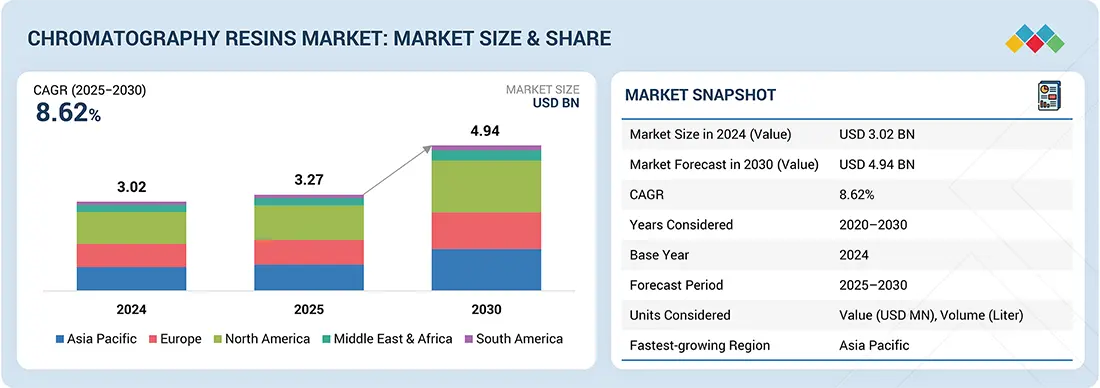
The global chromatography resins market size was valued at USD 3.27 billion in 2025 and is projected to reach USD 4.94 billion by 2030, growing at 8.62% cagr from 2025 to 2030. The chromatography resins market size is growing rapidly due to increasing biopharmaceutical production, rising demand for high-purity biomolecule separation, technological advancements in resin performance, expanding applications in food, diagnostics, and environmental analysis, and a growing focus on sustainable purification processes. Chromatography resin is a matrix of natural and synthetic polymers (dextran, cellulose, and agarose) or inorganic materials (silica and polyacrylamide). This matrix separates or purifies complex mixtures through a set of techniques.
KEY TAKEAWAYS
-
BY TYPEThe synthetic resins segment is growing at the fastest CAGR (8.70%) due to the superior chemical stability, customizable properties, and high efficiency of synthetic resins in separating complex biomolecules across various applications.
-
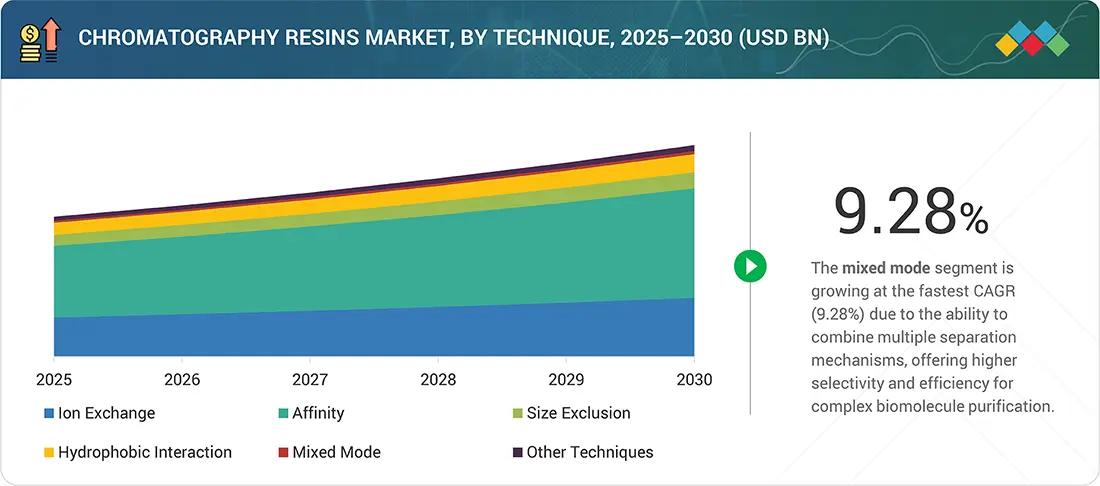
BY TECHNIQUEThe mixed mode technique is expanding at a CAGR of 9.28% as it offers versatile separation capabilities by combining multiple interaction mechanisms, improving purification of diverse and complex biological compounds.
-
BY APPLICATIONThe pharmaceutical & biotechnology application segment is growing at the fastest pace due to the surging demand for biologics, monoclonal antibodies, and vaccines, which require advanced chromatography resins for efficient and high-purity biomolecule separation.
-
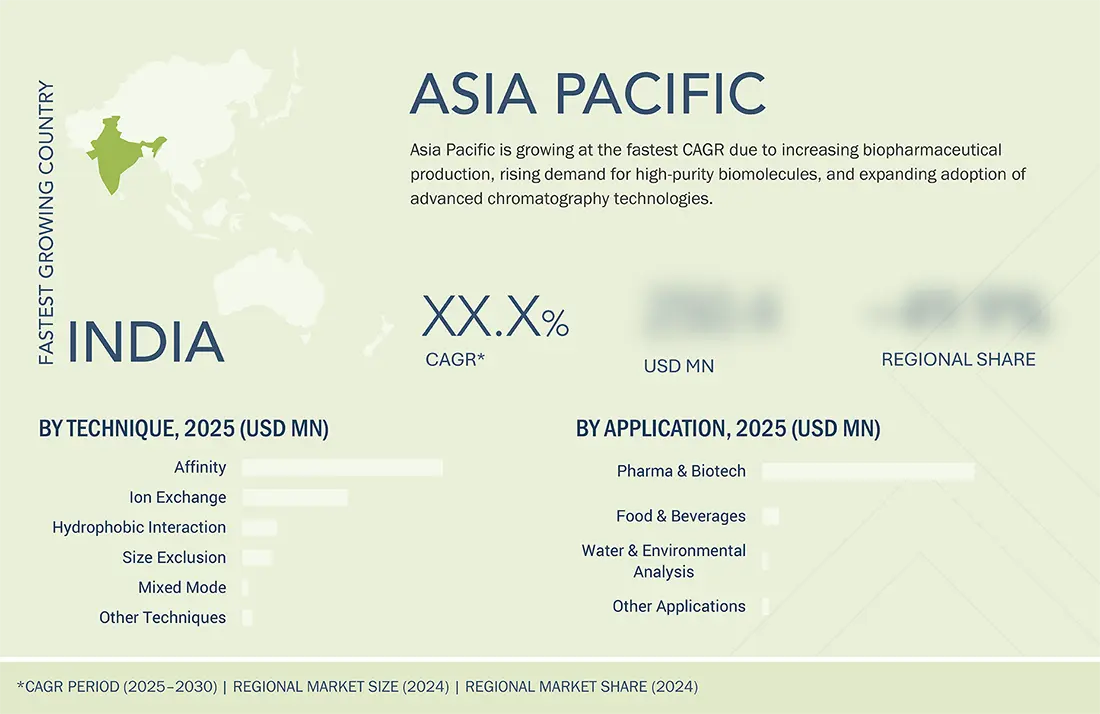
BY REGIONAsia Pacific is growing at the fastest pace due to the rapid expansion of the biopharmaceutical industry, increasing healthcare investments, growing research activities, and rising demand for advanced purification technologies in emerging markets.
-
COMPETITIVE LANDSCAPEThe major market players have adopted both organic and inorganic strategies, including product launches, expansions, acquisitions, and investments. For instance, Purolite launched a product named Praesto CH1 Chromatography Resin (Affinity), a 70µm agarose-based resin developed for specialized purification processes in biopharmaceutical manufacturing. It is engineered for high flow rates and robust performance in demanding applications.
The chromatography resins market is experiencing substantial growth due to the increasing demand for high-purity biomolecules in pharmaceuticals, biotechnology, food and beverage, and environmental analysis. The rising production of monoclonal antibodies, vaccines, and recombinant proteins is intensifying the demand for effective purification solutions. Technological advancements, including mixed mode and synthetic resins, enhance selectivity, stability, and performance, facilitating superior separation of intricate compounds. Moreover, rigorous regulatory standards for product safety and quality enhance market adoption. Asia Pacific is experiencing rapid expansion owing to the burgeoning biopharmaceutical manufacturing sector, escalating healthcare investments, and heightened research initiatives. Sustainability trends are promoting the utilization of environmentally friendly and reusable resins. The market growth is driven by expanding applications, technological advancements, and rising demand in emerging economies.
TRENDS & DISRUPTIONS IMPACTING CUSTOMERS' CUSTOMERS
Clients’ shifting priorities in pharmaceutical, biotechnology, food & beverage, and environmental analysis are transforming market demands, with a growing focus on efficiency, sustainability, and regulatory compliance driving the adoption of advanced chromatography resins. These evolving needs are reshaping business strategies and will significantly impact the future revenue mix, emphasizing innovative solutions, diversified applications, and expansion into emerging regions.
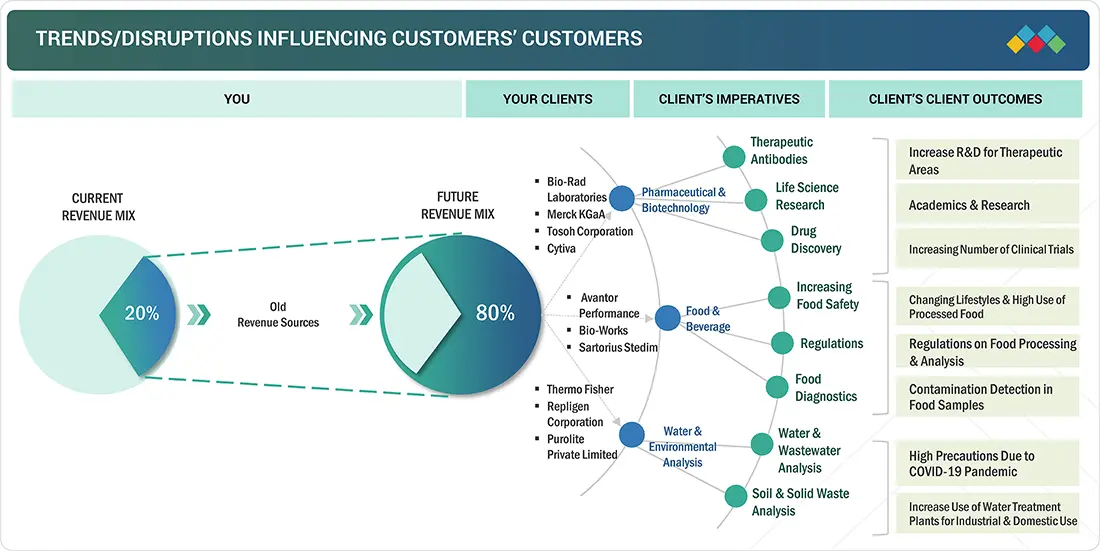
Source: Secondary Research, Interviews with Experts, MarketsandMarkets Analysis
CHROMATOGRAPHY RESINS MARKET DYNAMICS
Level
-
Growing pharmaceutical & biopharmaceutical R&D activities

-
Increasing demand for therapeutic antibodies

Level
-
Lack of skilled professionals

Level
-
Growing demand for chromatography in drug development & omics research

-
Growing demand for disposable pre-packed columns

Level
-
Presence of alternative technologies to chromatography

Source: Secondary Research, Interviews with Experts, MarketsandMarkets Analysis
Driver: Growing pharmaceutical & biopharmaceutical R&D activities
The expansion of pharmaceutical and biopharmaceutical research and development activities is a primary catalyst for the chromatography resins market. With the rapid advancement of novel biologics, monoclonal antibodies, vaccines, and gene therapies, the demand for efficient and reliable purification processes is intensifying. Chromatography resins are essential for the separation and purification of complex biomolecules in both early-stage research & development and clinical manufacturing. Increasing investments by pharmaceutical firms in research & and development facilities, particularly in emerging markets, are enhancing the demand for high-performance resins that provide superior selectivity, stability, and scalability. Moreover, rigorous regulatory standards for product purity and consistency amplify the necessity for sophisticated chromatography solutions. The expansion of R&D activities is propelling innovation and growth in the chromatography resins market.
Restraint: Lack of skilled professionals
The shortage of skilled professionals is a considerable constraint on the chromatography resins market. The effective management and enhancement of chromatography processes necessitate skilled professionals capable of executing intricate separation methods and guaranteeing superior product quality. Nonetheless, the industry is encountering a deficiency of skilled labor, especially in burgeoning areas where the biopharmaceutical and analytical sectors are swiftly advancing. The talent deficit results in operational inefficiencies, increased likelihood of process errors, and delayed implementation of advanced resin technologies. Moreover, insufficient training and expertise impede effective troubleshooting and process development, constraining the full potential of chromatography applications. Consequently, companies encounter difficulties in optimizing throughput, ensuring regulatory compliance, and sustaining cost-efficient production. Surmounting this constraint is essential for maintaining market expansion and technological progress.
Opportunity: Growing demand for chromatography in drug development & omics research
The increasing demand for chromatography in pharmaceutical development and omics research offers a significant opportunity for the chromatography resins market. With the pharmaceutical industry placing greater emphasis on targeted therapies and personalized medicines, the efficient separation and purification of complex biomolecules have become essential. Chromatography resins are crucial in multiple phases of drug discovery, encompassing protein characterization, biomarker identification, and impurity elimination. Furthermore, the emergence of omics technologies—namely genomics, proteomics, and metabolomics—necessitates high-resolution separation techniques for the analysis of intricate biological samples. The broadening application scope presents substantial growth potential, prompting investments in advanced resin technologies that ensure enhanced selectivity, reproducibility, and scalability. Overall, the integration of chromatography in cutting-edge drug development and omics research is set to fuel market growth.
Challenge: Presence of alternative technologies to chromatography
One major obstacle facing the market for chromatography resins is the existence of substitute technologies. Because of their reduced costs, ease of use, and quicker processing times, methods like membrane filtration, precipitation, crystallization, and electrophoresis are being used more for the separation and purification of biomolecules. In certain applications where chromatography may be more costly or complex, these substitutes may provide competitive solutions. Furthermore, some sophisticated separation techniques are appealing for small-scale or low-budget operations since they call for less specialized equipment or operational knowledge. Chromatography resins must therefore contend with competition in markets where affordability and usability are crucial considerations. To overcome this obstacle, resin technology must be continuously innovated to improve performance, selectivity, and cost-effectiveness in comparison to other separation techniques.
Chromatography Resin Market: COMMERCIAL USE CASES ACROSS INDUSTRIES
| COMPANY | USE CASE DESCRIPTION | BENEFITS |
|---|---|---|
 |
Purification of monoclonal antibodies and recombinant proteins in drug manufacturing | High purity and consistency; critical for therapeutic protein production; regulatory compliance |
 |
Protein purification and downstream processing in biopharmaceutical production | Efficient separation and high yield; large-scale production; enhanced product quality |
 |
Purification and separation of sweeteners and flavor compounds | Improved product consistency; safety and quality; efficient processing |
 |
Chromatography resins for heavy metal removal and water purification | Efficient contaminant removal; scalable process; quality water for industrial use |
 |
Water treatment processes using ion exchange and chromatographic separation for contaminants | Clean water output; compliance with environmental standards; cost-effective treatment |
Logos and trademarks shown above are the property of their respective owners. Their use here is for informational and illustrative purposes only.
CHROMATOGRAPHY RESINS MARKET ECOSYSTEM
The chromatography resins market ecosystem involves identifying and analyzing interconnected relationships among various stakeholders, including raw material suppliers, manufacturers, distributors, and end users. Raw material suppliers provide the key inputs required for resin production which further enables the manufacturers to develop chromatography resins using specialized technologies. Distributors and suppliers are the ones who establish contact between the manufacturing companies and end users to concentrate on the supply chain, increasing operational efficiency and profitability.
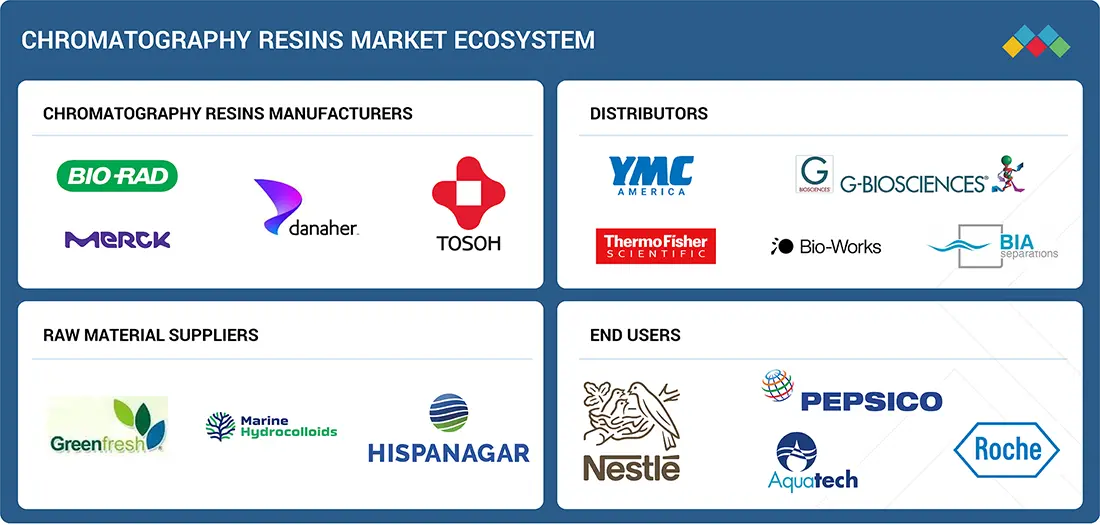
Logos and trademarks shown above are the property of their respective owners. Their use here is for informational and illustrative purposes only.
MARKET SEGMENTS
Source: Secondary Research, Interviews with Experts, MarketsandMarkets Analysis
Chromatography Resin Market, by Type
The natural polymers segment commands the largest share of the chromatography resins market due to its extensive use in the food, biotechnology, and pharmaceutical industries. Because of their superior biocompatibility, chemical stability, and non-toxicity, natural polymers such as cellulose, agarose, and dextran are highly prized for sensitive biomolecule separation. Their functional versatility and porous structure enable effective small molecule analysis, nucleic acid separation, and protein purification. As the natural polymer-based resins are biodegradable and made from renewable resources, their use is also being fueled by the growing need for environmentally friendly and sustainable solutions. All of these elements work together to make natural polymers the go-to option for chromatography applications, which greatly propels market expansion.
Chromatography Resin Market, by Technique
The affinity technique segment commands the largest market share in the chromatography resins industry, due to its remarkable specificity and high selectivity in separating target biomolecules. Proteins, antibodies, enzymes, and nucleic acids can all be purified using affinity chromatography resins, especially in biotechnology and pharmaceutical applications. This method allows for a highly effective separation with little contamination by taking advantage of particular interactions between the target molecule and the ligand that is affixed to the resin. Affinity resin adoption is further fueled by the rising demand for therapeutic proteins, monoclonal antibodies, and vaccines, as well as strict regulatory requirements for product purity. Further supporting the segment's dominance and its crucial role in improving process efficiency and product quality across R&D and production workflows are continuous improvements in ligand technology and resin performance.
Chromatography Resin Market, by Application
Due to the increasing demand for high-purity ingredients such as flavors, sweeteners, and nutritional additives, the food & beverage application segment is the second largest in the chromatography resins market. Chromatography resins ensure product safety, consistency, and quality by effectively separating and purifying sugars, amino acids, vitamins, and organic acids. Advanced purification solutions are becoming more widely used as a result of tighter food safety laws and rising consumer demand for clean-label products. Additionally, the growing food and beverage manufacturing industry in developing nations contributes to the market's expansion. Together, these elements contribute to the food & beverage segment's robust presence in the chromatography resins market, making it a crucial application area following the biotechnology and pharmaceutical sectors.
REGION
Asia Pacific is projected to grow at the fastest CAGR, while North America is expected to be the largest chromatography resins market during the forecast period.
North America dominates the market for chromatography resins due to the region's established biotechnology and pharmaceutical sectors, sophisticated research facilities, and strict regulations that require high-quality and pure products. The dominance is further reinforced by major players and substantial R&D investments. The biopharmaceutical and life sciences industries' explosive growth, rising healthcare spending, and the growing need for sophisticated purification technologies in developing nations such as China and India are all contributing to Asia Pacific's fastest rate of growth. Its accelerated growth trajectory is largely due to the region's cost advantages, the rise in contract manufacturing organizations (CMOs), and the growing emphasis on local manufacturing capabilities.
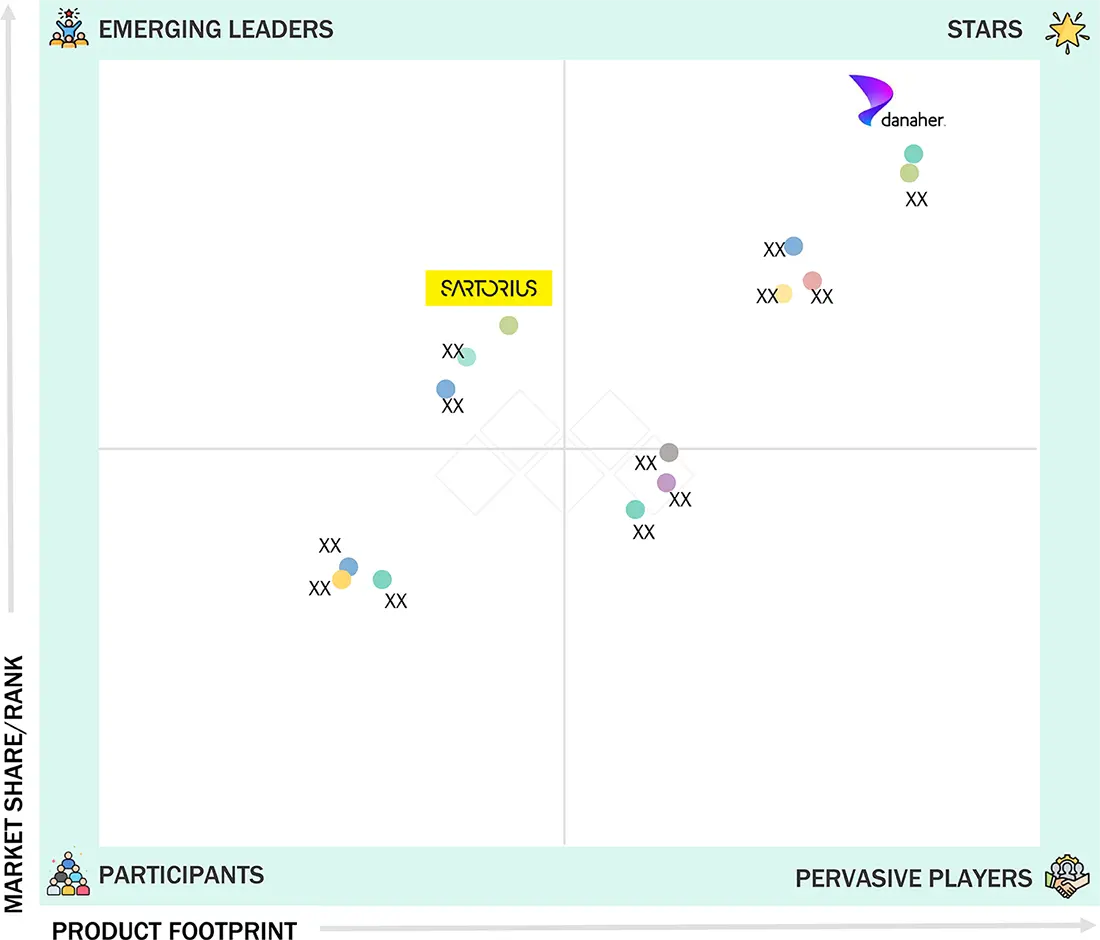
Chromatography Resin Market: COMPANY EVALUATION MATRIX
In the chromatography resins market matrix, Danaher Corporation (Star) leads with a strong market presence and wide product portfolio, driving large-scale adoption across industry. Sartorius Stedim Biotech S.A. (Emerging Leader) is gaining notable momentum within the chromatography resins market through the introduction of innovative solutions. These enhancements are positioning the company as a key player in the industry. While Danaher Corporation dominates with scale, Sartorius Stedim Biotech S.A. shows strong growth potential to advance toward the leaders’ quadrant.
Source: Secondary Research, Interviews with Experts, MarketsandMarkets Analysis
KEY MARKET PLAYERS
MARKET SCOPE
| REPORT METRIC | DETAILS |
|---|---|
| Market Size Value in 2024 | USD 3,023.8 MN |
| Revenue Forecast in 2030 | USD 4,938.6 MN |
| Growth Rate | CAGR of 8.62% from 2025−2030 |
| Actual Data | 2020−2030 |
| Base Year | 2024 |
| Forecast Period | 2025−2030 |
| Units Considered | Value (USD Million), Volume (Liter) |
| Report Coverage | Revenue forecast, company ranking, competitive landscape, growth factors, and trends |
| Segments Covered | • By Type: Natural Polymers, Synthetic Resins, and Inorganic Media • By Technique: Ion Exchange (Cation and Anion), Affinity, Hydrophobic Interaction, Size Exclusion, Mixed Mode, Other Techniques • By Application: Pharmaceutical & Biotechnology (Producti |
| Regional Scope | Asia Pacific, North America, Europe, South America, and Middle East & Africa |
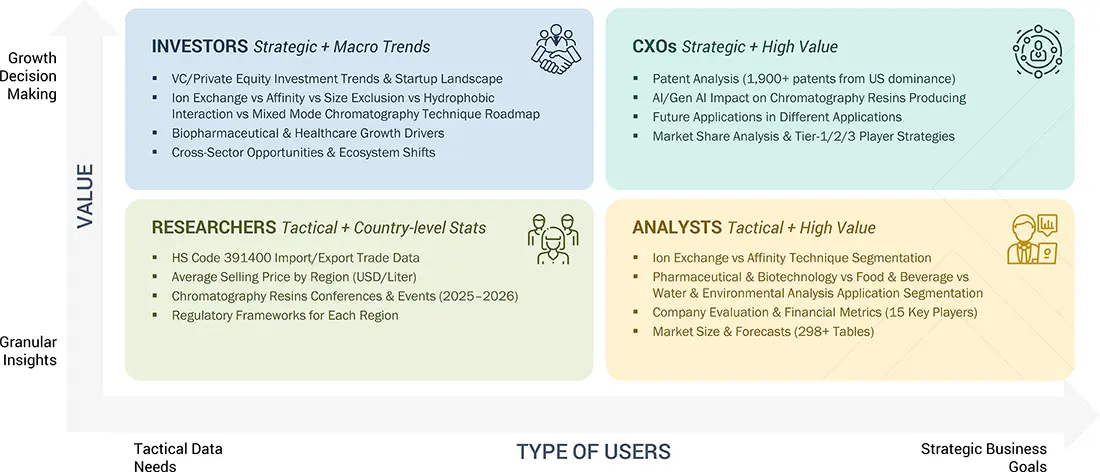
WHAT IS IN IT FOR YOU: Chromatography Resin Market REPORT CONTENT GUIDE
DELIVERED CUSTOMIZATIONS
We have successfully delivered the following deep-dive customizations:
| CLIENT REQUEST | CUSTOMIZATION DELIVERED | VALUE ADDS |
|---|---|---|
| US-based Chromatography Resins Manufacturer | • Detailed US company profiles of competitors (financials, product portfolio) • Customer landscape mapping by end-use sector • Partnership ecosystem analysis | • Identify interconnections and supply chain blind spots • Detect customer migration trends across industries • Highlight untapped customer clusters for market entry |
| Asia Pacific-Based Chromatography Resins Manufacturer | • Global & regional production capacity benchmarking • Customer base profiling across the application industries | • Strengthen forward integration strategy • Identify high-demand customers for long-term supply contracts • Assess supply-demand gaps for competitive advantage |
RECENT DEVELOPMENTS
- May 2025 : Purolite launched a product called Praesto CH1 Chromatography Resin. The product is a 70µm agarose-based resin developed for specialized purification processes in biopharmaceutical manufacturing. It is engineered for high flow rates and robust performance in demanding applications.
- May 2024 : Sartorius Stedim Biotech S.A. launched Sartobind Rapid A resin, a high-flow membrane chromatography resin designed for rapid and efficient monoclonal antibody (mAb) purification. It enables faster processing times and scalability for large-scale biopharmaceutical production.
- October 2023 : Repligen Corporation acquired Sweden-based Metenova AB to strengthen its fluid management portfolio in bioprocessing. The acquisition brought advanced magnetic mixing technologies and the MixOne single-use platform into Repligen’s product lineup, enhancing its capabilities in both upstream and downstream applications.
- February 2022 : Sartorius Stedim Biotech acquired the Novasep chromatography division as of February 7, 2022, following approval by the US Federal Trade Commission. The portfolio acquired comprises chromatography systems primarily suited for smaller biomolecules, such as oligonucleotides, peptides, and insulin, as well as innovative systems for the continuous manufacturing of biologics.
Table of Contents
 Exclusive indicates content/data unique to MarketsandMarkets and not available with any competitors.
Methodology
The study involved four major activities in estimating the market size for the chromatography resin market. Exhaustive secondary research was done to collect information on the market, the peer market, and the parent market. The next step was to validate these findings, assumptions, and sizing with industry experts across the value chain through primary research. Both top-down and bottom-up approaches were employed to estimate the complete market size. After that, the market breakdown and data triangulation procedures were used to estimate the market size of the segments and subsegments.
Secondary Research
Secondary sources used in this study included annual reports, press releases, and investor presentations of companies; white papers; certified publications; articles from recognized authors; and gold standard & silver standard websites such as Factiva, ICIS, Bloomberg, and others. The findings of this study were verified through primary research by conducting extensive interviews with key officials such as CEOs, VPs, directors, and other executives. The breakdown of profiles of the primary interviewees is illustrated in the figure below:
Primary Research
The chromatography resin market comprises several stakeholders, such as raw material suppliers, end-product manufacturers, and regulatory organizations in the supply chain. The demand side of this market is characterized by key opinion leaders in various applications for the chromatography resin market. The supply side is characterized by advancements in technology and diverse application industries. Various primary sources from both the supply and demand sides of the market were interviewed to obtain qualitative and quantitative information.
Breakdown of Primary Participants

Note: Tier 1, Tier 2, and Tier 3 companies are classified based on their market revenue in 2024/2025, available in the public domain, product portfolios, and geographical presence.
Other designations include consultants and sales, marketing, and procurement managers.
To know about the assumptions considered for the study, download the pdf brochure
| COMPANY NAME | DESIGNATION | |
|---|---|---|
| Danaher Corporation | Senior Manager | |
| Bio-Rad Laboratories, Inc. | Innovation Manager | |
| Bio-Works Technologies AB | Vice-President | |
| Tosoh Corporation | Production Supervisor | |
| Thermo Fisher Scientific Inc. | Sales Manager | |
Market Size Estimation
Both top-down and bottom-up approaches were used to estimate and validate the total size of the chromatography resin market. These methods were also used extensively to estimate the size of various subsegments in the market. The research methodology used to estimate the market size includes the following:
- The key players in the industry have been identified through extensive secondary research.
- The supply chain of the industry has been determined through primary and secondary research.
- All percentage shares, splits, and breakdowns have been determined using secondary sources and verified through primary sources.
- All possible parameters that affect the markets covered in this research study have been accounted for, viewed in extensive detail, verified through primary research, and analyzed to obtain the final quantitative and qualitative data.

Data Triangulation
After arriving at the overall market size—using the market size estimation processes as explained above—the market was split into several segments and subsegments. To complete the overall market engineering process and arrive at the exact statistics of each market segment and subsegment, data triangulation, and market breakdown procedures were employed, wherever applicable. The data was triangulated by studying various factors and trends from both the demand and supply sides in the chromatography resin industry.
Market Definition
Chromatography resins are insoluble matrix materials used in chromatography procedures to resolve, purify, or characterize complex mixtures of biological or chemical compounds. Different types of these resins have stationary phases designed to be natural polymers (agarose or cellulose), synthetic polymers, and inorganic media. They interact with target molecules, and this allows their accurate separation and purification by mechanisms that include ion exchange, affinity, hydrophobic interaction, size exclusion, and others. Chromatography resins find extensive use in industries like pharmaceutical industries, biotechnology industries, food & beverage manufacturing industries, environmental testing, and research laboratories. They are of paramount importance in single small-scale manufacturing of biopharmaceutical products, including monoclonal antibodies, vaccines, and recombinant proteins. The chromatography resin market includes areas of production and development of these resins as well as their distribution, which have been motivated by the modernization in the bioseparation technologies, regulatory requirements, and the growing investment in the life sciences and analytical testing.
Stakeholders
- Chromatography Resin Manufacturers
- Chromatography Resin Distributors
- Raw Material Suppliers
- Service Providers
- Packaging Companies
- Government and Research Organizations
Report Objectives
- To define, describe, segment, and forecast the transfection technologies market by product type, method, application, end user, and region
- To provide detailed information about the major factors (such as drivers, restraints, opportunities, and challenges) influencing the market growth
- To strategically analyze micromarkets1 with respect to individual growth trends, prospects, and contributions to the overall market
- To analyze market opportunities for stakeholders and provide details of the competitive landscape for key players
- To forecast the size of the transfection technologies market in five main regions: North America, Europe, Asia Pacific, Latin America, and the Middle East & Africa, along with their respective key countries
- To profile the key players in the transfection technologies market and comprehensively analyze their core competencies2 and market shares
- To track and analyze competitive developments, such as product launches, acquisitions, expansions, collaborations, agreements, and partnerships of the leading players in the transfection technologies market
- To benchmark players within the transfection technologies market using the ‘Competitive Leadership Mapping’ framework, which analyzes market players based on various parameters, including product portfolio, geographic reach, and market share/rank
Key Questions Addressed by the Report
Who are the major players in the chromatography resin market?
Major players include Bio-Rad Laboratories, Inc. (US), Merck KGaA (Germany), Danaher Corporation (US), Tosoh Corporation (Japan), Sartorius Stedim Biotech S.A. (France), Bio-Works Technologies AB (Sweden), Avantor, Inc. (US), and Purolite (US), among others.
What are the drivers and opportunities for the chromatography resin market?
Key drivers include increased pharmaceutical and biotech R&D, growing demand for therapeutic antibodies and biosimilars, concern for food safety, and rising adoption of LC-MS in analytics. Opportunities lie in the growth of contract manufacturing and CROs, demand for disposable pre-packed columns, and increasing use in drug development, omics research, and proteomics.
Which strategies are the key players focusing on in the chromatography resin market?
The main strategies include product launches, partnerships, mergers & acquisitions, agreements, and geographical expansions to increase global market presence.
What is the expected growth rate of the chromatography resin market between 2025 and 2030?
The market is projected to grow at a CAGR of 8.6% during the forecast period (2025–2030).
Which major factors are expected to restrain the growth of the chromatography resin market?
Growth restraints include performance limitations in harsh environments, high costs, and significant equipment investment requirements.
Need a Tailored Report?
Customize this report to your needs
Get 10% FREE Customization
Customize This ReportPersonalize This Research
- Triangulate with your Own Data
- Get Data as per your Format and Definition
- Gain a Deeper Dive on a Specific Application, Geography, Customer or Competitor
- Any level of Personalization
Let Us Help You
- What are the Known and Unknown Adjacencies Impacting the Chromatography Resin Market
- What will your New Revenue Sources be?
- Who will be your Top Customer; what will make them switch?
- Defend your Market Share or Win Competitors
- Get a Scorecard for Target Partners

Custom Market Research Services
We Will Customise The Research For You, In Case The Report Listed Above Does Not Meet With Your Requirements
Get 10% Free CustomisationTESTIMONIALS

We at Nissan Chemicals Corporation have been clients of MarketsandMarkets for more than a year now. We recently consulted MarketsandMarkets for a study, the team at MarketsandMarkets was extremely professional and organized. The business insights were very detailed and aligned well with our expectations that really helped us formulate the Business Plans and device new strategies for development themes. MarketsandMarkets offers a unique combination of expertise and dedicated engagement model. Their research findings have helped us in designing our Pricing Strategy which will make it easier for us to predict the future sales and profits for the next ten years. We look forward to working with MarketsandMarkets in the future.
VP of Strategy & New Business Development
Leading Specialty Chemical Company
The MarketsandMarkets Engagement Model, composed of both the Knowledge Store and advisory custom research, has greatly helped us in understanding our markets and making strategic decisions. The Knowledge Store is a fast way to allow everyone in our organization to understand more about most any market they are interested in. The ability to then get custom research done and get answers to specific strategic questions and market insight has been spectacular. The Markets and Markets team feel more like colleagues than vendors and their services have helped us change our culture where statements of things like growth opportunities and competitive position are always backed by industry research.

Rich Gibson,
Director, Corporate Strategy
Milliken & Company,
Leading Industrial Manufacturer of specialty chemical, floor covering, performance and protective textile materials, and healthcaremilliken.com
MarketsandMarkets is a trusted resource that helps us to better understand markets that are near-adjacencies-whether its technology, value chain or geography. Their Knowledge Store platform provides a dashboard of markets and their characteristics which is easy to use and saves us time.
Adam Shaw,
Market Development and Strategy Manager
AdvanSix Inc. USA,
An American Leader in Chemicalswww.advansix.com
The Knowledge Store from MarketsandMarkets is a valuable tool which has helped my team acquire greater insight in to the end markets that our business serves. This has enabled us to help our company build stronger strategies throughout our planning process.
TOSHIO KINOSHITA
Senior Chif Consultion Research & Consulting Division
Mitsubishi Chemical Research Corporation,
Leading Manufacturer of Chemical Productswww.mitsubishichem-res.co.jp/en/

We recently engaged with MarketsandMarkets for a study, the team not only clearly understood our business objectives but was also extremely professional in the way they handled the entire project. The study was efficiently conducted in a phase-wise manner, and the engagement model furnished us with high-quality business insights that far exceeded our expectations at each phase. We were especially happy that MarketsandMarkets could provide us with both, an English as well as a Japanese version of the study. A special thanks to the Analyst Team and Client Services Team, whose fluency in Japanese enhanced our comfort level, as we could converse with them in our preferred language.
Independent entrepreneurs
Arrow Precision
We approached MarketsandMarkets for study on Proppants Market, and their work exceeded our expectations. The study conducted was comprehensive and enabled us to view the market through the various dimensions. In addition, the team was extraordinarily responsive throughout the process and resolved our queries on time. I strongly recommend MarketsandMarkets and will certainly consider them for additional market assessments we will need in the future.
Global engineering company, Japan
Deputy Manager,
Strategic Planning OfficeThe high-quality insights shared by the MarketsandMarkets team helped us understand the pharmaceutical plant designers in a specific geography. It also captured the risks that we may likely face in communicating with our potential partners. The study would enable us identify partners, which would impact our future growth.
- China Chromatography Resin Market
- Japan Chromatography Resin Market
- South Korea Chromatography Resin Market
- India Chromatography Resin Market
- Australia Chromatography Resin Market
- New Zealand Chromatography Resin Market
- US Chromatography Resin Market
- Canada Chromatography Resin Market
- Mexico Chromatography Resin Market
- Germany Chromatography Resin Market
- France Chromatography Resin Market
- UK Chromatography Resin Market
- Italy Chromatography Resin Market
- Spain Chromatography Resin Market
- Austria Chromatography Resin Market
- Switzerland Chromatography Resin Market
- Saudi Arabia Chromatography Resin Market
- UAE Chromatography Resin Market
- Brazil Chromatography Resin Market


Growth opportunities and latent adjacency in Chromatography Resin Market