Cloud-based Data Management Services Market

Cloud-based Data Management Services Market by Service Type (Integration, Data Security & Backup, Quality-as-a-Service), Service Model, Deployment Mode, Vertical (BFSI, IT & Telecom, Retail & Consumer Goods) and Region - Global Forecast to 2028

Report Code: TC 3003 Dec, 2023, by marketsandmarkets.com

[255 Pages Report] The cloud-based data management services market is expected to grow from USD 40.2 billion in 2023 to USD 141.7 billion by 2028 at a Compound Annual Growth Rate (CAGR) of 28.7% during the forecast period. Cloud-based data management services are of significant importance as these services offer crucial benefits to enterprises, such as rapid deployments and optimized capital expenditures and maintenance costs. It also makes an enterprise more dynamic, which is the need of the hour in changing business requirements. Along with these benefits, some restraints, such as data security, migration, backup, and recovery, can impact market growth if not managed properly. Cloud-based data management services broadly focus on integration, security, backup, and quality services. The integration services cater to enterprise needs such as data conversion, migration, integration, Master Data Management (MDM), data synchronization, data virtualization, data exchange, and implementation of Service Oriented Architectures (SOAs). Data security & backup services focus on areas such as data protection, data archiving, data governance, and data recovery. Quality-as-a-service includes data cleansing, scrubbing, updating, remediation, standardization, and de-duplication.

Cloud-based Data Management Services Market

To know about the assumptions considered for the study, Request for Free Sample Report

Cloud-based Data Management Services Market Opportunities

To know about the assumptions considered for the study, download the pdf brochure

Recession Impact on the Cloud-based Data Management Services Market

The global cloud-based data management services market has faced a multifaceted impact due to the convergence of economic downturns, geopolitical tensions, a global pandemic, inflation, and rising interest rates. The recession prompted businesses to reevaluate their spending, affecting IT budgets and investments in cloud-based data management services. The Russia-Ukraine war introduced geopolitical uncertainties, raising concerns about data security and compliance, particularly with cross-border data transfers. The COVID-19 pandemic initially accelerated the adoption of cloud services as organizations adapted to remote work requirements, but it also led to economic uncertainties impacting businesses’ financial capabilities. Inflation and rising interest rates have added additional pressures, increasing business operational costs and potentially influencing strategic investment decisions. These factors collectively have resulted in a more cautious approach to technology spending, impacting the growth trajectory of the global cloud-based data management services market. Companies in this sector must navigate these challenges strategically, emphasizing flexibility and innovation to address evolving market dynamics and changing customer needs.

Cloud-based Data Management Services Market Dynamics

Driver:  Simplified data backup and disaster recovery

Cloud-based data management services, simplified data back-up, and disaster recovery capabilities are driving their widespread adoption. Businesses increasingly rely on these services due to their convenience and efficiency in safeguarding critical data. With the cloud, companies can quickly and automatically back up their data, eliminating the need for complex, manual backup processes and expensive on-premises infrastructure. Moreover, the cloud’s scalability allows for seamless storage expansion, ensuring that data back-ups can grow with the organization’s needs. Additionally, the robust disaster recovery features in the cloud enable swift data restoration during unforeseen disruptions or emergencies, reducing downtime and ensuring business continuity. This simplicity, coupled with the reliability and cost-effectiveness of cloud-based data back-up and disaster recovery, is a key driver in the migration towards these services, empowering organizations to securely protect their data assets while focusing on their core business objectives.

Restraint: Lack of training and skill gap

The absence of adequate training and skill gaps can significantly impact the adoption of cloud-based data management services. Cloud technologies, while powerful, can be complex to navigate, and organizations often struggle to harness their full potential without a skilled workforce. Insufficient training and knowledge gaps can lead to operational challenges, from misconfigurations and security vulnerabilities to inefficient resource allocation. Furthermore, it can hinder the adoption rate, as employees may hesitate to embrace new technologies they are uncomfortable using. This can result in slower migration to cloud-based data management services and may compromise an organization’s ability to capitalize on the cloud's scalability, cost-efficiency, and advanced analytics capabilities. Addressing these skill gaps through training and upskilling initiatives is crucial to empower employees and ensure that organizations can successfully adopt and optimize cloud-based data management services, realizing their full benefits.

Opportunity: Demand for scalability, accessibility, and flexibility among businesses

By utilizing the cloud for master data management, businesses can achieve a consolidated and reliable view of their master data, including customer information, product details, financial records, and more. This centralized management, facilitated by cloud-based master data management solutions, allows for a single source of truth, ensuring data consistency and accuracy across various departments and systems. The cloud’s scalability and accessibility enable real-time updates and wider data availability, supporting efficient collaboration and decision-making. Additionally, cloud-based master data management systems provide the flexibility to integrate diverse data sources and formats, enabling businesses to adapt and evolve with changing requirements while maintaining data quality and integrity. The cloud-based master data management approach streamlines data governance. It enhances operational efficiency, enabling businesses to harness accurate and reliable data to fuel strategic insights and drive better decision-making processes.

Challenge: The higher expense of storing data on the cloud

The higher expense of storing data in the cloud poses a notable challenge in the widespread adoption of cloud-based data management services. While the cloud offers scalability and flexibility, the cost structure for storing, managing, and accessing data can become a barrier for many organizations. As data volumes grow, so do the expenses associated with storing and managing this data. Unforeseen costs, such as charges for data retrieval, network egress, or maintaining high availability, can lead to significant budgetary concerns. This unpredictability in pricing and the potential for escalating costs make it challenging for businesses to accurately forecast and manage their expenses effectively, potentially hindering the seamless adoption and utilization of cloud-based data management services. Addressing these cost-related challenges necessitates a meticulous strategy focused on optimizing data storage, leveraging efficient data archiving techniques, and constantly monitoring and adjusting usage to align with budgetary constraints.

Cloud-based Data Management Services Market Ecosystem

Top Companies in Cloud-based Data Management Services Market

\

Based on the service model, the SaaS segment holds a larger market size during the forecast period.

The cloud-based data management services market has experienced a remarkable surge in Software-as-a-Service (SaaS) adoption, driven by its compelling advantages to businesses. A significant portion of this growth can be attributed to the increased adoption of SaaS in data management services. For instance, leading companies such as Salesforce and Microsoft Azure have witnessed substantial upticks in their cloud-based data management solutions. Salesforce’s SaaS-based Customer Relationship Management (CRM) platform reported a 26% year-over-year revenue increase in the last fiscal quarter, showcasing the robust demand for cloud-driven data solutions. Microsoft Azure’s SaaS offerings for data analytics and storage also experienced a 36% revenue growth in the same period.

Based on  Vertical, the healthcare & life sciences segment is expected to grow at the highest CAGR during the forecast period.

Healthcare companies utilize cloud platforms to securely store, access, and manage patient data, medical histories, treatment plans, and other critical health information. Cloud-based EHR systems offer several advantages, including centralized storage, real-time accessibility, and seamless collaboration among healthcare providers. The cloud facilitates the secure sharing of patient information across different departments and healthcare facilities, promoting coordinated care and improving overall patient outcomes. Further, Cloud-based clinical decision support systems (CDSS) offer real-time insights to healthcare professionals by processing patient information, identifying patterns, and providing evidence-based recommendations at the point of care. This approach not only enhances diagnostic accuracy but also supports personalized treatment plans. The scalability of cloud services enables healthcare organizations to efficiently manage the growing volume of clinical data, ensuring that CDSS can continuously evolve and adapt to incorporate the latest medical research and best practices.

Based on Region, North America holds the largest market share during the forecast period.

North America, particularly the United States and Canada, remained economic powerhouses with robust GDP growth. The region benefited from diverse industries, including technology, finance, healthcare, and manufacturing. ICT played a crucial role in North America’s economic development. The region boasted advanced telecommunications infrastructure, high internet penetration rates, and widespread access to digital technologies. Investments in 5G technology were underway to enhance connectivity and support the growing demand for data-intensive applications. The adoption of cloud services is exemplified by the fact that, as of 2022, over 80% of North American enterprises have already embraced cloud computing in some form, as reported by the Cloud Security Alliance. Notably, companies are increasingly turning to cloud-based data management services to leverage the scalability and cost-effectiveness offered by cloud platforms. For instance, industry giants like Amazon Web Services (AWS), Microsoft Azure, and Google Cloud have witnessed a substantial uptick in demand for their cloud-based data solutions, with AWS reporting a revenue of $13.5 billion in the first quarter of 2023, marking a 32% year-over-year increase. This is likely to boost the adoption of cloud-based data management services in the region.

North American Cloud-based Data Management Services Market Size, and Share

Key Market Players

The cloud-based data management services market is dominated by a few globally established players such as IBM (US), Fujitsu (Japan), Cisco (US), Dell Technologies (US), and HPE (US), among others, are the key vendors that secured video processing platform contracts in last few years. These vendors can bring global processes and execution expertise to the table; the local players only have local expertise. Driven by increased disposable incomes, easy access to knowledge, and fast adoption of technological products, buyers are more willing to experiment/test new things in the cloud-based data management services market.

Get online access to the report on the World's First Market Intelligence Cloud

  • Easy to Download Historical Data & Forecast Numbers
  • Company Analysis Dashboard for high growth potential opportunities
  • Research Analyst Access for customization & queries
  • Competitor Analysis with Interactive dashboard
  • Latest News, Updates & Trend analysis
Request Sample

Scope of the Report

Report Metrics

Details

Market size available for years

2018–2028

Base year considered

2022

Forecast period

2023–2028

Forecast units

Value (USD Million/Billion)

Segments Covered

Service Type, Service Model, Deployment Mode, Vertical

Regions covered

North America, Europe, Asia Pacific, Middle East & Africa, and Latin America

Companies covered

IBM (US), Fujitsu (Japan), Cisco (US), Dell Technologies (US), HPE (US), NetApp (US), Informatica (US), SAS (US), Actian (US), Oracle (US), SAP (Germany), Google (US), AWS (US), Accenture (Ireland), Snowflake (New Zealand), Talend (US), Hitachi Vantara (US), Cloudera (US), Teradata (US), Experian (Ireland), Alibaba Cloud (China), TIBCO Software (US),  Cohesity (US), and Commvault (US), and others

This research report categorizes the cloud-based data management services market to forecast revenue and analyze trends in each of the following submarkets:

Based on Service Type:
  • Integration Services
  • Data Security & Backup Services
  • Quality-as-a-Service
Based on the Service Model:
  • Software-as-a-Service
  • Platform-as-a-Service
  • Infrastructure-as-a-Service
Based on the deployment mode:
  • Public Cloud
  • Private Cloud
Based on verticals:
  • BFSI
  • IT & Telecom
  • Retail & Consumer Goods
  • Government & Public Sector
  • Energy & Utilities
  • Manufacturing
  • Healthcare & Life Sciences
  • Education
  • Media & Entertainment
  • Research & Consulting Services
  • Other Verticals
Based on Region:
  • North America
    • US
    • Canada
  • Europe
    • UK
    • Germany
    • Italy
    • Rest of Europe
  • Asia Pacific
    • China
    • Japan
    • India
    • Rest of Asia Pacific
  • Middle East & Africa
    • GCC
    • Rest of Middle East & Africa
  • Latin America
    • Brazil
    • Mexico
    • Rest of Latin America

Recent Developments:

  • In September 2023, IBM enhanced its IBM Cloud Security and Compliance Center, a collection of advanced cloud security and compliance solutions, to enable enterprises to effectively manage risks and safeguard data across their hybrid and multi-cloud environments and workloads.
  • In June 2023, NetApp announced enhancements to its BlueXP offering, which included streamlined backup and recovery processes, expanded data protection across various environments, and compatibility with highly secure settings such as government facilities. These updates ensured consistent operations, delivering a uniform experience across all applications regardless of the deployment environment.
  • In November 2022, Dell Technologies announced an enhancement to its Dell PowerProtect Manager, a data protection solution that included Dell PowerProtect Data Manager Appliance, simplifying the data back-up and recovery process. It offered software-defined architecture, highly secured access, and a consistent user experience.
  • In September 2022, Fujitsu strengthened its security services capabilities by acquiring InPhySec, a New Zealand-based cyber security firm.
  • In June 2022, HPE introduced enhancements and new cloud services for HPE GreenLake. HPE launched eight new HPE GreenLake cloud services, giving customers more choice, control, and predictability for their enterprise cloud delivery.

Frequently Asked Questions (FAQ):

To speak to our analyst for a discussion on the above findings, click Speak to Analyst

TABLE OF CONTENTS
 
1 INTRODUCTION (Page No. - 24)
    1.1 STUDY OBJECTIVES 
    1.2 MARKET DEFINITION 
           1.2.1 INCLUSIONS AND EXCLUSIONS
    1.3 MARKET SCOPE 
           1.3.1 MARKET SEGMENTATION
           1.3.2 REGIONS COVERED
    1.4 YEARS CONSIDERED 
    1.5 CURRENCY CONSIDERED 
    TABLE 1 USD EXCHANGE RATES, 2018–2022 
    1.6 STAKEHOLDERS 
    1.7 SUMMARY OF CHANGES 
           1.7.1 RECESSION IMPACT
 
2 RESEARCH METHODOLOGY (Page No. - 30)
    2.1 RESEARCH DATA 
           FIGURE 1 CLOUD-BASED DATA MANAGEMENT SERVICES MARKET: RESEARCH DESIGN
           2.1.1 SECONDARY DATA
           2.1.2 PRIMARY DATA
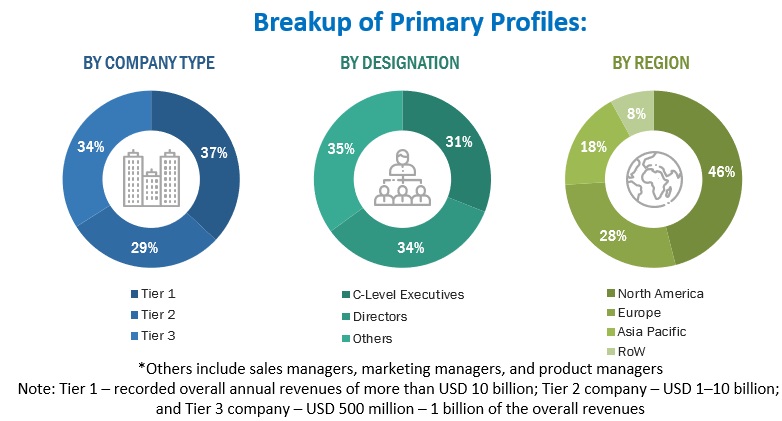
                    2.1.2.1 Breakup of primary profiles
                               FIGURE 2 BREAKUP OF PRIMARY INTERVIEWS, BY COMPANY TYPE, DESIGNATION, AND REGION
                    2.1.2.2 Key industry insights
    2.2 MARKET FORECAST 
           TABLE 2 FACTOR ANALYSIS
    2.3 MARKET SIZE ESTIMATION 
           FIGURE 3 MARKET: TOP-DOWN AND BOTTOM-UP APPROACHES
           2.3.1 TOP-DOWN APPROACH
                    FIGURE 4 MARKET SIZE ESTIMATION METHODOLOGY: TOP-DOWN APPROACH
           2.3.2 BOTTOM-UP APPROACH
                    FIGURE 5 MARKET SIZE ESTIMATION METHODOLOGY: BOTTOM-UP APPROACH
                    FIGURE 6 CLOUD-BASED DATA MANAGEMENT SERVICES MARKET: RESEARCH FLOW
                    FIGURE 7 APPROACH 1 (SUPPLY SIDE): REVENUE OF SERVICES FROM VENDORS
                    FIGURE 8 BOTTOM-UP APPROACH (SUPPLY SIDE): COLLECTIVE REVENUE OF VENDORS
                    FIGURE 9 SUPPLY SIDE: CAGR PROJECTIONS
                    FIGURE 10 APPROACH 2 (BOTTOM-UP): REVENUE GENERATED BY VENDORS FROM EACH SERVICE TYPE SEGMENT
                    FIGURE 11 APPROACH 2 (DEMAND SIDE): REVENUE GENERATED FROM DIFFERENT SERVICE TYPES
    2.4 DATA TRIANGULATION 
    2.5 RESEARCH ASSUMPTIONS 
    2.6 IMPACT OF RECESSION ON GLOBAL MARKET 
    2.7 LIMITATIONS AND RISK ASSESSMENT 
 
3 EXECUTIVE SUMMARY (Page No. - 46)
    FIGURE 12 FASTEST-GROWING SEGMENTS IN CLOUD-BASED DATA MANAGEMENT SERVICES MARKET, 2023–2028 
    FIGURE 13 QUALITY-AS-A-SERVICE SEGMENT TO ACCOUNT FOR HIGHEST GROWTH DURING FORECAST PERIOD 
    FIGURE 14 SAAS SEGMENT TO ACCOUNT FOR LARGEST SERVICE MODEL MARKET DURING FORECAST PERIOD 
    FIGURE 15 PRIVATE CLOUD SEGMENT TO GROW AT HIGHER CAGR DURING FORECAST PERIOD 
    FIGURE 16 IT & TELECOM TO TAKE OVER AS LARGEST VERTICAL BY 2028 FROM BFSI IN 2023 
    FIGURE 17 MARKET: REGIONAL SNAPSHOT 
 
4 PREMIUM INSIGHTS (Page No. - 51)
    4.1 OVERVIEW OF CLOUD-BASED DATA MANAGEMENT SERVICES MARKET 
           FIGURE 18 INCREASED DEMAND FOR IMPROVED DATA USABILITY AND QUALITY TO DRIVE MARKET IN COMING YEARS
    4.2 MARKET, BY SERVICE TYPE 
           FIGURE 19 CLOUD-BASED DATA INTEGRATION SERVICES TO ACCOUNT FOR LARGEST MARKET SHARE DURING FORECAST PERIOD
    4.3 MARKET, BY SERVICE MODEL 
           FIGURE 20 SAAS MODEL TO ACCOUNT FOR LARGEST SERVICE MARKET DURING FORECAST PERIOD
    4.4 MARKET, BY DEPLOYMENT MODE 
           FIGURE 21 PUBLIC CLOUD DATA MANAGEMENT SERVICES TO ACCOUNT FOR LARGER SHARE DURING FORECAST PERIOD
    4.5 MARKET, BY VERTICAL 
           FIGURE 22 BFSI VERTICAL TO ACCOUNT FOR LARGEST MARKET SHARE IN 2023
    4.6 MARKET: REGIONAL SCENARIO 
           FIGURE 23 ASIA PACIFIC TO EMERGE AS BEST MARKET FOR INVESTMENT IN NEXT FIVE YEARS
 
5 MARKET OVERVIEW AND INDUSTRY TRENDS (Page No. - 54)
    5.1 INTRODUCTION 
    5.2 MARKET DYNAMICS 
           FIGURE 24 CLOUD-BASED DATA MANAGEMENT SERVICES MARKET DYNAMICS
           5.2.1 DRIVERS
                    5.2.1.1 Simplified data backup and disaster recovery
                    5.2.1.2 Increase in demand for improved data usability and quality
                    5.2.1.3 Growth in necessity for workplace collaboration
                    5.2.1.4 Higher emphasis on business continuity
           5.2.2 RESTRAINTS
                    5.2.2.1 Performance issues
                    5.2.2.2 Lack of training and skill gap
           5.2.3 OPPORTUNITIES
                    5.2.3.1 Demand for scalability, accessibility, and flexibility among businesses
                    5.2.3.2 Growth in adoption of hybrid and multi-cloud environments
           5.2.4 CHALLENGES
                    5.2.4.1 Higher expenses of storing data on cloud
                    5.2.4.2 Data security and privacy concerns
                               FIGURE 25 CHALLENGES FACED BY LARGE ORGANIZATIONS WITH CLOUD OPERATIONS
    5.3 CASE STUDY ANALYSIS 
           5.3.1 PREDICTX EMPOWERED INSIGHTS WITH AVALANCHE CLOUD DATA PLATFORM
           5.3.2 NETAPP HELPED KÄRCHER SWITCH TO CLOUD AND ENHANCE INNOVATION
           5.3.3 INFORMATICA SUPPORTED LOWELL GROUP FINANCIAL HEALTH WITH DATA-DRIVEN SERVICES
    5.4 SUPPLY CHAIN ANALYSIS 
           FIGURE 26 CLOUD-BASED DATA MANAGEMENT SERVICES MARKET: SUPPLY CHAIN
    5.5 ECOSYSTEM MAPPING 
           FIGURE 27 MARKET: ECOSYSTEM
    5.6 TECHNOLOGICAL ANALYSIS 
           5.6.1 KEY TECHNOLOGY
                    5.6.1.1 Cloud Storage
                    5.6.1.2 Data Warehousing
                    5.6.1.3 Cloud Computing
           5.6.2 COMPLEMENTARY TECHNOLOGY
                    5.6.2.1 Big Data and Analytics
                    5.6.2.2 Artificial Intelligence and Machine Learning
                    5.6.2.3 Internet of Things
                    5.6.2.4 Serverless Computing
           5.6.3 ADJACENT TECHNOLOGY
                    5.6.3.1 Edge Computing
                    5.6.3.2 Blockchain
    5.7 INDICATIVE PRICING ANALYSIS 
           TABLE 3 ACTIAN: PRICING ANALYSIS OF VENDORS IN CLOUD-BASED DATA MANAGEMENT SERVICES MARKET
           TABLE 4 DVSUM: PRICING ANALYSIS OF VENDORS IN MARKET
    5.8 BUSINESS MODEL ANALYSIS 
           FIGURE 28 BUSINESS MODEL: MARKET
    5.9 PATENT ANALYSIS 
           FIGURE 29 NUMBER OF PATENTS PUBLISHED, 2012–2022
           FIGURE 30 TOP FIVE PATENT OWNERS (GLOBAL), 2022
           TABLE 5 US: TOP TEN PATENT APPLICANTS, 2022
    5.10 PORTER’S FIVE FORCES ANALYSIS 
           FIGURE 31 MARKET: PORTER’S FIVE FORCES ANALYSIS
           TABLE 6 MARKET: PORTER’S FIVE FORCES ANALYSIS
           5.10.1 DEGREE OF COMPETITION
           5.10.2 BARGAINING POWER OF SUPPLIERS
           5.10.3 BARGAINING POWER OF BUYERS
           5.10.4 THREAT OF NEW ENTRANTS
           5.10.5 THREAT OF SUBSTITUTES
    5.11 KEY CONFERENCES AND EVENTS 
                    TABLE 7 CLOUD-BASED DATA MANAGEMENT SERVICES MARKET: KEY CONFERENCES AND EVENTS IN 2023 & 2024
    5.12 TARIFF AND REGULATORY LANDSCAPE 
           5.12.1 REGULATORY BODIES, GOVERNMENT AGENCIES, AND OTHER ORGANIZATIONS
                    TABLE 8 NORTH AMERICA: LIST OF REGULATORY BODIES, GOVERNMENT AGENCIES, AND OTHER ORGANIZATIONS
                    TABLE 9 EUROPE: LIST OF REGULATORY BODIES, GOVERNMENT AGENCIES, AND OTHER ORGANIZATIONS
                    TABLE 10 ASIA PACIFIC: LIST OF REGULATORY BODIES, GOVERNMENT AGENCIES, AND OTHER ORGANIZATIONS
                    TABLE 11 ROW: LIST OF REGULATORY BODIES, GOVERNMENT AGENCIES, AND OTHER ORGANIZATIONS
           5.12.2 REGULATIONS
                    5.12.2.1 North America
                    5.12.2.2 Europe
                    5.12.2.3 Asia Pacific
                    5.12.2.4 Middle East & Africa
                    5.12.2.5 Latin America
    5.13 TRENDS/DISRUPTIONS IMPACTING BUYERS 
                    FIGURE 32 MARKET: TRENDS/DISRUPTIONS IMPACTING BUYERS
    5.14 KEY STAKEHOLDERS & BUYING CRITERIA 
                    FIGURE 33 INFLUENCE OF STAKEHOLDERS ON BUYING PROCESS FOR INDUSTRY VERTICALS
                    TABLE 12 INFLUENCE OF STAKEHOLDERS IN BUYING PROCESS FOR TOP VERTICALS
           5.14.1 BUYING CRITERIA
                    FIGURE 34 KEY BUYING CRITERIA FOR END USERS
                    TABLE 13 KEY BUYING CRITERIA FOR INDUSTRY VERTICALS
 
6 CLOUD-BASED DATA MANAGEMENT SERVICES MARKET, BY SERVICE TYPE (Page No. - 79)
    6.1 INTRODUCTION 
           6.1.1 SERVICE TYPE: MARKET DRIVERS
                    FIGURE 35 QUALITY-AS-A-SERVICE SEGMENT TO RECORD HIGHEST CAGR DURING FORECAST PERIOD
                    TABLE 14 MARKET, BY SERVICE TYPE, 2018–2022 (USD MILLION)
                    TABLE 15 MARKET, BY SERVICE TYPE, 2023–2028 (USD MILLION)
    6.2 INTEGRATION SERVICES 
           6.2.1 GROWTH IN NEED TO STREAMLINE DATA FLOW ACROSS NETWORKS
                    TABLE 16 CLOUD-BASED DATA INTEGRATION SERVICES MARKET, BY REGION, 2018–2022 (USD MILLION)
                    TABLE 17 CLOUD-BASED DATA INTEGRATION SERVICES MARKET, BY REGION, 2023–2028 (USD MILLION)
                    6.2.1.1 Data Migration
                    6.2.1.2 Data Virtualization
                    6.2.1.3 Master Data Management
                    6.2.1.4 Data Synchronization
    6.3 DATA SECURITY & BACKUP SERVICES 
           6.3.1 INCREASE IN VOLUME OF ENTERPRISE DATA DRIVING NEED FOR DATA GOVERNANCE
                    TABLE 18 CLOUD-BASED DATA SECURITY & BACKUP SERVICES MARKET, BY REGION, 2018–2022 (USD MILLION)
                    TABLE 19 CLOUD-BASED DATA SECURITY & BACKUP SERVICES MARKET, BY REGION, 2023–2028 (USD MILLION)
                    6.3.1.1 Data Governance
                    6.3.1.2 Data Archiving
                    6.3.1.3 Data Recovery
    6.4 QUALITY-AS-A-SERVICE 
           6.4.1 HIGH COST OF PROCESSING UNSTRUCTURED DATA FORMATS NECESSITATING DATA QUALITY SOLUTIONS
                    TABLE 20 CLOUD-BASED DATA QUALITY-AS-A-SERVICE MARKET, BY REGION, 2018–2022 (USD MILLION)
                    TABLE 21 CLOUD-BASED DATA QUALITY-AS-A-SERVICE MARKET, BY REGION, 2023–2028 (USD MILLION)
                    6.4.1.1 Data Cleansing
                    6.4.1.2 Data Updating
                    6.4.1.3 Data Deduplication
                    6.4.1.4 Data Standardization
 
7 CLOUD-BASED DATA MANAGEMENT SERVICES MARKET, BY SERVICE MODEL (Page No. - 87)
    7.1 INTRODUCTION 
           7.1.1 SERVICE MODEL: MARKET DRIVERS
                    TABLE 22 MARKET, BY SERVICE MODEL, 2018–2022 (USD MILLION)
                    TABLE 23 MARKET, BY SERVICE MODEL, 2023–2028 (USD MILLION)
    7.2 SOFTWARE-AS-A-SERVICE 
           7.2.1 ENABLING ACCESS TO NECESSARY SERVICES ON DEMAND TO FOCUS ON BUSINESS-CRITICAL APPLICATIONS
                    TABLE 24 SOFTWARE-AS-A-SERVICE MODEL MARKET, BY REGION, 2018–2022 (USD MILLION)
                    TABLE 25 SOFTWARE-AS-A-SERVICE MODEL MARKET, BY REGION, 2023–2028 (USD MILLION)
    7.3 PLATFORM-AS-A-SERVICE 
           7.3.1 NEED FOR MANAGED INFRASTRUCTURE TO BUILD CLOUD APPLICATIONS
                    TABLE 26 PLATFORM-AS-A-SERVICE MODEL MARKET, BY REGION, 2018–2022 (USD MILLION)
                    TABLE 27 PLATFORM-AS-A-SERVICE MODEL MARKET, BY REGION, 2023–2028 (USD MILLION)
    7.4 INFRASTRUCTURE-AS-A-SERVICE 
           7.4.1 ENTERPRISES OPTING FOR LOW-COST INFRASTRUCTURE AND SHORTER TIME TO MARKET
                    TABLE 28 INFRASTRUCTURE-AS-A-SERVICE MODEL MARKET, BY REGION, 2018–2022 (USD MILLION)
                    TABLE 29 INFRASTRUCTURE-AS-A-SERVICE MODEL MARKET, BY REGION, 2023–2028 (USD MILLION)
 
8 CLOUD-BASED DATA MANAGEMENT SERVICES MARKET, BY DEPLOYMENT MODE (Page No. -93 )
    8.1 INTRODUCTION 
           8.1.1 DEPLOYMENT MODE: MARKET DRIVERS
                    TABLE 30 MARKET, BY DEPLOYMENT MODE, 2018–2022 (USD MILLION)
                    TABLE 31 MARKET, BY DEPLOYMENT MODE, 2023–2028 (USD MILLION)
    8.2 PUBLIC CLOUD 
           8.2.1 COST-EFFICIENCY AND SCALABILITY IN DEPLOYING DATA MANAGEMENT SOLUTIONS
                    TABLE 32 PUBLIC MARKET, BY REGION, 2018–2022 (USD MILLION)
                    TABLE 33 PUBLIC MARKET, BY REGION, 2023–2028 (USD MILLION)
    8.3 PRIVATE CLOUD 
           8.3.1 CONCERNS OVER DATA PRIVACY AND SECURITY FUELING SHIFT TOWARD COMMUNITY CLOUD
                    TABLE 34 PRIVATE MARKET, BY REGION, 2018–2022 (USD MILLION)
                    TABLE 35 PRIVATE MARKET, BY REGION, 2023–2028 (USD MILLION)
 
9 CLOUD-BASED DATA MANAGEMENT SERVICES MARKET, BY VERTICAL (Page No. - 98)
    9.1 INTRODUCTION 
           9.1.1 VERTICAL: MARKET DRIVERS
                    TABLE 36 MARKET, BY VERTICAL, 2018–2022 (USD MILLION)
                    TABLE 37 MARKET, BY VERTICAL, 2023–2028 (USD MILLION)
    9.2 BANKING, FINANCIAL SERVICES, AND INSURANCE (BFSI) 
           9.2.1 RISE IN DIGITAL TRANSFORMATION AND NEED FOR RISK AND DATA MANAGEMENT
           9.2.2 RISK MANAGEMENT
           9.2.3 DATA STORAGE & BACKUP
           9.2.4 SECURITY & COMPLIANCE
                    TABLE 38 MARKET IN BFSI, BY REGION, 2018–2022 (USD MILLION)
                    TABLE 39 MARKET IN BFSI, BY REGION, 2023–2028 (USD MILLION)
    9.3 IT & TELECOM 
           9.3.1 TECHNOLOGICAL INNOVATION TO PROVIDE NETWORK MONITORING AND PERSONALIZED SERVICES
           9.3.2 NETWORK MONITORING
           9.3.3 CONTENT DELIVERY & STREAMING
                    TABLE 40 CLOUD-BASED DATA MANAGEMENT SERVICES MARKET IN IT & TELECOM, BY REGION, 2018–2022 (USD MILLION)
                    TABLE 41 MARKET IN IT & TELECOM, BY REGION, 2023–2028 (USD MILLION)
    9.4 RETAIL & CONSUMER GOODS 
           9.4.1 NEED TO OPTIMIZE SUPPLY CHAINS AND TAKE INFORMED BUSINESS DECISIONS
           9.4.2 INVENTORY MANAGEMENT
           9.4.3 POINT-OF-SALES SYSTEM
           9.4.4 CUSTOMER RELATIONSHIP MANAGEMENT
                    TABLE 42 MARKET IN RETAIL & CONSUMER GOODS, BY REGION, 2018–2022 (USD MILLION)
                    TABLE 43 MARKET IN RETAIL & CONSUMER GOODS, BY REGION, 2023–2028 (USD MILLION)
    9.5 GOVERNMENT & PUBLIC SECTOR 
           9.5.1 CITIZEN SERVICES TO BE KEY COMPONENT OF PUBLIC SECTOR DATA MANAGEMENT INFRASTRUCTURE
           9.5.2 CITIZEN SERVICES
           9.5.3 PUBLIC SAFETY
                    TABLE 44 MARKET IN GOVERNMENT & PUBLIC SECTOR, BY REGION, 2018–2022 (USD MILLION)
                    TABLE 45 MARKET IN GOVERNMENT & PUBLIC SECTOR, BY REGION, 2023–2028 (USD MILLION)
    9.6 ENERGY & UTILITIES 
           9.6.1 DEMAND FOR REAL-TIME BIG DATA AND ANALYTICS TO MANAGE DATA SOURCES REMOTELY
           9.6.2 SMART GRID MANAGEMENT
           9.6.3 REMOTE MONITORING & CONTROL
                    TABLE 46 CLOUD-BASED DATA MANAGEMENT SERVICES MARKET IN ENERGY & UTILITIES, BY REGION, 2018–2022 (USD MILLION)
                    TABLE 47 MARKET IN ENERGY & UTILITIES, BY REGION, 2023–2028 (USD MILLION)
    9.7 MANUFACTURING 
           9.7.1 DEMAND FOR INTEGRATED DATABASE MANAGEMENT TO TACKLE INCREASE IN AUTOMATION
           9.7.2 QUALITY MANAGEMENT
           9.7.3 SUPPLY CHAIN MANAGEMENT
                    TABLE 48 MARKET IN MANUFACTURING, BY REGION, 2018–2022 (USD MILLION)
                    TABLE 49 MARKET IN MANUFACTURING, BY REGION, 2023–2028 (USD MILLION)
    9.8 HEALTHCARE & LIFE SCIENCES 
           9.8.1 NEED FOR COLLECTING AND MANAGING GROWING SIZE OF PATIENT DATA
           9.8.2 ELECTRONIC HEALTH RECORDS
           9.8.3 CLINICAL DECISION SUPPORT SYSTEMS
                    TABLE 50 MARKET IN HEALTHCARE & LIFE SCIENCES, BY REGION, 2018–2022 (USD MILLION)
                    TABLE 51 MARKET IN HEALTHCARE & LIFE SCIENCES, BY REGION, 2023–2028 (USD MILLION)
    9.9 EDUCATION 
           9.9.1 ESSENTIALITY OF INTEGRATING DATA FROM DISPARATE SYSTEMS
           9.9.2 LEARNING MANAGEMENT SYSTEMS
           9.9.3 STUDENT INFORMATION SYSTEMS
                    TABLE 52 CLOUD-BASED DATA MANAGEMENT SERVICES MARKET IN EDUCATION, BY REGION, 2018–2022 (USD MILLION)
                    TABLE 53 MARKET IN EDUCATION, BY REGION, 2023–2028 (USD MILLION)
    9.10 MEDIA & ENTERTAINMENT 
           9.10.1 NEED TO REDUCE OPERATING COSTS TO REMAIN COMPETITIVE
           9.10.2 CONTENT PRODUCTION & MANAGEMENT
           9.10.3 CONTENT DELIVERY
                    TABLE 54 MARKET IN MEDIA & ENTERTAINMENT, BY REGION, 2018–2022 (USD MILLION)
                    TABLE 55 MARKET IN MEDIA & ENTERTAINMENT, BY REGION, 2023–2028 (USD MILLION)
    9.11 RESEARCH & CONSULTING SERVICES 
           9.11.1 OFFERING REDUCE COMPLEXITY AND INFRASTRUCTURE SUPPORT
           9.11.2 DATA SCIENCE & MACHINE LEARNING
                    TABLE 56 MARKET IN RESEARCH & CONSULTING SERVICES, BY REGION, 2018–2022 (USD MILLION)
                    TABLE 57 MARKET IN RESEARCH & CONSULTING SERVICES, BY REGION, 2023–2028 (USD MILLION)
    9.12 OTHER VERTICALS 
                    TABLE 58 MARKET IN OTHER VERTICALS, BY REGION, 2018–2022 (USD MILLION)
                    TABLE 59 MARKET IN OTHER VERTICALS, BY REGION, 2023–2028 (USD MILLION)
 
10 CLOUD-BASED DATA MANAGEMENT SERVICES MARKET, BY REGION (Page No. - 116)
     10.1 INTRODUCTION 
               FIGURE 39 NORTH AMERICA TO BE LARGEST IN MARKET
               TABLE 60 MARKET, BY REGION, 2018–2022 (USD MILLION)
               TABLE 61 MARKET, BY REGION, 2023–2028 (USD MILLION)
     10.2 NORTH AMERICA 
             10.2.1 NORTH AMERICA: MARKET DRIVERS
             10.2.2 NORTH AMERICA: RECESSION IMPACT
                       FIGURE 40 NORTH AMERICA: MARKET SNAPSHOT
                       TABLE 62 NORTH AMERICA: CLOUD-BASED DATA MANAGEMENT SERVICES MARKET, BY SERVICE TYPE, 2018–2022 (USD MILLION)
                       TABLE 63 NORTH AMERICA: MARKET, BY SERVICE TYPE, 2023–2028 (USD MILLION)
                       TABLE 64 NORTH AMERICA: MARKET, BY SERVICE MODEL, 2018–2022 (USD MILLION
                       TABLE 65 NORTH AMERICA: MARKET, BY SERVICE MODEL, 2023–2028 (USD MILLION)
                       TABLE 66 NORTH AMERICA: MARKET, BY DEPLOYMENT MODE, 2018–2022 (USD MILLION)
                       TABLE 67 NORTH AMERICA: MARKET, BY DEPLOYMENT MODE, 2023–2028 (USD MILLION)
                       TABLE 68 NORTH AMERICA: MARKET, BY VERTICAL, 2018–2022 (USD MILLION)
                       TABLE 69 NORTH AMERICA: MARKET, BY VERTICAL, 2023–2028 (USD MILLION)
                       TABLE 70 NORTH AMERICA: MARKET, BY COUNTRY, 2018–2022 (USD MILLION)
                       TABLE 71 NORTH AMERICA: MARKET, BY COUNTRY, 2023–2028 (USD MILLION)
             10.2.3 US
                       10.2.3.1 Significant adoption of advanced technologies across industries
                                   TABLE 72 US: MARKET, BY DEPLOYMENT MODE, 2018–2022 (USD MILLION)
                                   TABLE 73 US: MARKET, BY DEPLOYMENT MODE, 2023–2028 (USD MILLION)
             10.2.4 CANADA
                       10.2.4.1 Technological advancements and increase in SMEs
                                   TABLE 74 CANADA: MARKET, BY DEPLOYMENT MODE, 2018–2022 (USD MILLION)
                                   TABLE 75 CANADA: MARKET, BY DEPLOYMENT MODE, 2023–2028 (USD MILLION)
     10.3 EUROPE 
             10.3.1 EUROPE: MARKET DRIVERS
             10.3.2 EUROPE: RECESSION IMPACT
                       TABLE 76 EUROPE: CLOUD-BASED DATA MANAGEMENT SERVICES MARKET, BY SERVICE TYPE, 2018–2022 (USD MILLION)
                       TABLE 77 EUROPE: MARKET, BY SERVICE TYPE, 2023–2028 (USD MILLION)
                       TABLE 78 EUROPE: MARKET, BY SERVICE MODEL, 2018–2022 (USD MILLION)
                       TABLE 79 EUROPE: MARKET, BY SERVICE MODEL, 2023–2028 (USD MILLION)
                       TABLE 80 EUROPE: MARKET, BY DEPLOYMENT MODE, 2018–2022 (USD MILLION)
                       TABLE 81 EUROPE: MARKET, BY ORGANIZATION SIZE, 2023–2028 (USD MILLION)
                       TABLE 82 EUROPE: MARKET, BY VERTICAL, 2018–2022 (USD MILLION)
                       TABLE 83 EUROPE: MARKET, BY VERTICAL, 2023–2028 (USD MILLION)
                       TABLE 84 EUROPE: MARKET, BY COUNTRY, 2018–2022 (USD MILLION)
                       TABLE 85 EUROPE: MARKET, BY COUNTRY, 2023–2028 (USD MILLION)
             10.3.3 UK
                       10.3.3.1 Growth in adoption of cloud and other technologies
                                   TABLE 86 UK: CLOUD-BASED DATA MANAGEMENT SERVICES MARKET, BY DEPLOYMENT MODE, 2018–2022 (USD MILLION)
                                   TABLE 87 UK: MARKET, BY DEPLOYMENT MODE, 2023–2028 (USD MILLION)
             10.3.4 GERMANY
                       10.3.4.1 Digital transformation and industry 4.0
                                   TABLE 88 GERMANY: MARKET, BY DEPLOYMENT MODE, 2018–2022 (USD MILLION)
                                   TABLE 89 GERMANY: MARKET, BY DEPLOYMENT MODE, 2023–2028 (USD MILLION)
             10.3.5 ITALY
                       10.3.5.1 Growth in adoption among manufacturing industries
                                   TABLE 90 ITALY: MARKET, BY DEPLOYMENT MODE, 2018–2022 (USD MILLION)
                                   TABLE 91 ITALY: MARKET, BY DEPLOYMENT MODE, 2023–2028 (USD MILLION)
             10.3.6 REST OF EUROPE
                       TABLE 92 REST OF EUROPE: MARKET, BY DEPLOYMENT MODE, 2018–2022 (USD MILLION)
                       TABLE 93 REST OF EUROPE: MARKET, BY DEPLOYMENT MODE, 2023–2028 (USD MILLION)
     10.4 ASIA PACIFIC 
             10.4.1 ASIA PACIFIC: MARKET DRIVERS
             10.4.2 ASIA PACIFIC: RECESSION IMPACT
                       FIGURE 41 ASIA PACIFIC: CLOUD-BASED DATA MANAGEMENT SERVICES MARKET SNAPSHOT
                       TABLE 94 ASIA PACIFIC: MARKET, BY SERVICE TYPE, 2018–2022 (USD MILLION)
                       TABLE 95 ASIA PACIFIC: MARKET, BY SERVICE TYPE, 2023–2028 (USD MILLION)
                       TABLE 96 ASIA PACIFIC: MARKET, BY SERVICE MODEL, 2018–2022 (USD MILLION)
                       TABLE 97 ASIA PACIFIC: MARKET, BY SERVICE MODEL, 2023–2028 (USD MILLION)
                       TABLE 98 ASIA PACIFIC: MARKET, BY DEPLOYMENT MODE, 2018–2022 (USD MILLION)
                       TABLE 99 ASIA PACIFIC: MARKET, DEPLOYMENT MODE, 2023–2028 (USD MILLION)
                       TABLE 100 ASIA PACIFIC: MARKET, BY VERTICAL, 2018–2022 (USD MILLION)
                       TABLE 101 ASIA PACIFIC: MARKET, BY VERTICAL, 2023–2028 (USD MILLION)
                       TABLE 102 ASIA PACIFIC: MARKET, BY COUNTRY, 2018–2022 (USD MILLION)
                       TABLE 103 ASIA PACIFIC: MARKET, BY COUNTRY, 2023–2028 (USD MILLION)
             10.4.3 CHINA
                       10.4.3.1 Rapid expansion of digital services to drive demand for data protection and processing solutions
                                   TABLE 104 CHINA: CLOUD-BASED DATA MANAGEMENT SERVICES MARKET, BY DEPLOYMENT MODE, 2018–2022 (USD MILLION)
                                   TABLE 105 CHINA: MARKET, BY DEPLOYMENT MODE, 2023–2028 (USD MILLION)
             10.4.4 JAPAN
                       10.4.4.1 Increase in transition to cloud data management in major industries
                                   TABLE 106 JAPAN: MARKET, BY DEPLOYMENT MODE, 2018–2022 (USD MILLION)
                                   TABLE 107 JAPAN: MARKET, BY DEPLOYMENT MODE, 2023–2028 (USD MILLION)
             10.4.5 INDIA
                       10.4.5.1 Growing digitalization supported by government initiatives
                                   TABLE 108 INDIA: MARKET, BY DEPLOYMENT MODE, 2018–2022 (USD MILLION)
                                   TABLE 109 INDIA: MARKET, BY DEPLOYMENT MODE, 2023–2028 (USD MILLION)
             10.4.6 REST OF ASIA PACIFIC
                       TABLE 110 REST OF ASIA PACIFIC: MARKET, BY DEPLOYMENT MODE, 2018–2022 (USD MILLION)
                       TABLE 111 REST OF ASIA PACIFIC: MARKET, BY DEPLOYMENT MODE, 2023–2028 (USD MILLION)
     10.5 MIDDLE EAST & AFRICA 
             10.5.1 MIDDLE EAST & AFRICA: MARKET DRIVERS
             10.5.2 MIDDLE EAST & AFRICA: RECESSION IMPACT
                       TABLE 112 MIDDLE EAST & AFRICA: CLOUD-BASED DATA MANAGEMENT SERVICES MARKET, BY SERVICE TYPE, 2018–2022 (USD MILLION)
                       TABLE 113 MIDDLE EAST & AFRICA: MARKET, BY SERVICE TYPE, 2023–2028 (USD MILLION)
                       TABLE 114 MIDDLE EAST & AFRICA: MARKET, BY SERVICE MODEL, 2018–2022 (USD MILLION)
                       TABLE 115 MIDDLE EAST & AFRICA: MARKET, BY SERVICE MODEL, 2023–2028 (USD MILLION)
                       TABLE 116 MIDDLE EAST & AFRICA: MARKET, BY DEPLOYMENT MODE, 2018–2022 (USD MILLION)
                       TABLE 117 MIDDLE EAST & AFRICA: MARKET, BY DEPLOYMENT MODE, 2023–2028 (USD MILLION)
                       TABLE 118 MIDDLE EAST & AFRICA: MARKET, BY VERTICAL, 2018–2022 (USD MILLION)
                       TABLE 119 MIDDLE EAST & AFRICA: MARKET, BY VERTICAL, 2023–2028 (USD MILLION)
                       TABLE 120 MIDDLE EAST & AFRICA: MARKET, BY REGION, 2018–2022 (USD MILLION)
                       TABLE 121 MIDDLE EAST & AFRICA: MARKET, BY REGION, 2023–2028 (USD MILLION)
             10.5.3 GULF COOPERATION COUNCIL (GCC)
                       10.5.3.1 Adoption driven by prominent players in region, with countries’ strategies aiming at digitalization
                                   TABLE 122 GCC: MARKET, BY DEPLOYMENT MODE, 2018–2022 (USD MILLION)
                                   TABLE 123 GCC: MARKET, BY DEPLOYMENT MODE, 2023–2028 (USD MILLION)
                       10.5.3.2 KSA
                       10.5.3.3 UAE
                       10.5.3.4 Rest of GCC
             10.5.4 REST OF MIDDLE EAST & AFRICA
                       TABLE 124 REST OF MIDDLE EAST & AFRICA: MARKET, BY DEPLOYMENT MODE, 2018–2022 (USD MILLION)
                       TABLE 125 REST OF MIDDLE EAST & AFRICA: MARKET, BY DEPLOYMENT MODE, 2023–2028 (USD MILLION)
     10.6 LATIN AMERICA 
             10.6.1 LATIN AMERICA: MARKET DRIVERS
             10.6.2 LATIN AMERICA: RECESSION IMPACT
                       TABLE 126 LATIN AMERICA: CLOUD-BASED DATA MANAGEMENT SERVICES MARKET, BY SERVICE TYPE, 2018–2022 (USD MILLION)
                       TABLE 127 LATIN AMERICA: MARKET, BY SERVICE TYPE, 2023–2028 (USD MILLION)
                       TABLE 128 LATIN AMERICA: MARKET, BY SERVICE MODEL, 2018–2022 (USD MILLION)
                       TABLE 129 LATIN AMERICA: MARKET, BY SERVICE MODEL, 2023–2028 (USD MILLION)
                       TABLE 130 LATIN AMERICA: MARKET, BY DEPLOYMENT MODE, 2018–2022 (USD MILLION)
                       TABLE 131 LATIN AMERICA: MARKET, BY DEPLOYMENT MODE, 2023–2028 (USD MILLION)
                       TABLE 132 LATIN AMERICA: MARKET, BY VERTICAL, 2018–2022 (USD MILLION)
                       TABLE 133 LATIN AMERICA: MARKET, BY VERTICAL, 2023–2028 (USD MILLION)
                       TABLE 134 LATIN AMERICA: MARKET, BY COUNTRY, 2018–2022 (USD MILLION)
                       TABLE 135 LATIN AMERICA: MARKET, BY COUNTRY, 2023–2028 (USD MILLION)
             10.6.3 BRAZIL
                       10.6.3.1 Cost-efficiency of services and large enterprises such as Oracle expanding cloud regions
                                   TABLE 136 BRAZIL: MARKET, BY DEPLOYMENT MODE, 2018–2022 (USD MILLION)
                                   TABLE 137 BRAZIL: MARKET, BY DEPLOYMENT MODE, 2023–2028 (USD MILLION)
             10.6.4 MEXICO
                       10.6.4.1 High adoption among SMEs, especially post-COVID-19
                                   TABLE 138 MEXICO: MARKET, BY DEPLOYMENT MODE, 2018–2022 (USD MILLION)
                                   TABLE 139 MEXICO: MARKET, BY DEPLOYMENT MODE, 2023–2028 (USD MILLION)
             10.6.5 REST OF LATIN AMERICA
                       TABLE 140 REST OF LATIN AMERICA: MARKET, BY DEPLOYMENT MODE, 2018–2022 (USD MILLION)
                       TABLE 141 REST OF LATIN AMERICA: MARKET, BY DEPLOYMENT MODE, 2023–2028 (USD MILLION)
 
11 COMPETITIVE LANDSCAPE (Page No. - 153)
     11.1 INTRODUCTION 
     11.2 KEY PLAYERS’ STRATEGIES/RIGHT TO WIN 
               TABLE 142 OVERVIEW OF STRATEGIES ADOPTED BY KEY CLOUD-BASED DATA MANAGEMENT SERVICES VENDORS
     11.3 MARKET SHARE ANALYSIS 
               TABLE 143 MARKET: DEGREE OF COMPETITION
               FIGURE 42 CLOUD-BASED DATA MANAGEMENT SERVICES MARKET: MARKET SHARE ANALYSIS
     11.4 VENDOR PRODUCTS/BRANDS COMPARISON 
               TABLE 144 VENDOR PRODUCTS/BRANDS COMPARISON
     11.5 REVENUE ANALYSIS OF TOP VENDORS 
               FIGURE 43 REVENUE ANALYSIS FOR KEY PLAYERS OVER FIVE YEARS (USD BILLION)
     11.6 KEY COMPANY EVALUATION MATRIX 
               FIGURE 44 KEY COMPANY EVALUATION MATRIX: CRITERIA WEIGHTAGE
             11.6.1 STARS
             11.6.2 EMERGING LEADERS
             11.6.3 PERVASIVE PLAYERS
             11.6.4 PARTICIPANTS
                       FIGURE 45 KEY COMPANY EVALUATION MATRIX, 2022
             11.6.5 KEY COMPANY FOOTPRINT
                       TABLE 145 KEY COMPANY REGIONAL FOOTPRINT
                       TABLE 146 KEY COMPANY VERTICAL FOOTPRINT
                       TABLE 147 KEY COMPANY SERVICE TYPE FOOTPRINT
                       TABLE 148 KEY OVERALL COMPANY FOOTPRINT
     11.7 STARTUP/SME EVALUATION MATRIX 
               FIGURE 46 STARTUP/SME EVALUATION MATRIX: CRITERIA WEIGHTAGE
             11.7.1 RESPONSIVE COMPANIES
             11.7.2 PROGRESSIVE COMPANIES
             11.7.3 DYNAMIC COMPANIES
             11.7.4 STARTING BLOCKS
                       FIGURE 47 STARTUP/SME EVALUATION MATRIX, 2022
             11.7.5 STARTUP/SME FOOTPRINT
                       TABLE 149 STARTUP/SME REGIONAL FOOTPRINT
                       TABLE 150 STARTUP/SME VERTICAL FOOTPRINT
                       TABLE 151 STARTUP/SME SERVICE TYPE FOOTPRINT
                       TABLE 152 OVERALL STARTUP/SME FOOTPRINT
             11.7.6 COMPETITIVE BENCHMARKING OF STARTUPS/SMES
                       TABLE 153 KEY STARTUPS/SMES
     11.8 COMPANY FINANCIAL METRICS 
               FIGURE 48 COMPANY FINANCIAL METRICS, 2023
     11.9 GLOBAL SNAPSHOT OF KEY MARKET PARTICIPANTS 
               FIGURE 49 GLOBAL SNAPSHOT OF KEY MARKET PARTICIPANTS, 2022
     11.10 COMPETITIVE SCENARIO AND TRENDS 
               TABLE 154 CLOUD-BASED DATA MANAGEMENT SERVICES MARKET: PRODUCT LAUNCHES & ENHANCEMENTS, MARCH 2021–SEPTEMBER 2023
               TABLE 155 MARKET: DEALS, MAY 2021– SEPTEMBER 2023
 
12 COMPANY PROFILES (Page No. - 174)
     12.1 INTRODUCTION 
     12.2 KEY PLAYERS 
(Business Overview, Products/Solutions/Services offered, Recent Developments, MnM View)*
             12.2.1 IBM
                       TABLE 156 IBM: COMPANY OVERVIEW
                       FIGURE 50 IBM: COMPANY SNAPSHOT
                       TABLE 157 IBM: PRODUCTS/SOLUTIONS/SERVICES OFFERED
                       TABLE 158 IBM: PRODUCT LAUNCHES & ENHANCEMENTS
                       TABLE 159 IBM: DEALS
             12.2.2 FUJITSU
                       TABLE 160 FUJITSU: COMPANY OVERVIEW
                       FIGURE 51 FUJITSU: COMPANY SNAPSHOT
                       TABLE 161 FUJITSU: PRODUCTS/SOLUTIONS/SERVICES OFFERED
                       TABLE 162 FUJITSU: DEALS
             12.2.3 CISCO
                       TABLE 163 CISCO: COMPANY OVERVIEW
                       FIGURE 52 CISCO: COMPANY SNAPSHOT
                       TABLE 164 CISCO: PRODUCTS/SOLUTIONS/SERVICES OFFERED
                       TABLE 165 CISCO: DEALS
             12.2.4 DELL TECHNOLOGIES
                       TABLE 166 DELL TECHNOLOGIES: COMPANY OVERVIEW
                       FIGURE 53 DELL TECHNOLOGIES: COMPANY SNAPSHOT
                       TABLE 167 DELL TECHNOLOGIES: PRODUCTS/SOLUTIONS/SERVICES OFFERED
                       TABLE 168 DELL TECHNOLOGIES: PRODUCT LAUNCHES & ENHANCEMENTS
                       TABLE 169 DELL TECHNOLOGIES: DEALS
             12.2.5 HPE
                       TABLE 170 HPE: COMPANY OVERVIEW
                       FIGURE 54 HPE: COMPANY SNAPSHOT
                       TABLE 171 HPE: PRODUCTS/SOLUTIONS/SERVICES OFFERED
                       TABLE 172 HPE: PRODUCT LAUNCHES & ENHANCEMENTS
                       TABLE 173 HPE: DEALS
             12.2.6 NETAPP
                       TABLE 174 NETAPP: COMPANY OVERVIEW
                       FIGURE 55 NETAPP: COMPANY SNAPSHOT
                       TABLE 175 NETAPP: PRODUCTS/SOLUTIONS/SERVICES OFFERED
                       TABLE 176 NETAPP: PRODUCT LAUNCHES & ENHANCEMENTS
                       TABLE 177 NETAPP: DEALS
             12.2.7 INFORMATICA
                       TABLE 178 INFORMATICA: COMPANY OVERVIEW
                       FIGURE 56 INFORMATICA: COMPANY SNAPSHOT
                       TABLE 179 INFORMATICA: PRODUCTS/SOLUTIONS/SERVICES OFFERED
                       TABLE 180 INFORMATICA: PRODUCT LAUNCHES & ENHANCEMENTS
                       TABLE 181 INFORMATICA: DEALS
             12.2.8 SAS
                       TABLE 182 SAS: COMPANY OVERVIEW
                       TABLE 183 SAS: PRODUCTS/SOLUTIONS/SERVICES OFFERED
                       TABLE 184 SAS: PRODUCT LAUNCHES & ENHANCEMENTS
                       TABLE 185 SAS: DEALS
             12.2.9 ACTIAN
                       TABLE 186 ACTIAN: COMPANY OVERVIEW
                       TABLE 187 ACTIAN: PRODUCTS/SOLUTIONS/SERVICES OFFERED
                       TABLE 188 ACTIAN: PRODUCT LAUNCHES & ENHANCEMENTS
             12.2.10 ORACLE
                       TABLE 189 ORACLE: COMPANY OVERVIEW
                       FIGURE 57 ORACLE: COMPANY SNAPSHOT
                       TABLE 190 ORACLE: PRODUCTS/SOLUTIONS/SERVICES OFFERED
                       TABLE 191 ORACLE: PRODUCT LAUNCHES & ENHANCEMENTS
                       TABLE 192 ORACLE: DEALS
             12.2.11 SAP
             12.2.12 GOOGLE
             12.2.13 AWS
             12.2.14 ACCENTURE
             12.2.15 SNOWFLAKE
             12.2.16 TALEND
             12.2.17 HITACHI VANTARA
             12.2.18 CLOUDERA
             12.2.19 TERADATA
             12.2.20 EXPERIAN
             12.2.21 ALIBABA CLOUD
             12.2.22 TIBCO SOFTWARE
             12.2.23 COHESITY
             12.2.24 COMMVAULT
*Details on Business Overview, Products/Solutions/Services offered, Recent Developments, MnM View might not be captured in case of unlisted companies.
     12.3 STARTUPS/SMES 
             12.3.1 MATILLION
             12.3.2 STARFISHETL
             12.3.3 KOMPRISE
             12.3.4 POLESTAR SOLUTIONS
             12.3.5 HEVO DATA
             12.3.6 ALATION
             12.3.7 QUBOLE
             12.3.8 PANOPLY
             12.3.9 RUBRIK
             12.3.10 NAKIVO
 
13 ADJACENT MARKET (Page No. - 239)
     13.1 INTRODUCTION 
             13.1.1 RELATED MARKETS
     13.2 ENTERPRISE DATA MANAGEMENT MARKET 
               TABLE 193 ENTERPRISE DATA MANAGEMENT MARKET, BY COMPONENT, 2018–2025 (USD MILLION)
               TABLE 194 SOFTWARE: ENTERPRISE DATA MANAGEMENT MARKET, BY TYPE, 2018–2025 (USD MILLION)
               TABLE 195 SERVICES: ENTERPRISE DATA MANAGEMENT MARKET, BY TYPE, 2018–2025 (USD MILLION)
               TABLE 196 PROFESSIONAL SERVICES: ENTERPRISE DATA MANAGEMENT MARKET, BY TYPE, 2018–2025 (USD MILLION)
               TABLE 197 ENTERPRISE DATA MANAGEMENT MARKET, BY DEPLOYMENT MODE, 2018–2025 (USD MILLION)
               TABLE 198 ENTERPRISE DATA MANAGEMENT MARKET, BY ORGANIZATION SIZE, 2018–2025 (USD MILLION)
               TABLE 199 ENTERPRISE DATA MANAGEMENT MARKET, BY INDUSTRY VERTICAL, 2018–2025 (USD MILLION)
               TABLE 200 ENTERPRISE DATA MANAGEMENT MARKET, BY REGION, 2018–2025 (USD MILLION)
     13.3 MASTER DATA MANAGEMENT MARKET 
               TABLE 201 MASTER DATA MANAGEMENT MARKET, BY COMPONENT, 2016–2021 (USD MILLION)
               TABLE 202 MASTER DATA MANAGEMENT MARKET, BY COMPONENT, 2022–2027 (USD MILLION)
               TABLE 203 MASTER DATA MANAGEMENT MARKET, BY DEPLOYMENT MODE, 2016–2021 (USD MILLION)
               TABLE 204 MASTER DATA MANAGEMENT MARKET, BY DEPLOYMENT MODE, 2022–2027 (USD MILLION)
               TABLE 205 MASTER DATA MANAGEMENT MARKET, BY ORGANIZATION SIZE, 2016–2021 (USD MILLION)
               TABLE 206 MASTER DATA MANAGEMENT MARKET, BY ORGANIZATION SIZE, 2022–2027 (USD MILLION)
               TABLE 207 MASTER DATA MANAGEMENT MARKET, BY VERTICAL, 2016–2021 (USD MILLION)
               TABLE 208 MASTER DATA MANAGEMENT MARKET, BY VERTICAL, 2022–2027 (USD MILLION)
               TABLE 209 MASTER DATA MANAGEMENT MARKET, BY REGION, 2016–2021 (USD MILLION)
               TABLE 210 MASTER DATA MANAGEMENT MARKET, BY REGION, 2022–2027 (USD MILLION)
     13.4 CLOUD INFRASTRUCTURE SERVICES MARKET 
               TABLE 211 IAAS MARKET, BY SERVICE TYPE, 2017–2024 (USD BILLION)
               TABLE 212 IAAS MARKET, BY DEPLOYMENT MODEL, 2017–2024 (USD BILLION)
               TABLE 213 IAAS MARKET, BY ORGANIZATION SIZE, 2017–2024 (USD BILLION)
               TABLE 214 IAAS MARKET, BY VERTICAL, 2017–2024 (USD BILLION)
               TABLE 215 IAAS MARKET, BY REGION, 2017–2024 (USD BILLION)
 
14 APPENDIX (Page No. - 248)
     14.1 DISCUSSION GUIDE 
     14.2 KNOWLEDGESTORE: MARKETSANDMARKETS’ SUBSCRIPTION PORTAL 
     14.3 CUSTOMIZATION OPTIONS 
     14.4 RELATED REPORTS 
     14.5 AUTHOR DETAILS 

The study involved four major activities in estimating the current cloud-based data management services market size. Extensive secondary research was done to collect information on the market, the competitive market, and the parent market. The next step was to validate these findings, assumptions, and sizing with industry experts across the value chain through primary research. Both top-down and bottom-up approaches were employed to estimate the complete market size. After that, the market breakup and data triangulation procedures were used to estimate the market size of the various segments in the cloud-based data management services market.

Secondary Research

This research study used extensive secondary sources, directories, and databases, such as D&B Hoovers, DiscoverOrg, Factiva, vendor data sheets, product demos, Cloud Computing Association (CCA), Vendor Surveys, Asia Cloud Computing Association, and The Software Alliance. All these sources were referred to for identifying and collecting valuable information for this technical, market-oriented, and commercial study of the cloud-based data management services market.

Primary Research

Primary sources were several industry experts from the core and related industries, preferred software providers, hardware manufacturers, distributors, service providers, technology developers, alliances, and organizations related to all segments of the industry’s value chain. In-depth interviews were conducted with various primary respondents, including key industry participants, subject-matter experts, C-level executives of key market players, and industry consultants, to obtain and verify critical qualitative and quantitative information and assess the market’s prospects.

Primary interviews were conducted to gather insights, such as market statistics, the latest trends disrupting the market, new use cases implemented, data on revenue collected from products and services, market breakups, market size estimations, market forecasts, and data triangulation. Primary research also helped understand various technology trends, segmentation types, industry trends, and regions. Demand-side stakeholders, such as Chief Information Officers (CIOs), Chief Technology Officers (CTOs), and Chief Security Officers (CSOs); the installation teams of governments/end users using cloud-based data management services; and digital initiatives project teams, were interviewed to understand the buyer’s perspective on suppliers, products, service providers, and their current use of services, which would affect the overall cloud-based data management services market.
Cloud-based Data Management Services  Market Size, and Share

To know about the assumptions considered for the study, download the pdf brochure

Market Size Estimation

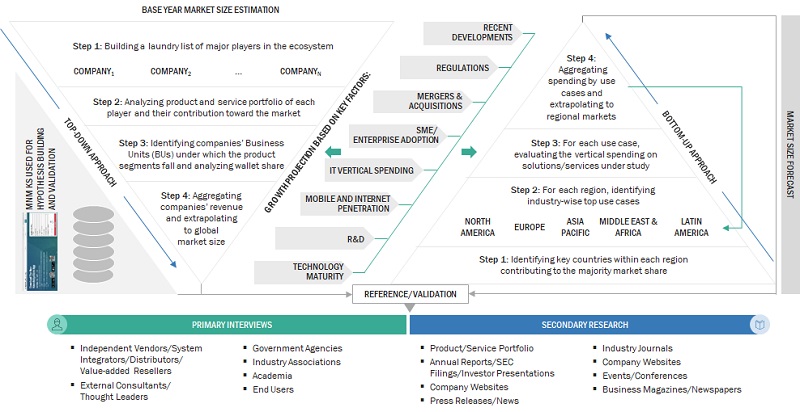
Both top-down and bottom-up approaches were used to estimate and forecast the cloud-based data management services market and other dependent submarkets. The bottom-up procedure was deployed to arrive at the overall market size using the revenues and offerings of key companies in the market. With data triangulation methods and validation through primary interviews, this study determined and confirmed the exact value of the overall parent market size. The overall market size was then used in the top-down procedure to estimate the size of other individual markets via percentage splits of the market segments.

The top-down and bottom-up approaches were used to estimate and validate the size of the cloud-based data management services market and various other dependent subsegments.

The research methodology used to estimate the market size included the following details:

  • The key players in the market were identified through secondary research, and their revenue contributions in the respective countries were determined through primary and secondary research.
  • This entire procedure included studying top market players' annual and financial reports and extensive interviews for key insights from industry leaders, such as Chief Executive Officers (CEOs), VPs, directors, and marketing executives.
  • All percentage splits and breakups were determined using secondary sources and verified through primary sources.

All the possible parameters that affect the market covered in this research study have been accounted for, viewed in extensive detail, verified through primary research, and analyzed to get the final quantitative and qualitative data. This data is consolidated and added with detailed inputs and analysis from MarketsandMarkets.

Cloud-based data management services market: Top-down and bottom-up approaches
Cloud-based Data Management Services Market Size, and Share

Data Triangulation

The market was split into several segments and subsegments after arriving at the overall market size—using the market size estimation processes as explained above. To complete the overall market engineering process and arrive at the exact statistics of each market segment and subsegment, data triangulation and market breakup procedures were employed, wherever applicable. The data was triangulated by studying several factors and trends from both the demand and supply sides in the cloud-based data management services market.

Market Definition

Cloud-based data management services are offered by IT vendors specifically for cloud deployment. These services are integration, security & backup, and quality services. The integration services include data conversion, migration, integration, master data management (MDM), data synchronization, data virtualization, data exchange, and implementation of service-oriented architectures (SOAs). Data security & backup services include data protection, archiving, recovery, and governance. Quality-as-a-service includes data cleansing, scrubbing, updating, standardization, remediation, and de-duplication.

Key Stakeholders

  • Cloud service providers (CSPs)
  • Colocation providers
  • Technology service providers
  • Application design and development service providers
  • Data integration service providers
  • Data center-managed service providers
  • Data quality service providers
  • Government organizations
  • Networking companies
  • Consultants/consultancies/advisory firms
  • Support and maintenance service providers
  • Telecom service providers
  • Information technology (IT) infrastructure providers
  • System integrators (Sis)/migration service providers
  • Regional associations
  • Independent software vendors
  • Value-added resellers and distributors
  • Enterprises
  • Government and Standardization Bodies
  • Telecom Operators
  • Healthcare Organizations
  • Financial Organizations
  • Datacenter Vendors
  • Technology partners
  • Technology providers

Report Objectives

  • To define, describe, and forecast the cloud-based Data Management Services  market based on service type, service model, deployment mode,  industry verticals, and regions
  • To forecast the market size of the five major regional segments: North America, Europe, Asia Pacific, Middle East & Africa, and Latin America
  • To strategically analyze the market subsegments with respect to individual growth trends, prospects, and contributions to the total market
  • To provide detailed information related to the major factors influencing the growth of the market (drivers, restraints, opportunities, and challenges)
  • To strategically analyze the macro and micromarkets1 with respect to growth trends, prospects, and their contributions to the overall market
  • To analyze the industry trends, patents and innovations, and pricing data related to the cloud-based data management services market.
  • To analyze the opportunities in the market for stakeholders and provide details of the competitive landscape for major players.
  • To profile the key players in the market and comprehensively analyze their market share/ranking and core competencies across segments and subsegments.
  • To track and analyze the competitive developments, such as mergers and acquisitions, product developments, and partnerships and collaborations in the market.

Available Customizations

With the given market data, MarketsandMarkets offers customizations as per the company’s specific needs. The following customization options are available for the report:

Product Analysis

  • The product matrix provides a detailed comparison of the product portfolio of each company.

Geographic Analysis

  • Further breakup of the Asia Pacific market into countries contributing 75% to the regional market size
  • Further breakup of the North American market into countries contributing 75% to the regional market size
  • Further breakup of the Latin American market into countries contributing 75% to the regional market size
  • Further breakup of the Middle Eastern & African market into countries contributing 75% to the regional market size
  • Further breakup of the European market into countries contributing 75% to the regional market size

Company Information

  • Detailed analysis and profiling of additional market players (up to 5)
Custom Market Research Services

We will customize the research for you, in case the report listed above does not meet with your exact requirements. Our custom research will comprehensively cover the business information you require to help you arrive at strategic and profitable business decisions.

Request Customization

Instant Answers with GPT - Ask Now!

Ask real questions. Get complete answers !
Report Code
TC 3003
Published ON
Dec, 2023
Choose License Type
BUY NOW
  • SHARE
X
Request Customization
Speak to Analyst
Speak to Analyst
OR FACE-TO-FACE MEETING
PERSONALIZE THIS RESEARCH
  • Triangulate with your Own Data
  • Get Data as per your Format and Definition
  • Gain a Deeper Dive on a Specific Application, Geography, Customer or Competitor
  • Any level of Personalization
REQUEST A FREE CUSTOMIZATION
LET US HELP YOU!
  • What are the Known and Unknown Adjacencies Impacting the Cloud-based Data Management Services Market
  • What will your New Revenue Sources be?
  • Who will be your Top Customer; what will make them switch?
  • Defend your Market Share or Win Competitors
  • Get a Scorecard for Target Partners
CUSTOMIZED WORKSHOP REQUEST
  • Call Us
  • +1-888-600-6441 (Corporate office hours)
  • +1-888-600-6441 (US/Can toll free)
  • +44-800-368-9399 (UK office hours)
CONNECT WITH US
ABOUT TRUST ONLINE
©2024 MarketsandMarkets Research Private Ltd. All rights reserved
DMCA.com Protection Status
Website Feedback