Co-Packaged Optics Market

Co-Packaged Optics Market Size, Share, Statistics and Industry Growth Analysis Report by Type (CPO, NPO), Data Rates (less than 1.6 T & 1.6 T, 3.2 T, 6.4 T), Application (Data Center and High-performance Computing, and Telecommunication and Networking), Packaging Technology and Region - Global Growth Driver and Industry Forecast to 2028

Report Code: SE 8826 Oct, 2023, by marketsandmarkets.com

Updated on : April 04, 2024

The co-packaged optics market size is projected to grow from USD 15 million in 2023 to USD 49 million by 2028, registering a CAGR of 26.5% during the forecast period.

Penetration of IoT and connected devices in education and healthcare sectors, growing investment by tech giants to develop data centers,  and introduction of ultra-high-definition video streaming are expected to propel the co-packaged optics market in the next five years. However, increased network complexity is likely to pose challenges for industry players.

The objective of the report is to define, describe, and forecast the co-packaged optics market based on type, data rates, application, and region.

Co-Packaged Optics Market

Co-Packaged Optics Market

Co-Packaged Optics Market Forecast to 2028

To know about the assumptions considered for the study, Request for Free Sample Report

Co-packaged optics market Dynamics

Driver: Growing investment by tech giants to develop data centers

The co-packaged optics market is being driven by the growth of mega data centers, which require high-speed, reliable connections between the different components of the data center. CPO provides a more efficient and cost-effective way to connect the components of mega data centers, making it an ideal solution for meeting this demand. As the number of mega data centers continues to increase, the demand for CPO is also expected to grow, driving the growth of the CPO market in the coming years.

Tech giants such as Amazon Web Services (US), Google (US), and Microsoft (US) are investing heavily in new data center facilities. In October 2022, Google (US) announced plans to open its first data center in Japan in 2023 as part of a USD 730 million investment that includes the Topaz Subsea Cable, a fiber cable connecting Japan and Canada. Active investments in the development of new data center facilities are expected to drive the growth of the co-packaged optics (CPO) market over the forecast period. Thus, the increasing infrastructure and technology development in the data center industry is driving the co-packaged optics market.

Restraint: Complicated design and fabrication process

Co-packaged optics are optical components that are integrated with electronic components such as processors and memory. They come with the challenge of having different requirements in terms of temperature, power, and packaging for electronic and optical components. Fabrication of co-packaged optics is a complex and expensive process, as it requires precise alignment and interconnection of optical and electronic components. It also demands the use of specialized equipment and materials. Due to its complicated design and fabrication process, co-packaged optics are more expensive than traditional optical transceivers, leading to limited adoption in some applications.

Opportunities: Rising deployment of 5G network

Co-packaged optics is a promising new technology that can improve the performance of 5G networks. It can enhance the performance of fronthaul links that connect the baseband unit (BBU) to the radio unit (RU) in 5G networks. CPO can also help to improve the performance of backhaul links that connect the RUs to the core network in 5G networks. These links are short, but they require high bandwidth to support the high data rates of 5G.

Overall, co-packaged optics is a promising new technology that has the potential to improve the efficiency and cost-effectiveness of 5G networks. By reducing power consumption and increasing bandwidth density, CPO can help make 5G networks more efficient.

Challenges: Increasing fiber counts per switc

Co-packaged optics switches combine optical and electronic components on a single chip, providing higher bandwidth and lower latency than traditional optical transceivers. However, such switches increase the fiber count per unit as they have more optical ports. This makes it challenging to route all fibers compactly and efficiently. To meet the demand for higher capacity switches, CPO switch ASICs can use parallel optical engines, allowing for up to 1024 fibers (four times as many as in existing solutions). However, this requires more front panel area than a 1RU switch can accommodate if MPO-16 is used at the front plate. Additionally, an external laser source (ELS) may be required, making the face plate space requirements even more complicated.

Market Map/Ecosystem

Co-Packaged Optics Market by Ecosystem

Co-packaged optics Market: Key Trends

The prominent players in the co-packaged optics market are Broadcom (US), Molex (US), Marvell (US), RANOVUS (Canada), Ragile Networks Inc. (US), SENKO (US), Quanta Computer Inc. (Taiwan), Furukawa Electric Co., Ltd. (Japan), among others. These companies boast mixing trends with a comprehensive product portfolio and strong geographic footprint.

CP0 is expected to grow at the highest CARG in the co-packaged optics market during the forecast period.

The CPO is expected to account for a significant share and grow at the highest CAGR during the forecast period. The demand for CPOs is expected to drive market growth as organizations look for ways to improve their network performance. Additionally, the increasing deployment of mega data centers is a key driver in the co-packaged optics market, as these data centers require reliable high-speed connections to transmit data between different types of equipment. The widespread use of cloud services has raised the demand for data centers, which has further fueled the industry under study.

Less than 1.6 T & 1.6 Tis expected to grow at the highest CARG in the co-packaged optics market in 2023.

The less than 1.6 T & 1.6 T segment is expected to account for a significant share during the forecast period. The demand for less than 1.6 T data rates co-packaged optics (CPO) is expected to remain strong in the coming years. This is due to the fact that many applications, such as data centers, telecommunications, and industrial automation, will have high demand. The increasing activities by market players such as MACOM and Intel Corporation are driving the growth of this 1.6 T data range.

The co-packaged optics market is expected to grow at the highest CAGR in India from the Asia Pacific region during the forecast period.

The Asia Pacific region continues to be a significant market for co-packaged opticss. The Asia Pacific region has witnessed significant growth in data center infrastructure due to the rising demand for cloud computing, digital services, and e-commerce. With the deployment of 5G networks in the Asia- Pacific countries, high-speed, low-latency communication links are essential. In India, the data center industry is rapidly expanding as more than half a million digital users generate and consume increasing amounts of data, with a growing preference for cloud services. India is now becoming a prime global destination for data center construction as India has become a fast-growing DC hub pursuant to a massive and growing internet user base, explosion of data, and establishment of a favorable environment through the government's Digital India initiative. Moreover, the Indian government's growing support for the data center and telecommunication industry is creating new opportunities.

Co-Packaged Optics Market by Region

Co-Packaged Optics Market by Region

To know about the assumptions considered for the study, download the pdf brochure

Key market players

Major vendors in the co-packaged optics companies include Broadcom (US), Molex (US), Marvell (US), RANOVUS (Canada), Ragile Networks Inc. (US), SENKO (US), Quanta Computer Inc. (Taiwan), Furukawa Electric Co., Ltd. (Japan), among others.

Get online access to the report on the World's First Market Intelligence Cloud

  • Easy to Download Historical Data & Forecast Numbers
  • Company Analysis Dashboard for high growth potential opportunities
  • Research Analyst Access for customization & queries
  • Competitor Analysis with Interactive dashboard
  • Latest News, Updates & Trend analysis
Request Sample

Scope of the Report

Report Metric

Details

Market Size Available for Years

2022–2028

Base Year

2022

Forecast Period

2023–2028

Units

Value (USD Million/USD Billion)

Segments Covered

Type, Data Rates, Application, and Region

Regions Covered

North America, Europe, Asia Pacific, and RoW

Companies Covered

Broadcom (US), Molex (US), Marvell (US),
RANOVUS (Canada), Ragile Networks Inc. (US), SENKO (US), Quanta Computer Inc. (Taiwan), Furukawa Electric Co., Ltd. (Japan), among others
A total of 14 players are profiled in the report.

Co-Packaged Optics Market Highlights

This report categorizes the co-packaged optics market based on type, data rates, application, and region.

Segment

Subsegment

By Type

  • CPO
  • NPO

By Data Rates

  • Less than 1.6 T & 1.6 T
  • 3.2 T
  • 6.4 T

By Application

  • Data Centers and High-performance Computing (HPC)
  • Telecommunications and Networking
  • Others

By Region

  • North America
    • US
    • Canada
    • Mexico
  • Europe
    • Germany
    • UK
    • France
    • Italy
    • Rest of Europe
  • Asia Pacific
    • China
    • Japan
    • India
    • Rest of Asia Pacific
  • RoW
    • Middle East & Africa
    • South America

Recent developments

  • In March 2023, Furukawa Electric Co., Ltd. developed an 8-channel TOSA (transmitter optical sub-assembly) employing a blind mate optical connector at OFC2023, one of the largest international conferences in the optical communication market.
  • In July 2023, SENKO acquired CudoForm Inc. (US), one of the leading companies in designing and manufacturing high-precision metal micro-optic components.
  • In March 2023, Broadcom Inc. (US) has demonstrated its new chip, Tomahawk 5 51.2Tbps Switch Chip with eight 64-channel silicon photonic engines onboard. This new chip can power 800Gbps of traffic at 5.5W by reducing the need to electrically drive signals to pluggable optics at the front of the switch.

Frequently asked questions :

To speak to our analyst for a discussion on the above findings, click Speak to Analyst

TABLE OF CONTENTS
 
1 INTRODUCTION (Page No. - 22)
    1.1 STUDY OBJECTIVES 
    1.2 MARKET DEFINITION 
           1.2.1 INCLUSIONS AND EXCLUSIONS
    1.3 STUDY SCOPE 
           1.3.1 MARKETS COVERED
                    FIGURE 1 CO-PACKAGED OPTICS MARKET SEGMENTATION
           1.3.2 REGIONAL SCOPE
           1.3.3 YEARS CONSIDERED
           1.3.4 CURRENCY CONSIDERED
    1.4 LIMITATIONS 
    1.5 STAKEHOLDERS 
    1.6 IMPACT OF RECESSION 
 
2 RESEARCH METHODOLOGY (Page No. - 26)
    2.1 RESEARCH APPROACH 
           FIGURE 2 CO-PACKAGED OPTICS MARKET: RESEARCH DESIGN
    2.2 SECONDARY AND PRIMARY RESEARCH 
           FIGURE 3 CO-PACKAGED OPTICS MARKET: RESEARCH APPROACH
           2.2.1 SECONDARY DATA
                    2.2.1.1 List of major secondary sources
                    2.2.1.2 Key data from secondary sources
           2.2.2 PRIMARY DATA
                    2.2.2.1 Key data from primary sources
                    2.2.2.2 Breakdown of primaries
                    2.2.2.3 Key industry insights
    2.3 MARKET SIZE ESTIMATION 
           2.3.1 BOTTOM-UP APPROACH
                    2.3.1.1 Approach to derive market size using bottom-up analysis
                               FIGURE 4 MARKET SIZE ESTIMATION METHODOLOGY: BOTTOM-UP APPROACH
                               FIGURE 5 MARKET SIZE ESTIMATION METHODOLOGY (SUPPLY SIDE)
           2.3.2 TOP-DOWN APPROACH
                    2.3.2.1 Approach to derive market size using top-down analysis (supply side)
                               FIGURE 6 MARKET SIZE ESTIMATION METHODOLOGY: TOP-DOWN APPROACH
    2.4 MARKET BREAKDOWN AND DATA TRIANGULATION 
           FIGURE 7 DATA TRIANGULATION
    2.5 RESEARCH ASSUMPTIONS 
    2.6 PARAMETERS CONSIDERED TO ANALYZE IMPACT OF RECESSION ON CO-PACKAGED OPTICS MARKET 
    2.7 LIMITATIONS 
    2.8 RISK ASSESSMENT 
 
3 EXECUTIVE SUMMARY (Page No. - 37)
    FIGURE 8 CPO SEGMENT TO RECORD HIGHER CAGR FROM 2023 TO 2028
    FIGURE 9 3.2 T SEGMENT TO SECURE LARGEST MARKET SHARE IN 2028
    FIGURE 10 DATA CENTERS AND HIGH-PERFORMANCE COMPUTING SEGMENT TO DOMINATE MARKET IN 2023
    FIGURE 11 NORTH AMERICA ACCOUNTED FOR LARGEST MARKET SHARE IN 2022
 
4 PREMIUM INSIGHTS (Page No. - 40)
    4.1 ATTRACTIVE OPPORTUNITIES FOR PLAYERS IN CO-PACKAGED OPTICS MARKET 
           FIGURE 12 GROWTH IN HIGH-PERFORMANCE COMPUTING TO DRIVE MARKET
    4.2 CO-PACKAGED OPTICS MARKET, BY TYPE 
           FIGURE 13 CPO SEGMENT TO RECORD HIGHEST CAGR DURING FORECAST PERIOD
    4.3 CO-PACKAGED OPTICS MARKET IN NORTH AMERICA, BY APPLICATION AND COUNTRY 
           FIGURE 14 DATA CENTERS AND HIGH-PERFORMANCE COMPUTING SEGMENT AND US HELD LARGEST MARKET SHARES IN 2022
    4.4 CO-PACKAGED OPTICS MARKET, BY COUNTRY 
           FIGURE 15 INDIA TO DOMINATE GLOBAL CO-PACKAGED OPTICS MARKET DURING FORECAST PERIOD
 
5 MARKET OVERVIEW (Page No. - 43)
    5.1 INTRODUCTION 
    5.2 MARKET DYNAMICS 
           FIGURE 16 CO-PACKAGED OPTICS MARKET: DRIVERS, RESTRAINTS, OPPORTUNITIES, AND CHALLENGES
           5.2.1 DRIVERS
                    FIGURE 17 CO-PACKAGED OPTICS MARKET: IMPACT ANALYSIS OF DRIVERS
                    5.2.1.1 Growing investments by tech giants in data center infrastructure
                    5.2.1.2 Increasing use of AI/ML-based devices in data centers
                               FIGURE 18 REGION-WISE INTERNET USERS, 2022
                    5.2.1.3 Introduction of ultra-high-definition video streaming
                    5.2.1.4 Need for performance improvement in data centers
           5.2.2 RESTRAINTS
                    FIGURE 19 CO-PACKAGED OPTICS MARKET: IMPACT ANALYSIS OF RESTRAINTS
                    5.2.2.1 Complicated design and fabrication process
                    5.2.2.2 Increased network complexity
           5.2.3 OPPORTUNITIES
                    FIGURE 20 CO-PACKAGED OPTICS MARKET: IMPACT ANALYSIS OF OPPORTUNITIES
                    5.2.3.1 Penetration of IoT and connected devices in education and healthcare sectors
                    5.2.3.2 Rising deployment of 5G networks
           5.2.4 CHALLENGES
                    FIGURE 21 CO-PACKAGED OPTICS MARKET: IMPACT ANALYSIS OF CHALLENGES
                    5.2.4.1 Increasing fiber counts per switch
                    5.2.4.2 Complexities associated with fiber routing and installation of fibers
    5.3 TRENDS/DISRUPTIONS IMPACTING CUSTOMER BUSINESS 
           FIGURE 22 REVENUE SHIFTS AND NEW REVENUE POCKETS FOR PLAYERS IN CO-PACKAGED OPTICS MARKET
    5.4 PRICING ANALYSIS 
           5.4.1 AVERAGE SELLING PRICE (ASP) TREND OF OPTICAL TRANSCEIVERS
                    TABLE 1 AVERAGE SELLING PRICE OF OPTICAL TRANSCEIVERS
           5.4.2 AVERAGE SELLING PRICE (ASP) OF OPTICAL TRANSCEIVERS OFFERED BY KEY PLAYERS
                    FIGURE 23 AVERAGE SELLING PRICE (ASP) OF OPTICAL TRANSCEIVERS OFFERED BY KEY PLAYERS
                    TABLE 2 AVERAGE SELLING PRICE OF OPTICAL TRANSCEIVERS OFFERED BY TOP PLAYERS
                    FIGURE 24 ASP TREND OF CO-PACKAGED OPTICS, BY DATA RATE
    5.5 VALUE CHAIN ANALYSIS 
           FIGURE 25 CO-PACKAGED OPTICS MARKET: VALUE CHAIN ANALYSIS
    5.6 ECOSYSTEM MAPPING 
           TABLE 3 COMPANIES AND THEIR ROLE IN CO-PACKAGED OPTICS ECOSYSTEM
    5.7 TECHNOLOGY ANALYSIS 
           5.7.1 PLUGGABLE OPTICAL TRANSCEIVERS
           5.7.2 ON-BOARD OPTICS
           5.7.3 NEAR-PACKAGED OPTICS
           5.7.4 FUTURE CO-PACKAGED OPTICS
    5.8 PATENT ANALYSIS 
           FIGURE 26 TOP 10 COMPANIES WITH HIGHEST NUMBER OF PATENT APPLICATIONS IN LAST 10 YEARS
           TABLE 4 TOP 20 PATENT OWNERS IN US IN LAST 10 YEARS
           FIGURE 27 NUMBER OF PATENTS GRANTED PER YEAR, 2012–2022
           TABLE 5 CO-PACKAGED OPTICS MARKET: LIST OF PATENTS, 2022–2023
    5.9 TRADE AND TARIFF ANALYSIS 
           5.9.1 TRADE ANALYSIS
                    5.9.1.1 Trade data for HS code 851769
                               FIGURE 28 IMPORT DATA FOR HS CODE 851769, BY COUNTRY, 2018–2022 (USD THOUSAND)
                               FIGURE 29 EXPORT DATA FOR HS CODE 851769, BY COUNTRY, 2018−2022 (USD THOUSAND)
           5.9.2 TARIFF ANALYSIS
                    TABLE 6 TARIFF LEVIED ON EXPORT OF TRANSMISSION OR RECEPTION APPARATUS BY CHINA, 2022
                    TABLE 7 TARIFF LEVIED ON EXPORT OF TRANSMISSION OR RECEPTION APPARATUS BY US, 2022
                    TABLE 8 TARIFF LEVIED ON EXPORT OF TRANSMISSION OR RECEPTION APPARATUS BY GERMANY, 2022
                    TABLE 9 TARIFF LEVIED ON EXPORT OF TRANSMISSION OR RECEPTION APPARATUS BY NETHERLANDS, 2022
                    TABLE 10 TARIFF LEVIED ON EXPORT OF TRANSMISSION OR RECEPTION APPARATUS BY MEXICO, 2022
    5.10 KEY CONFERENCES AND EVENTS, 2023–2024 
           TABLE 11 CO-PACKAGED OPTICS MARKET: LIST OF CONFERENCES AND EVENTS
           5.10.1 REGULATORY LANDSCAPE
                    5.10.1.1 Standards and regulatory bodies
                               5.10.1.1.1 International Electrotechnical Commission
                    5.10.1.2 International Organization for Standardization
                    5.10.1.3 European Union directives
                    5.10.1.4 Federal Communications Commission regulations
                    5.10.1.5 National Institute of Standards and Technology guidelines
           5.10.2 REGULATIONS
                    5.10.2.1 Environmental regulations
                    5.10.2.2 Safety regulations
                    5.10.2.3 Intellectual property regulations
                    5.10.2.4 Export regulations
                    5.10.2.5 Standards and certification requirements
    5.11 PORTER'S FIVE FORCES ANALYSIS 
           TABLE 12 CO-PACKAGED OPTICS MARKET: PORTER'S FIVE FORCES ANALYSIS
           FIGURE 30 CO-PACKAGED OPTICS MARKET: PORTER'S FIVE FORCES ANALYSIS
           5.11.1 INTENSITY OF COMPETITIVE RIVALRY
           5.11.2 BARGAINING POWER OF SUPPLIERS
           5.11.3 BARGAINING POWER OF BUYERS
           5.11.4 THREAT OF SUBSTITUTES
           5.11.5 THREAT OF NEW ENTRANTS
    5.12 KEY STAKEHOLDERS AND BUYING CRITERIA 
           5.12.1 KEY STAKEHOLDERS IN BUYING PROCESS
                    FIGURE 31 INFLUENCE OF STAKEHOLDERS ON BUYING PROCESS FOR TOP THREE APPLICATIONS
                    TABLE 13 INFLUENCE OF STAKEHOLDERS ON BUYING PROCESS FOR TOP THREE APPLICATIONS
           5.12.2 BUYING CRITERIA
                    FIGURE 32 KEY BUYING CRITERIA FOR TOP THREE APPLICATIONS
                    TABLE 14 KEY BUYING CRITERIA FOR TOP THREE APPLICATIONS
 
6 CO-PACKAGED OPTICS MARKET, BY TYPE (Page No. - 71)
    6.1 INTRODUCTION 
           FIGURE 33 CPO SEGMENT TO DISPLAY HIGHER CAGR DURING FORECAST PERIOD
           TABLE 15 CO-PACKAGED OPTICS MARKET, BY TYPE, 2022–2028 (USD MILLION)
    6.2 CO-PACKAGED OPTICS (CPO) 
           6.2.1 INCREASING NUMBER OF MEGA DATA CENTERS TO FOSTER SEGMENTAL GROWTH
                    TABLE 16 CPO: CO-PACKAGED OPTICS MARKET, BY APPLICATION, 2022–2028 (USD MILLION)
                    TABLE 17 CPO: CO-PACKAGED OPTICS MARKET FOR DATA CENTERS AND HIGH-PERFORMANCE COMPUTING, BY REGION, 2022–2028 (USD MILLION)
                    TABLE 18 CPO: CO-PACKAGED OPTICS MARKET FOR TELECOMMUNICATIONS AND NETWORKING, BY REGION, 2022–2028 (USD MILLION)
                    TABLE 19 CPO: CO-PACKAGED OPTICS MARKET FOR OTHERS, BY REGION, 2022–2028 (USD MILLION)
                    TABLE 20 CPO: CO-PACKAGED OPTICS MARKET, BY REGION, 2022–2028 (USD MILLION)
    6.3 NEAR-PACKAGED OPTICS (NPO) 
           6.3.1 ABILITY TO IMPROVE SIGNAL INTEGRITY TO DRIVE DEMAND
                    TABLE 21 NPO: CO-PACKAGED OPTICS MARKET, BY APPLICATION, 2022–2028 (USD MILLION)
                    TABLE 22 NPO: CO-PACKAGED OPTICS MARKET FOR DATA CENTERS AND HIGH-PERFORMANCE COMPUTING, BY REGION, 2022–2028 (USD MILLION)
                    TABLE 23 NPO: CO-PACKAGED OPTICS MARKET FOR TELECOMMUNICATIONS AND NETWORKING, BY REGION, 2022–2028 (USD MILLION)
                    TABLE 24 NPO: CO-PACKAGED OPTICS MARKET FOR OTHERS, BY REGION, 2022–2028 (USD MILLION)
                    TABLE 25 NPO: CO-PACKAGED OPTICS MARKET, BY REGION, 2022–2028 (USD MILLION)
 
7 CO-PACKAGED OPTICS MARKET, BY DATA RATE (Page No. - 77)
    7.1 INTRODUCTION 
           FIGURE 34 CO-PACKAGED OPTICS MARKET, BY DATA RATE
           FIGURE 35 LESS THAN 1.6 T & 1.6 T SEGMENT TO DOMINATE MARKET IN 2023
           TABLE 26 CO-PACKAGED OPTICS MARKET, BY DATA RATE, 2022–2028 (USD MILLION)
           TABLE 27 CO-PACKAGED OPTICS MARKET, BY DATA RATES, 2022–2028 (THOUSAND UNITS)
    7.2 LESS THAN 1.6 T & 1.6 T 
           7.2.1 EXPANDING TELECOMMUNICATION SECTOR TO FOSTER SEGMENTAL GROWTH
    7.3 3.2 T 
           7.3.1 INCREASING PENETRATION OF CLOUD COMPUTING TO CONTRIBUTE TO MARKET GROWTH
    7.4 6.4 T 
           7.4.1 INCREASING DEMAND FOR HIGH-SPEED AND RELIABLE DATA COMMUNICATION TO DRIVE MARKET
 
8 TECHNOLOGIES USED IN CO-PACKAGING OPTICS (Page No. - 81)
    8.1 INTRODUCTION 
           FIGURE 36 TECHNOLOGIES USED IN CO-PACKAGED OPTICS
    8.2 2.5D CPO 
           8.2.1 ABILITY TO COMBINE OPTICAL AND ELECTRONIC COMPONENTS INTO SINGLE PACKAGES TO DRIVE MARKET
    8.3 3D CPO 
           8.3.1 NEED TO REDUCE INTERCONNECT DELAYS TO BOOST DEMAND
 
9 CO-PACKAGED OPTICS MARKET, BY APPLICATION (Page No. - 83)
    9.1 INTRODUCTION 
           FIGURE 37 CO-PACKAGED OPTICS MARKET, BY APPLICATION
           FIGURE 38 DATA CENTERS AND HIGH-PERFORMANCE COMPUTING SEGMENT TO DOMINATE MARKET IN 2023
           TABLE 28 CO-PACKAGED OPTICS MARKET, BY APPLICATION, 2022–2028 (USD MILLION)
    9.2 DATA CENTER AND HIGH-PERFORMANCE COMPUTING 
           9.2.1 ABILITY TO INTEGRATE OPTICAL COMPONENTS DIRECTLY INTO SEMICONDUCTOR PACKAGES TO DRIVE MARKET
                    TABLE 29 DATA CENTERS AND HIGH-PERFORMANCE COMPUTING: CO-PACKAGED OPTICS MARKET, BY TYPE, 2022–2028 (USD MILLION)
                    TABLE 30 DATA CENTERS AND HIGH-PERFORMANCE COMPUTING: CO-PACKAGED OPTICS MARKET BY REGION, 2022–2028 (USD MILLION)
                    TABLE 31 NORTH AMERICA: CO-PACKAGED OPTICS MARKET FOR DATA CENTERS AND HIGH-PERFORMANCE COMPUTING, BY COUNTRY, 2022–2028 (USD MILLION)
                    TABLE 32 EUROPE: CO-PACKAGED OPTICS MARKET FOR DATA CENTERS AND HIGH-PERFORMANCE COMPUTING, BY COUNTRY, 2022–2028 (USD MILLION)
                    TABLE 33 ASIA PACIFIC: CO-PACKAGED OPTICS MARKET FOR DATA CENTERS AND HIGH-PERFORMANCE COMPUTING, BY COUNTRY, 2022–2028 (USD MILLION)
                    TABLE 34 ROW: CO-PACKAGED OPTICS MARKET FOR DATA CENTERS AND HIGH-PERFORMANCE COMPUTING, BY REGION, 2022–2028 (USD MILLION)
    9.3 TELECOMMUNICATIONS AND NETWORKING 
           9.3.1 INCREASED DATA TRAFFIC DUE TO 5G AND IOT TO FUEL MARKET GROWTH
                    TABLE 35 TELECOMMUNICATIONS AND NETWORKING: CO-PACKAGED OPTICS MARKET, BY TYPE, 2022–2028 (USD MILLION)
                    TABLE 36 TELECOMMUNICATIONS AND NETWORKING: CO-PACKAGED OPTICS MARKET, BY REGION, 2022–2028 (USD MILLION)
    9.4 OTHERS 
           TABLE 37 OTHERS: CO-PACKAGED OPTICS MARKET, BY TYPE, 2022–2028 (USD MILLION)
           TABLE 38 OTHERS: CO-PACKAGED OPTICS MARKET, BY REGION, 2022–2028 (USD MILLION)
 
10 CO-PACKAGED OPTICS MARKET, BY REGION (Page No. - 90)
     10.1 INTRODUCTION 
             FIGURE 39 CO-PACKAGED OPTICS MARKET, BY REGION
             FIGURE 40 ASIA PACIFIC TO REGISTER HIGHEST CAGR DURING FORECAST PERIOD
             TABLE 39 CO-PACKAGED OPTICS MARKET, BY REGION, 2022–2028 (USD MILLION)
     10.2 NORTH AMERICA 
             FIGURE 41 NORTH AMERICA: CO-PACKAGED OPTICS MARKET SNAPSHOT
             TABLE 40 NORTH AMERICA: CO-PACKAGED OPTICS MARKET, BY COUNTRY, 2022–2028 (USD MILLION)
             TABLE 41 NORTH AMERICA: CO-PACKAGED OPTICS MARKET, BY APPLICATION, 2022–2028 (USD MILLION)
             TABLE 42 NORTH AMERICA: CO-PACKAGED OPTICS MARKET, BY TYPE, 2022–2028 (USD MILLION)
             10.2.1 US
                        10.2.1.1 Expansion of edge computing infrastructure to drive market
             10.2.2 CANADA
                        10.2.2.1 Accelerated demand for high-speed and wireless networking to foster growth
             10.2.3 MEXICO
                        10.2.3.1 Expansion and modernization of telecommunications infrastructure to fuel market growth
             10.2.4 IMPACT OF RECESSION ON CO-PACKAGED OPTICS MARKET IN NORTH AMERICA
     10.3 EUROPE 
             FIGURE 42 EUROPE: CO-PACKAGED OPTICS MARKET SNAPSHOT
             TABLE 43 EUROPE: CO-PACKAGED OPTICS MARKET, BY COUNTRY, 2022–2028 (USD MILLION)
             TABLE 44 EUROPE: CO-PACKAGED OPTICS MARKET, BY APPLICATION, 2022–2028 (USD MILLION)
             TABLE 45 EUROPE: CO-PACKAGED OPTICS MARKET, BY TYPE, 2022–2028 (USD MILLION)
             10.3.1 UK
                        10.3.1.1 Government-led initiatives promoting adoption of AI and big data analytics to support market growth
             10.3.2 GERMANY
                        10.3.2.1 Advent of Industry 4.0 and IoT to offer lucrative growth opportunities to market players
             10.3.3 FRANCE
                        10.3.3.1 Adoption of AI and ML in various public sector applications to drive market
             10.3.4 ITALY
                        10.3.4.1 Ongoing expansion of data centers to drive market
             10.3.5 REST OF EUROPE
             10.3.6 IMPACT OF RECESSION ON CO-PACKAGED OPTICS MARKET IN EUROPE
     10.4 ASIA PACIFIC 
             FIGURE 43 ASIA PACIFIC: CO-PACKAGED OPTICS MARKET SNAPSHOT
             TABLE 46 ASIA PACIFIC: CO-PACKAGED OPTICS MARKET, BY COUNTRY, 2022–2028 (USD MILLION)
             TABLE 47 ASIA PACIFIC: CO-PACKAGED OPTICS MARKET, BY APPLICATION, 2022–2028 (USD MILLION)
             TABLE 48 ASIA PACIFIC: CO-PACKAGED OPTICS MARKET, TYPE, 2022–2028 (USD MILLION)
             10.4.1 CHINA
                        10.4.1.1 Rapid development of IT infrastructure to boost demand
             10.4.2 JAPAN
                        10.4.2.1 Increasing focus of data centers on high-performance computing applications to drive market
             10.4.3 INDIA
                        10.4.3.1 Growing preference for cloud services to fuel market growth
             10.4.4 REST OF ASIA PACIFIC
             10.4.5 IMPACT OF RECESSION ON CO-PACKAGED OPTICS MARKET IN ASIA PACIFIC
     10.5 ROW 
             FIGURE 44 ROW: CO-PACKAGED OPTICS MARKET SNAPSHOT
             TABLE 49 ROW: CO-PACKAGED OPTICS MARKET, BY REGION, 2022–2028 (USD MILLION)
             TABLE 50 ROW: CO-PACKAGED OPTICS MARKET, BY APPLICATION, 2022–2028 (USD MILLION)
             TABLE 51 ROW: CO-PACKAGED OPTICS MARKET, BY TYPE, 2022–2028 (USD MILLION)
             10.5.1 MIDDLE EAST & AFRICA
                        10.5.1.1 Increasing investments in telecom infrastructure development to drive market growth
             10.5.2 SOUTH AMERICA
                        10.5.2.1 Rising emphasis on strengthening network infrastructure to drive market
 
11 COMPETITIVE LANDSCAPE (Page No. - 108)
     11.1 OVERVIEW 
             11.1.1 KEY STRATEGIES ADOPTED BY MAJOR PLAYERS
                        TABLE 52 CO-PACKAGED OPTICS MARKET: OVERVIEW OF STRATEGIES ADOPTED BY KEY PLAYERS
                        11.1.1.1 Product portfolio
                        11.1.1.2 Regional focus
                        11.1.1.3 Organic/Inorganic growth strategies
     11.2 MARKET SHARE ANALYSIS, 2022 
             FIGURE 45 CO-PACKAGED OPTICS MARKET SHARE ANALYSIS, 2022
             TABLE 53 CO-PACKAGED OPTICS MARKET SHARE ANALYSIS, 2022
     11.3 REVENUE ANALYSIS, 2022 
           FIGURE 46 REVENUE ANALYSIS OF KEY PLAYERS
     11.4 COMPANY EVALUATION MATRIX, 2022 
             11.4.1 STARS
             11.4.2 PERVASIVE PLAYERS
             11.4.3 EMERGING LEADERS
             11.4.4 PARTICIPANTS
                        FIGURE 47 CO-PACKAGED OPTICS MARKET: EVALUATION MATRIX FOR KEY COMPANIES, 2022
     11.5 EVALUATION MATRIX FOR START-UPS/SMALL AND MEDIUM-SIZED ENTERPRISES (SMES), 2022 
             11.5.1 PROGRESSIVE COMPANIES
             11.5.2 RESPONSIVE COMPANIES
             11.5.3 DYNAMIC COMPANIES
             11.5.4 STARTING BLOCKS
                        FIGURE 48 CO-PACKAGED OPTICS MARKET: EVALUATION MATRIX FOR START-UPS/SMES, 2022
     11.6 COMPANY FOOTPRINT 
             TABLE 54 COMPANY FOOTPRINT
             TABLE 55 DATA RATE: COMPANY FOOTPRINT
             TABLE 56 APPLICATION: COMPANY FOOTPRINT
             TABLE 57 REGION: COMPANY FOOTPRINT
     11.7 COMPETITIVE BENCHMARKING 
             TABLE 58 CO-PACKAGED OPTICS MARKET: DETAILED LIST OF KEY START-UPS/SMES
             TABLE 59 CO-PACKAGED OPTICS MARKET: COMPETITIVE BENCHMARKING OF KEY START-UPS/SMES
     11.8 COMPETITIVE SCENARIOS AND TRENDS 
             11.8.1 PRODUCT LAUNCHES
                        TABLE 60 CO-PACKAGED OPTICS MARKET: PRODUCT LAUNCHES, 2021–2023
             11.8.2 DEALS
                        TABLE 61 CO-PACKAGED OPTICS MARKET: DEALS, 2021–2023
 
12 COMPANY PROFILES (Page No. - 123)
(Business Overview, Products Offered, Recent Developments, MnM View Right to win, Strategic choices made, Weaknesses and competitive threats) *  
     12.1 INTRODUCTION 
     12.2 KEY PLAYERS 
             12.2.1 BROADCOM
                        TABLE 62 BROADCOM: COMPANY OVERVIEW
                        FIGURE 49 BROADCOM: COMPANY SNAPSHOT
                        TABLE 63 BROADCOM: PRODUCTS/SOLUTIONS/SERVICES OFFERED
                        TABLE 64 BROADCOM: PRODUCT LAUNCHES
                        TABLE 65 BROADCOM: DEALS
             12.2.2 RANOVUS
                        TABLE 66 RANOVUS: COMPANY OVERVIEW
                        TABLE 67 RANOVUS: PRODUCTS/SOLUTIONS/SERVICES OFFERED
                        TABLE 68 RANOVUS: PRODUCT LAUNCHES
                        TABLE 69 RANOVUS: DEALS
             12.2.3 MARVELL
                        TABLE 70 MARVELL: COMPANY OVERVIEW
                        FIGURE 50 MARVELL: COMPANY SNAPSHOT
                        TABLE 71 MARVELL: PRODUCTS/SOLUTIONS/SERVICES OFFERED
                        TABLE 72 MARVELL: PRODUCT LAUNCHES
                        TABLE 73 MARVELL: DEALS
             12.2.4 QUANTA COMPUTER INC.
                        TABLE 74 QUANTA COMPUTER INC.: COMPANY OVERVIEW
                        FIGURE 51 QUANTA COMPUTER INC.: COMPANY SNAPSHOT
                        TABLE 75 QUANTA COMPUTER INC.: PRODUCTS/SOLUTIONS/SERVICES OFFERED
                        TABLE 76 QUANTA COMPUTER INC.: DEALS
             12.2.5 RAGILE NETWORKS INC.
                        TABLE 77 RAGILE NETWORKS INC.: COMPANY OVERVIEW
                        TABLE 78 RAGILE NETWORKS INC.: PRODUCTS/SOLUTIONS/SERVICES OFFERED
                        TABLE 79 RAGILE NETWORKS INC.: PRODUCT LAUNCHES
             12.2.6 MOLEX
                        TABLE 80 MOLEX: COMPANY OVERVIEW
                        TABLE 81 MOLEX: PRODUCTS/SOLUTIONS/SERVICES OFFERED
                        TABLE 82 MOLEX: PRODUCT LAUNCHES
                        TABLE 83 MOLEX: DEALS
             12.2.7 SENKO
                        TABLE 84 SENKO: COMPANY OVERVIEW
                        TABLE 85 SENKO: PRODUCTS/SOLUTIONS/SERVICES OFFERED
                        TABLE 86 SENKO: DEALS
             12.2.8 FURUKAWA ELECTRIC CO., LTD.
                        TABLE 87 FURUKAWA ELECTRIC CO., LTD.: COMPANY OVERVIEW
                        FIGURE 52 FURUKAWA ELECTRIC CO., LTD.: COMPANY SNAPSHOT
                        TABLE 88 FURUKAWA ELECTRIC CO., LTD.: PRODUCTS/SOLUTIONS/SERVICES OFFERED
                        TABLE 89 FURUKAWA ELECTRIC CO., LTD.: PRODUCT LAUNCHES
     12.3 OTHER PLAYERS 
             12.3.1 TE CONNECTIVITY
             12.3.2 SABIC
             12.3.3 RAIN TREE PHOTONICS PTE. LTD.
             12.3.4 RUIJIE NETWORKS CO., LTD.
             12.3.5 SYNOPSYS, INC.
*Details on Business Overview, Products Offered, Recent Developments, MnM View, Right to win, Strategic choices made, Weaknesses and competitive threats might not be captured in case of unlisted companies.  
 
13 APPENDIX (Page No. - 153)
     13.1 DISCUSSION GUIDE 
     13.2 KNOWLEDGESTORE: MARKETSANDMARKETS’ SUBSCRIPTION PORTAL 
     13.3 CUSTOMIZATION OPTIONS 
     13.4 RELATED REPORTS 
     13.5 AUTHOR DETAILS 

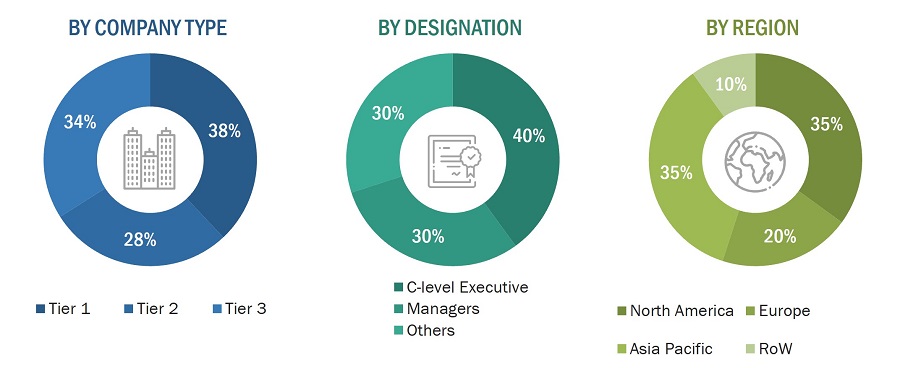
The research process for this study included systematic gathering, recording, and analysis of data about customers and companies operating in the co-packaged optics market. This process involved the extensive use of secondary sources, directories, and databases (Factiva, Oanda, and OneSource) for identifying and collecting valuable information for the comprehensive, technical, market-oriented, and commercial study of the co-packaged optics market. In-depth interviews were conducted with primary respondents, including experts from core and related industries and preferred manufacturers, to obtain and verify critical qualitative and quantitative information as well as to assess growth prospects. Key players in the co-packaged optics market were identified through secondary research, and their market rankings were determined through primary and secondary research. This research included studying annual reports of top players and interviewing key industry experts such as CEOs, directors, and marketing executives.

Secondary Research:

In the secondary research process, various secondary sources were referred to for identifying and collecting information important for this study. Secondary sources included corporate filings, such as annual reports, investor presentations, and financial statements; trade, business, and professional associations; white papers; co-packaged optics products-related journals; certified publications; articles by recognized authors; directories; and databases.

Secondary research was conducted to obtain key information about the industry supply chain, market value chain, key players, market classification and segmentation as per industry trends to the bottom-most level, geographic markets, and key developments from both market- and technology-oriented perspectives. Data from secondary research was collected and analyzed to determine the overall market size, which was further validated by primary research.

Primary research

In the primary research process, various primary sources from the supply and demand sides were interviewed to obtain qualitative and quantitative information for this report. Primary sources from the supply side included industry experts such as CEOs, VPs, marketing directors, technology & innovation directors, and key executives from major companies in the co-packaged optics market.

After going through market engineering (which includes calculations for market statistics, market breakdown, market size estimations, market forecasting, and data triangulation), extensive primary research was conducted to gather information and verify and validate the critical numbers obtained. Primary research was conducted to identify segmentation types, industry trends, key players, competitive landscape, and key market dynamics such as drivers, restraints, opportunities, and challenges, along with the key strategies adopted by players operating in the market.
Co-Packaged Optics Market Size, and Share

To know about the assumptions considered for the study, download the pdf brochure

Market Size Estimation

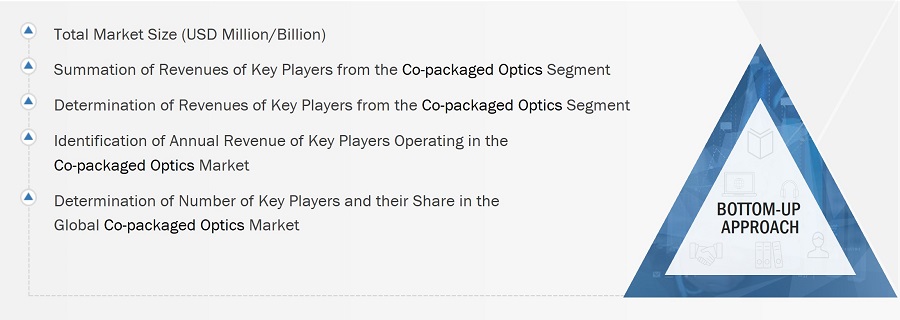
In the complete market engineering process, both top-down and bottom-up approaches were used, along with several data triangulation methods, to estimate and forecast the size of the market and its segments and subsegments listed in the report. Extensive qualitative and quantitative analyses were carried out on the complete market engineering process to list the key information/insights pertaining to the co-packaged optics market.

The key players in the market were identified through secondary research, and their rankings in the respective regions were determined through primary and secondary research. This entire procedure involved the study of the annual and financial reports of top players, as well as interviews with industry experts such as chief executive officers, vice presidents, directors, and marketing executives for quantitative and qualitative key insights. All percentage shares, splits, and breakdowns were determined using secondary sources and verified through primary sources. All parameters that affect the markets covered in this research study were accounted for, viewed in extensive detail, verified through primary research, and analyzed to obtain the final quantitative and qualitative data. This data was consolidated and enhanced with detailed inputs and analysis from MarketsandMarkets and presented in this report.

Co-packaged optics market: Bottom-up Approach
Co-Packaged Optics Market Size, and Bottom-up Approach

Co-packaged optics market: Top-down Approach

Co-Packaged Optics Market Size, and Top-down Approach

Data Triangulation

After arriving at the overall size of the co-packaged optics market from the market size estimation process explained above, the total market was split into several segments and subsegments. Where applicable, the market breakdown and data triangulation procedures were employed to complete the overall market engineering process and arrive at the exact statistics for all segments and subsegments. The data was triangulated by studying various factors and trends from both the demand and supply sides. Along with this, the market size was validated using top-down and bottom-up approaches.

Market Definition

Co-packaged optics (CPO) is a technology that combines optical transceivers directly with electronic chips or application-specific integrated circuits (ASICs) within a single package. By integrating optical and electronic components, CPO creates a more compact and efficient data transmission and processing solution. In CPO, optical components such as lasers, modulators, and photodetectors are integrated with electronic components like ASICs or processing units in close proximity within the same package. The close integration of optical and electronic components in CPO can result in lower latency in data transmission, making it ideal for applications that require real-time processing, such as financial trading platforms or 5G networks.

Key Stakeholders

  • Component and material providers
  • Semiconductor foundries
  • Silicon photonics platform developers
  • Silicon photonics product manufacturers and suppliers
  • Assembly and testing vendors
  • Original equipment manufacturers
  • Research organizations and consulting companies
  • Technology investors
  • Associations, alliances, and organizations related to silicon photonics
  • Analysts and strategic business planners
  • End users

Report Objectives

  • To define, describe, and forecast the co-packaged optics market based on data rates, components, applications, and regions.
  • To forecast the sizes of various segments with respect to four major regions—
    North America, Europe, Asia Pacific, and RoW
  • To provide a detailed analysis of the co-packaged optics supply chain
  • To analyze the impact of the recession on co-packaged optics market
  • To strategically analyze the micromarkets1 with respect to individual growth trends and prospects and their contributions to the total market
  • To understand competitive developments such as expansions, agreements, partnerships, acquisitions, product developments, and research and development (R&D)
  • To analyze the opportunities for market players and provide details of the competitive landscape of the market
  • To benchmark the market players using the proprietary company evaluation matrix framework, which analyzes the market players on various parameters within the broad categories of business strategy excellence and strength of product portfolios
  • To strategically profile the key players and comprehensively analyze their market positions in terms of ranking and core competencies2, along with a detailed market competitive landscape

Available Customizations

With the given market data, MarketsandMarkets offers customizations according to the specific requirements of companies.

Product analysis

  • Detailed analysis and profiling of additional market players

The following customization options are available for the report:

  • Market sizing and forecast for additional countries
  • Additional five companies profiling
Custom Market Research Services

We will customize the research for you, in case the report listed above does not meet with your exact requirements. Our custom research will comprehensively cover the business information you require to help you arrive at strategic and profitable business decisions.

Request Customization
Report Code
SE 8826
Published ON
Oct, 2023
Choose License Type
BUY NOW
  • SHARE
X
Request Customization
Speak to Analyst
Speak to Analyst
OR FACE-TO-FACE MEETING
PERSONALIZE THIS RESEARCH
  • Triangulate with your Own Data
  • Get Data as per your Format and Definition
  • Gain a Deeper Dive on a Specific Application, Geography, Customer or Competitor
  • Any level of Personalization
REQUEST A FREE CUSTOMIZATION
LET US HELP YOU!
  • What are the Known and Unknown Adjacencies Impacting the Co-Packaged Optics Market
  • What will your New Revenue Sources be?
  • Who will be your Top Customer; what will make them switch?
  • Defend your Market Share or Win Competitors
  • Get a Scorecard for Target Partners
CUSTOMIZED WORKSHOP REQUEST
+1-888-600-6441
  • Call Us
  • +1-888-600-6441 (Corporate office hours)
  • +1-888-600-6441 (US/Can toll free)
  • +44-800-368-9399 (UK office hours)
CONNECT WITH US
ABOUT TRUST ONLINE
©2024 MarketsandMarkets Research Private Ltd. All rights reserved
DMCA.com Protection Status Website Feedback