
Cocoa and Chocolate Market

Cocoa and Chocolate Market by Cocoa Type (Butter, Powder, Liquor), Chocolate Type (Dark, Milk, White, Filled), Nature (Conventional, Organic), Application, Product Form, Distribution Channel, and Region - Global Forecast to 2030


OVERVIEW
Source: Secondary Research, Interviews with Experts, MarketsandMarkets Analysis
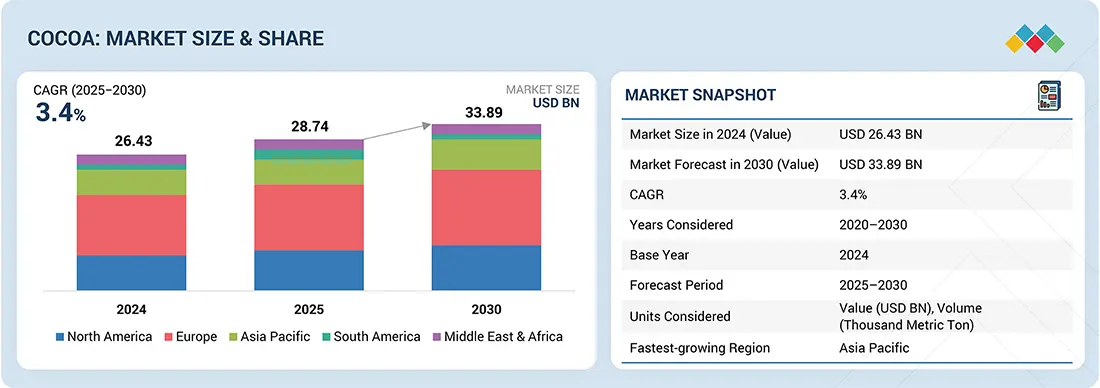
The cocoa market is estimated to be valued at USD 28.74 billion in 2025. It is projected to reach USD 33.89 billion by 2030, growing at a CAGR of 3.4% during the forecast period. The cocoa market is being driven by increasing demand for chocolate and confectionery products, expansion of cocoa applications in food and beverages, and rising utilization in cosmetics and pharmaceuticals. Growing consumer inclination towards organic cocoa products and sustainable sourcing practices is further supporting market growth. Additionally, innovations in processing technologies and premiumization trends in chocolate manufacturing are contributing to the steady expansion of the market.
Market Size and Forecast:
- Market Size Value in 2024: USD 26.43 Billion
- Market Size Value in 2025: USD 28.74 Billion
- Revenue Forecast in 2030: USD 33.89 Billion
- Growth Rate: CAGR of 3.4% from 2024 to 2029
- Base year: 2024
- Forecast period: 2025–2030
- North America held a 26.13% share of the cocoa market in 2024, driven by strong chocolate consumption and demand for premium cocoa products.
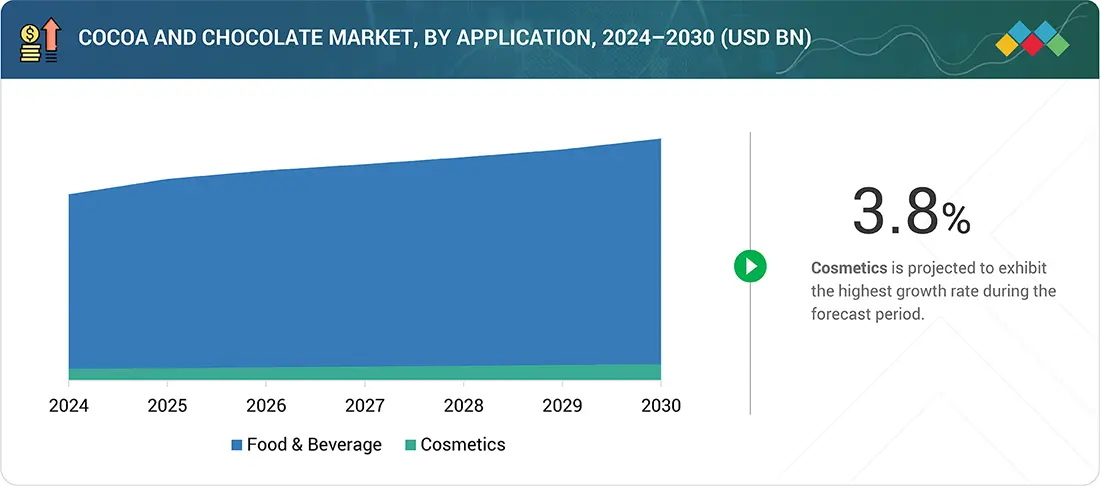
- Cosmetics are expected to register the highest CAGR of 3.8% between 2025 and 2030.
Key Market Trends and Insights
- By Type: Increasing demand for cocoa butter, cocoa powder, cocoa liquor, dark chocolate, milk chocolate, and premium chocolate products across confectionery, bakery, dairy, beverage, and cosmetic applications is driving significant growth in the cocoa and chocolate market.
- Growth Drivers: Rising consumer demand for premium and functional chocolate products, expanding use of cocoa ingredients across food, beverage, cosmetics, and pharmaceutical industries, along with growing preference for sustainably sourced and organic cocoa, are fueling market expansion.
- Growing Trends: Manufacturers are increasingly focusing on premiumization, clean-label formulations, plant-based and low-sugar chocolates, ethical cocoa sourcing, digital traceability, and innovative product offerings to meet evolving consumer preferences and strengthen brand value.
- Growth Opportunities: Rising chocolate consumption in emerging economies, increasing investments in sustainable cocoa supply chains, expanding e-commerce and specialty retail channels, and growing demand for high-quality cocoa ingredients in food processing and personal care applications are creating substantial growth opportunities for the cocoa and chocolate market.
KEY TAKEAWAYS
- North America held a 26.13% share of the cocoa market in 2024, driven by strong chocolate consumption and demand for premium cocoa products.
- Cocoa butter dominated the market in 2024, recording the highest CAGR of 3.6%.
- The conventional cocoa segment is projected to grow at the fastest rate from 2025 to 2030.
- Cosmetics are expected to register the highest CAGR of 3.8% between 2025 and 2030.
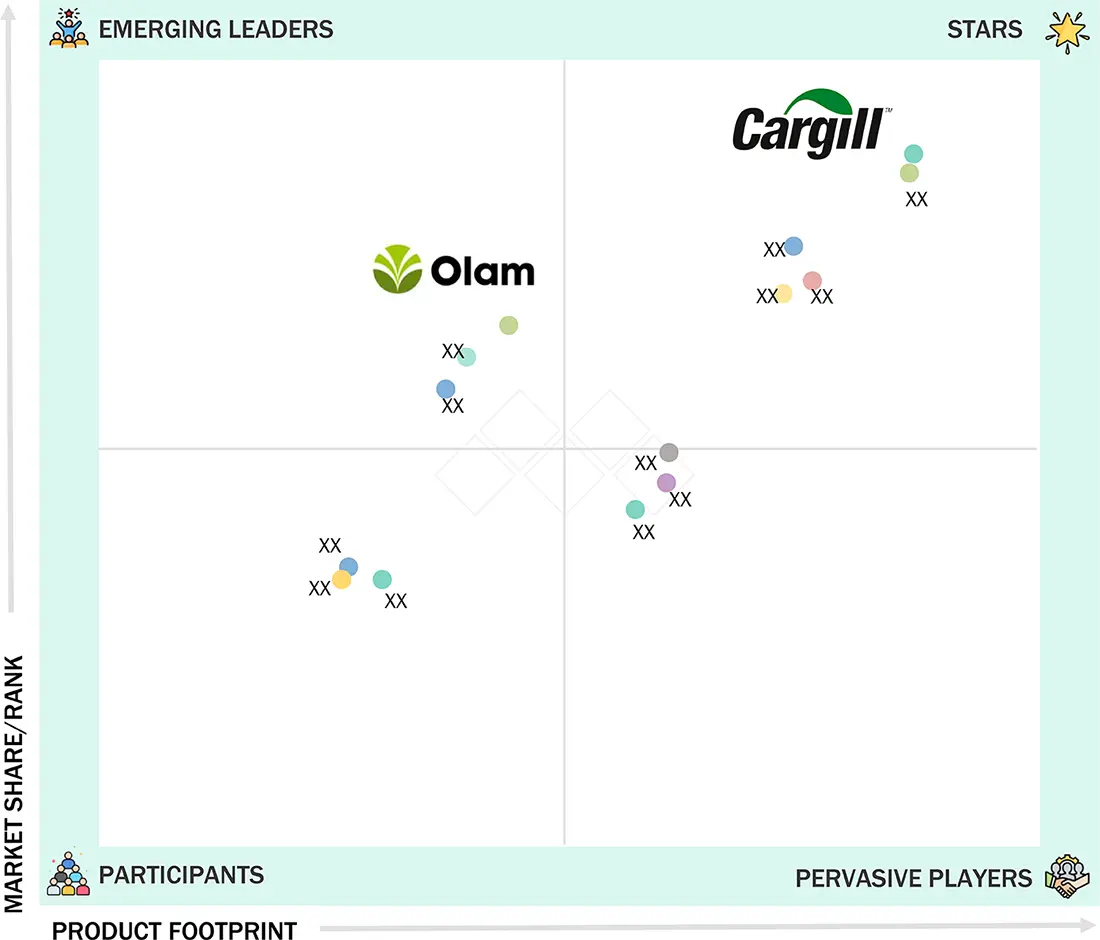
- Companies positioned in the Stars and Pervasive Players quadrants, such as Cargill, Olam Group, Puratos Group, ECOM Agroindustrial, and Max Felchlin AG, demonstrate strong market presence supported by broad product portfolios and sustainability-focused strategies.
- Firms in the Responsive and Progressive Companies quadrants, such as CAMPCO Chocolates, Jindal Cocoa, República del Cacao, Gencau.Br, Chocolaterie de l’Opéra, and Fris-Holm Chokolade show high potential through premium positioning, innovation, and niche market specialization.
The competitive landscape of the cocoa market is defined by rising demand across multiple industries, driven by evolving consumer preferences and product innovations. Companies are expanding product portfolios by introducing premium and organic cocoa-based offerings, supported by increasing demand for clean-label and sustainable products. Food & beverage continues to be the primary application area, with strong growth in confectionery, bakery, and beverages, while cosmetics and pharmaceuticals are emerging as secondary growth drivers. Sustainability and traceability remain central strategies, with global players investing in certified sourcing, farmer-support programs, and ethical supply chain practices. Innovations in processing technology, including flavor enhancement and reduced-fat cocoa, are enabling diversification into new product categories. Regional demand is shifting, with Europe maintaining dominance, North America showing steady growth, and Asia Pacific emerging as a key consumption hub due to urbanization and rising disposable incomes. Market participants are increasingly focused on organic cocoa development, partnerships with farmers, and premiumization strategies to capture evolving consumer demand. Overall, the cocoa market reflects a balance of stable growth in traditional applications and rising opportunities in high-value, differentiated segments.
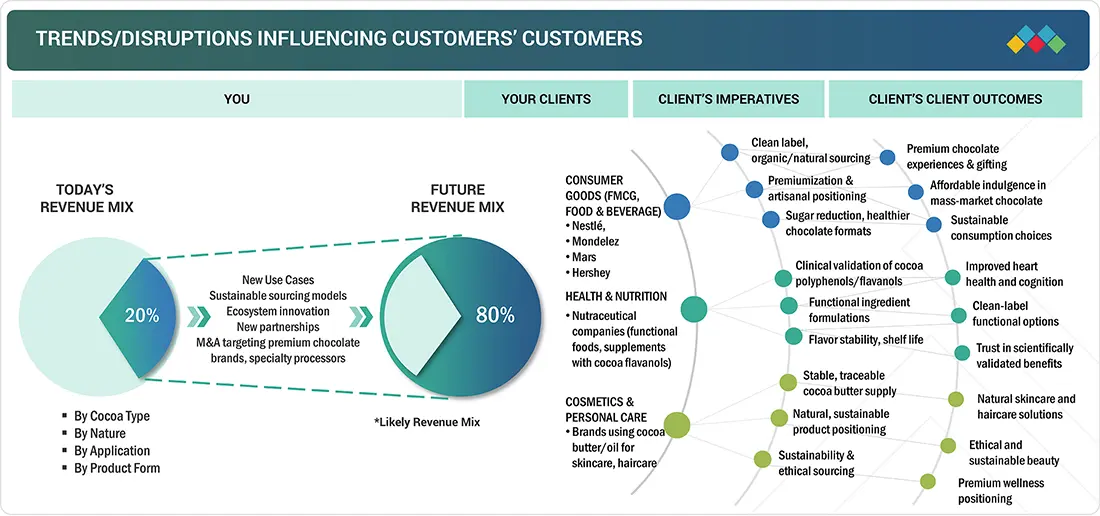
TRENDS & DISRUPTIONS IMPACTING CUSTOMERS' CUSTOMERS
The cocoa market is undergoing a significant transformation driven by evolving consumer preferences and supply chain dynamics. Key trends include rising demand for premium and artisanal chocolate, increasing adoption of organic and fair-trade certified cocoa, and growing application of cocoa in cosmetics and nutraceuticals. Health-conscious consumers are favoring products with higher cocoa content and reduced sugar, while sustainability and traceability have become critical differentiators, pushing companies to adopt farmer-support programs and certified sourcing models. Disruptions in the market are primarily linked to climate change, volatile cocoa bean prices, and geopolitical uncertainties in key producing regions of West Africa. Extreme weather patterns and crop diseases are reducing yields, creating concerns around long-term supply stability. In addition, stricter regulatory frameworks in Europe and North America regarding deforestation-free and ethically sourced cocoa are compelling companies to redesign sourcing and production strategies. Technological advancements, including flavor-enhancing processing and digital traceability platforms, are also reshaping industry practices. The overall impact is a gradual shift towards more resilient, transparent, and value-added cocoa supply chains. While cost pressures persist, companies investing in sustainable sourcing, product innovation, and regional expansion are better positioned to capture growth opportunities, especially in emerging markets across Asia Pacific.
Source: Secondary Research, Interviews with Experts, MarketsandMarkets Analysis
MARKET DYNAMICS
Level
-
Health benefits of chocolates

-
Rising demand for premium and dark chocolate

Level
-
Highly unstable economies in cocoa-producing countries

-
High volatility in cocoa prices

Level
-
Low penetration rate in developing countries

-
Cocoa derivatives in adjacent sectors

Level
-
Increase in counterfeit products

-
Fragmented smallholder farming system

Source: Secondary Research, Interviews with Experts, MarketsandMarkets Analysis
Driver: Rising Demand for Functional and Premium Chocolate Offerings
The global cocoa and chocolate market is witnessing strong growth due to the rising demand for premium and functional chocolates. Consumers are now increasingly preferring products that provide an additional layer of health benefits, such as high cocoa content, low sugar content, and plant-based alternatives. Dark chocolate acts as an acceptance for the heart because of its growing value among consumers. Barry Callebaut also launched, in May 2024, the "Next Generation Cacao" range, which features nutrient-dense formulations to meet the demand for wellness-based chocolates. An increase in the urban middle-class population and disposable incomes in emerging economies is further favoring expenditure on premium and artisanal chocolates. This driver was also at work with innovations of probiotic, high-protein variants of chocolate, catering to the needs of health-conscious segments. Demand is expected to increase in online and specialty retail formats in conjunction with market expansion as brands continue to chase functional positioning and transparency in cocoa sourcing.
Restraint: Cocoa Price Volatility Affecting Manufacturer Margins
The prime restraint in the cocoa and chocolate market is that cocoa beans are subject to price fluctuation, which, more often than not, affects the cost structure of a manufacturer. Even geopolitics and climate-induced crop failures are responsible for causing the price to fluctuate, not to mention supply chain disturbances in producer countries, most of which are Côte d'Ivoire and Ghana. Then, in April 2024, it was reported that cocoa prices surged to a 46-year high due to drought conditions and disease outbreaks hitting West African harvests. As such, procurement has increased in price for the big players as well as mid-tier chocolatiers. Cocoa import-dependent companies are, therefore, forced either to raise prices or face the risk of being rendered uncompetitive. Price instability, on the other hand, impedes the development of long-term sourcing plans and narrows possibilities for creating affordable product options. Whereas large corporations can minimize risk exposure through futures contracts and diversified sourcing, smaller players are left bare. Thus, cocoa price volatility remains a key constraint, severely impacting profitability, production planning, and supply chain resilience throughout the value chain.
Opportunity: Expansion in Sustainable and Traceable Supply Chains
Ethically sourced and environmentally sustainable chocolate is increasingly being demanded, thus presenting new growth opportunities. Traceability, deforestation-free sourcing, and fair labor practices are being pressed upon by consumers and regulators. In June 2025, Mondelez International extended its Cocoa Life program into India and Southeast Asia to enhance sustainability and traceability at the farm level. This goes beyond the purely ethical supply bias and is well in line with forthcoming EU due diligence legislation for traceable and sustainable agricultural imports. On the other hand, technological advancements in digital traceability, including blockchain and QR code packaging, render it possible for brands to be transparent with regard to their supply chain in real time-from bean to bar. These innovations, in turn, bolster brand credibility and consumer trust, especially in the premium segments. The brands investing in verifiable sustainability certifications (such as Rainforest Alliance and Fairtrade) and digital sourcing transparency will undoubtedly take the larger market share. This support around the ethics of supply chains, therefore, opens the gates for large strategic investments as well as green investment funding and partnerships.
Challenge: Regulatory Complexity Across Global Markets
The cocoa and chocolate industry continues to face crucial regulatory challenges in terms of complying with ever-changing food safety and labeling regulations and standards. Now that international trade is on an upward trajectory, organizations find it increasingly difficult to maneuver through arduous and convoluted regional standards as to what additives are allowed in their environmental claims, allergens, and other related issues. In February 2025, under the Green Claims Directive, the European Union proposed stricter labeling standards, requiring environmentally coherent claims for scientifically proven evidence for any claims made on food packaging. The very same month saw updated traceability rules under FSMA 204 from the U.S. FDA coming into effect, which expand documentation and digital recordkeeping requirements as well. These regulatory changes are adding to the burden, especially for exporters who deal with multi-country portfolios. Beyond it lie conflicting regional policies on GMO ingredients, minimum declared content for cocoa, and the allowable language of claims, all of which add to the compliance risk. For smaller companies, with a minuscule legal and regulatory infrastructure, compliance risk would even equate to delayed access to the markets and high costs of compliance. So, as far as global regulations are being scrutinized, companies are under pressure to develop an agile compliance system that includes legal audits and regional expertise to stay competitive and above the law.
Cocoa and Chocolate Market: COMMERCIAL USE CASES ACROSS INDUSTRIES
| COMPANY | USE CASE DESCRIPTION | BENEFITS |
|---|---|---|
|
|
Development of premium dark and organic chocolate ranges, along with cocoa-based functional beverages. | Expands product portfolio, captures health-conscious consumer base, strengthens position in premium and wellness categories. |
 |
Supply of sustainable cocoa ingredients (butter, powder, liquor) to confectionery, bakery, and beverage industries. | Enhances B2B partnerships, ensures traceable supply, supports demand for sustainable and certified cocoa. |
 |
Introduction of cocoa-flavanol-enriched products for nutraceutical and functional food applications. | Diversifies beyond indulgence, leverages health positioning, creates new revenue streams. |
 |
Implementation of traceable cocoa sourcing systems with digital platforms for farmer-to-market transparency. | Builds consumer trust, ensures ethical sourcing, strengthens compliance with global sustainability standards. |
Logos and trademarks shown above are the property of their respective owners. Their use here is for informational and illustrative purposes only.
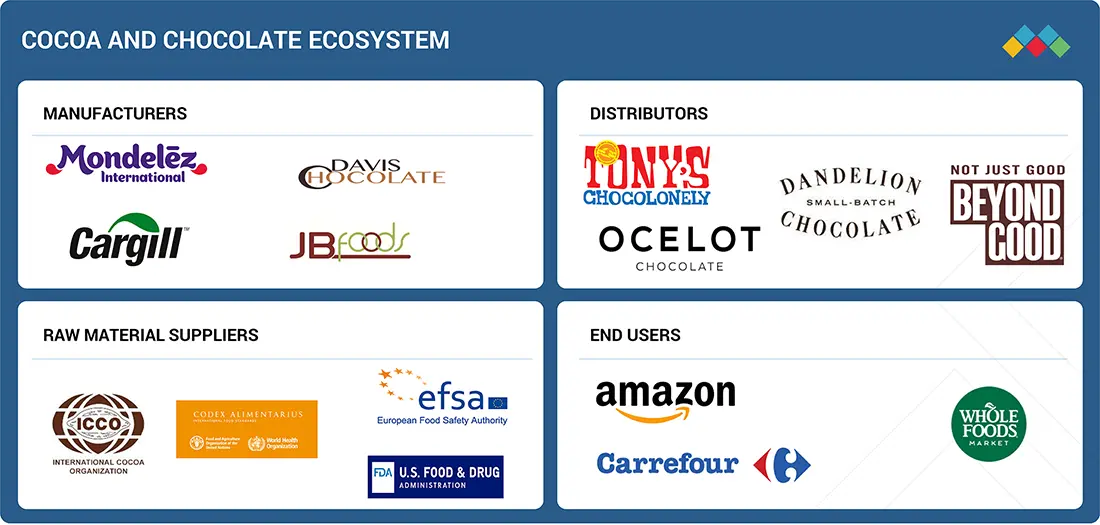
MARKET ECOSYSTEM
The cocoa and chocolate value chain immerses a large number of players spanning from the established giants down to, of course, the newest breed of innovators. Global giants include Mondelez International, Cargill, JB Foods, and Davis Chocolate, working on an integrated sourcing, processing, and distribution model on a large scale. At the same time, smaller firms and emerging companies that include Tony’s Chocolonely, Beyond Good, Ocelot Chocolate, and Dandelion Chocolate offer prominence through ethical sourcing, bean-to-bar transparency, and craft appeal. Regulatory authorities and associations, including the International Cocoa Organization (ICCO), the European Food Safety Authority (EFSA), and the US FDA, ensure quality, safety, and sustainability in the cocoa value chain. The role of distribution is played by retail store chains, both online and offline, such as Amazon, Walmart, Carrefour, and Whole Foods Market, to ensure consumer accessibility. Putting these together constructs a dynamic market landscape bearing significant innovation, compliance with regulations, and growing ends of consumer reach.
Logos and trademarks shown above are the property of their respective owners. Their use here is for informational and illustrative purposes only.
MARKET SEGMENTS
Source: Secondary Research, Interviews with Experts, MarketsandMarkets Analysis
By Cocoa Type (Butter, Powder, Liquor)
The cocoa market is categorized into butter, powder, and liquor. Cocoa butter is widely used in chocolate, confectionery, and cosmetics for its smooth texture, stability, and moisturizing properties. Cocoa powder is essential in bakery, dairy, and beverages, providing flavor and color. Cocoa liquor serves as the base ingredient for chocolate manufacturing, particularly in premium segments. Each type has a distinct role across industries, with growing demand for high-quality, sustainably sourced variants to meet consumer expectations in both food and non-food applications.
By Chocolate Type (Dark, Milk, White, Filled)
Chocolate types include dark, milk, white, and filled varieties. Dark chocolate is gaining momentum for its high cocoa content and health benefits, particularly flavanols linked to heart health. Milk chocolate dominates mass consumption due to its sweetness and affordability. White chocolate caters to niche indulgence segments with its creamy profile, while filled chocolates are increasingly popular in seasonal gifting, premium assortments, and festive demand. Innovations in flavors, fillings, and reduced-sugar formulations are expanding the appeal of each type globally.
By Nature (Conventional, Organic)
Cocoa is available in conventional and organic forms. Conventional cocoa dominates due to wider availability and lower cost, making it the choice for mainstream chocolate production. However, organic cocoa is growing rapidly, especially in developed regions, driven by consumer preference for pesticide-free and clean-label products. Certifications like Fairtrade and Rainforest Alliance are increasingly important, influencing sourcing practices and shaping the global supply chain. Organic cocoa is also favored in premium segments, where ethical and sustainable sourcing is a major differentiator for brand positioning.
By Application (Confectionery, Food & Beverage, Cosmetics, Nutraceuticals)
Cocoa has diverse applications. Confectionery remains the largest, driven by chocolate bars, pralines, and seasonal sales. In food & beverages, cocoa is used in bakery fillings, dairy, and ready-to-drink chocolate beverages. Cosmetics utilize cocoa butter in skincare and haircare for its moisturizing and antioxidant properties. Nutraceuticals are an emerging segment, using cocoa flavanols in supplements for cardiovascular and cognitive health. The expansion across these applications highlights cocoa’s versatility, supporting both indulgence and wellness-focused consumer trends.
By Product Form (Bars, Powder, Cocoa Butter Products, Supplements)
Cocoa products appear in multiple forms, including chocolate bars, cocoa powder drinks, butter-based products, and supplements. Chocolate bars dominate due to mainstream and premium consumption, while cocoa powder is widely used in bakery, dairy, and beverages. Cocoa butter remains critical in chocolates and cosmetics, delivering smooth texture and hydration. Supplements and functional foods enriched with cocoa extracts are emerging strongly, aligning with health-conscious consumer demand. Innovation in sugar reduction, vegan options, and functional ingredients is further diversifying product forms globally.
By Distribution Channel (Offline, E-commerce)
Cocoa and chocolate products are distributed through offline and online channels. Offline retail—including supermarkets, hypermarkets, and specialty stores—remains dominant, driven by impulse purchases and festive sales. Seasonal occasions such as Easter, Valentine’s Day, and Christmas significantly boost offline demand. E-commerce is rapidly expanding due to its convenience, wider product assortments, and direct-to-consumer models. Online platforms particularly benefit premium and artisanal chocolate brands, offering global reach and access to niche customer bases. Digital channels are expected to grow fastest, reshaping distribution strategies worldwide.
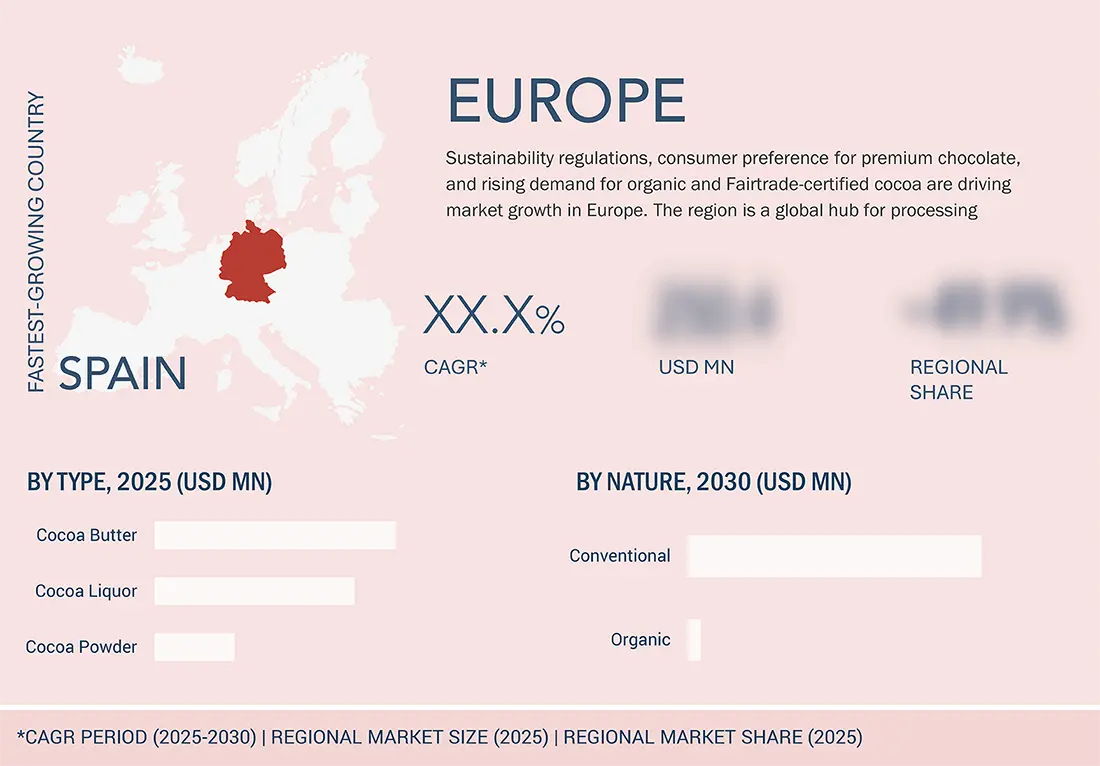
By Region (Europe, North America, Asia Pacific, Latin America, Middle East & Africa)
Regionally, Europe dominates the cocoa market with its established processing hubs in the Netherlands, Germany, and Belgium, and high chocolate consumption rates. North America remains mature but emphasizes premium and innovative products. Asia Pacific is the fastest-growing region, fueled by rising incomes and urbanization in China, India, and Japan. Latin America is recognized for fine-flavor cocoa exports, especially from Ecuador and Peru. Africa remains the largest cocoa producer, with the Ivory Coast and Ghana contributing the majority of the global bean supply. Each region shows distinct consumption and supply dynamics.
REGION
North America is estimated to lead the market during the forecast period
North America is expected to maintain its dominant position in the cocoa and chocolate market during the forecast period, as strong consumer demand exists for premium, organic, and functional chocolate products. The US especially sees sustained consumption throughout multiple formats-from traditional confections to fortified snacks and beverages enriched with cocoa derivatives. In April 2025, Hershey's expanded its premium chocolate range with the brand Hershey's OAT Made, which uses plant-based ingredients to satisfy the growing demand for dairy-free forms. Meanwhile, Mars, Incorporated, also unveiled a fresh sustainability plan that guarantees that cocoa will be 100% responsibly sourced for all its North American operations by 2025. This way, innovation and ethical sourcing have emerged as dual pillars in the region. In addition, the rise of e-commerce sites and online retail channels on Amazon, Walmart.com, and others has enabled niche and artisanal brands to achieve speedier product reach and visibility. Consumers seek healthfulness, sustainability, and indulgence, backing products such as dark chocolate, low-sugar, and clean-label. Having been home to established market players, strong distribution networks, and increased investments into product differentiation, North America is at the forefront of growth in the global cocoa and chocolate market.
Cocoa and Chocolate Market: COMPANY EVALUATION MATRIX
The cocoa and chocolate market is characterized by the presence of multinational corporations alongside regional players, each contributing to value chain integration and innovation. Barry Callebaut, Cargill, and Olam International dominate as leading suppliers and processors, leveraging extensive sourcing networks, processing capacity, and sustainability programs. Their strategies focus on vertical integration, farmer support initiatives, and expanding certified cocoa offerings to meet evolving consumer and regulatory demands. Nestlé, Mondelez, Mars, Ferrero, and Hershey hold significant downstream market shares, emphasizing product innovation, premiumization, and ethical sourcing to enhance brand equity. Regional manufacturers such as Guan Chong Berhad (Malaysia) and Blommer (US) play vital roles in specific geographies, strengthening supply diversity. Competitive differentiation is increasingly driven by sustainability commitments, traceability platforms, and expansion into high-growth regions, particularly Asia Pacific. As consumers shift toward premium, organic, and functional cocoa products, companies are aligning portfolios and partnerships to capture emerging opportunities while mitigating risks from volatile bean prices and regulatory pressures.
Source: Secondary Research, Interviews with Experts, MarketsandMarkets Analysis
KEY MARKET PLAYERS
- Cargill (US)
- KRÜGER (Germany)
- Sierra Naturals (US)
- Barry Callebaut (Switzerland)
- Olam (Singapore)
- Guan Chong Berhad (Malaysia)
- JB Foods (Singapore)
- ECOM Agroindustrial Corp. (Switzerland)
- Fuji Oil (Japan)
- United Cocoa Processor (UCP) (US)
- Natra (Spain)
- Max Felchlin AG (Switzerland)
- Luker Chocolate (Colombia)
- Cocoa Family (Dominican Republic)
- Puratos (Belgium)
- Del Republica (Dominican Republic)
- Valrhona (France)
- Jindal Cocoa (India)
- Davis Chocolate (US)
- Campco Chocolates (India)
- GENCAU.BR (Brazil)
MARKET SCOPE
| REPORT METRIC | DETAILS |
|---|---|
| Market Size Value in 2025 | USD 28.73 Billion |
| Market Forecast in 2030 | USD 33.89 Billion |
| Growth Rate | CAGR of 3.4% during 2025-2030 |
| Years Considered | 2020–2030 |
| Base Year | 2024 |
| Forecast Period | 2025–2030 |
| Units Considered | Value (USD Million) |
| Report Coverage | Revenue forecast, company ranking, competitive landscape, growth factors, and trends |
| Segments Covered | By Cocoa Type: Cocoa Butter, Cocoa Powder, Cocoa Liquor |
| Regions Covered | North America, Europe, Asia Pacific, South America, and Rest of the World (RoW) |
WHAT IS IN IT FOR YOU: Cocoa and Chocolate Market REPORT CONTENT GUIDE
DELIVERED CUSTOMIZATIONS
We have successfully delivered the following deep-dive customizations:
| CLIENT REQUEST | CUSTOMIZATION DELIVERED | VALUE ADDS |
|---|---|---|
| APAC-based Cocoa Manufacturers | Detailed company profiles of cocoa competitors (financials, product portfolio, sourcing practices) | Identified & profiled 20+ regional cocoa processors and manufacturers |
| Chocolate & Cocoa Product Manufacturers | Segmentation of demand by product type (bars, powder, liquor, butter) | Revealed revenue migration from conventional to premium and certified cocoa |
| Cocoa Traders & Distributors | Mapping cocoa bean sourcing networks across West Africa, Latin America, and Asia | Secured reliable sourcing networks for certified cocoa supply |
RECENT DEVELOPMENTS
- Oct 2024 : Cargill launched a new cocoa production line at its Gresik, Indonesia, facility to meet rising demand in Asia. The expansion supports innovation in cocoa powders and liquors, with customised flavour profiles, aligned with its 'Asia for Asia' strategy. The facility also houses the Cargill Cocoa Development Centre.
- Apr 2024 : Cargill partnered with Voyage Foods to scale sustainable cocoa-free confectionery and nut-free spreads. Cargill will be the exclusive global B2B distributor for Voyage Foods, expanding its chocolate portfolio with vegan, allergen-free, and sustainable alternatives for the bakery, ice cream, and confectionery sectors.
- Oct 2024 : GCB signed an MoU to acquire a 25% stake in Transcao Côte d'Ivoire, boosting its local presence. This move follows GCB’s existing grinding plant in Côte d'Ivoire and supports the country's strategy to process at least 50% of its cocoa domestically.
- May 2023 : A 100% plant-based, dairy-free chocolate with creamy milk-like taste, made without additives or artificial colors. Designed for chocolate lovers seeking indulgence with lower environmental impact.
Table of Contents
 Exclusive indicates content/data unique to MarketsandMarkets and not available with any competitors.
Methodology
The study involved two major approaches in estimating the current size of the cocoa and chocolate market. Exhaustive secondary research was done to collect information on the market, peer, and parent markets. The next step was to validate these findings, assumptions, and sizing with industry experts across the value chain through primary research. Both top-down and bottom-up approaches were employed to estimate the complete market size. After that, market breakdown and data triangulation were used to estimate the market size of segments and subsegments.
Secondary Research
This research study involved the extensive use of secondary sources—directories and databases such as Bloomberg Businessweek and Factiva—to identify and collect information useful for a technical, market-oriented, and commercial study of the market.
In the secondary research process, various sources, such as company annual reports, press releases, investor presentations, white papers, food journals, certified publications, articles from recognized authors, directories, and databases, were used to identify and collect information.
Secondary research was mainly used to obtain key information about the industry’s supply chain, the total pool of key players, and market classification and segmentation as per the industry trends to the bottom-most level, regional markets, and key developments from both market- and technology-oriented perspectives.
Primary Research
Extensive primary research was conducted after obtaining information regarding the cocoa and chocolate market scenario through secondary research. Several primary interviews were conducted with market experts from both the demand and supply sides across major countries of North America, Europe, Asia Pacific, South America, and the Rest of the World. Primary data was collected through questionnaires, emails, and telephonic interviews. The primary sources from the supply side included various industry experts, such as Chief X Officers (CXOs), Vice Presidents (VPs), Directors from business development, marketing, research, and development teams, and key opinion leaders. Primary interviews were conducted to gather insights such as market statistics, data on revenue collected from the products and services, market breakdowns, market size estimations, market forecasting, and data triangulation. Primary research also helped in understanding the various trends related to cocoa and chocolate, cocoa type, application, nature, chocolate type, distribution channel, product form, and region. Stakeholders from the demand side, such as research institutions and universities, third-party vendors, were interviewed to understand the buyer’s perspective on the product, their current usage of cocoa and chocolate, and the outlook of their business, which will affect the overall market.

Note: The three tiers of the companies are defined based on their total revenues in 2023 or 2024, as per the
availability of financial data: Tier 1: Revenue >USD 1 billion; Tier 2: USD 100 million = Revenue = USD 1 billion; Tier 3: Revenue
To know about the assumptions considered for the study, download the pdf brochure
|
COMPANY |
DESIGNATION |
|
Barry Callebaut (Switzerland) |
Global Sourcing Manager |
|
Cargill (US) |
R&D Scientist |
|
Mars, Incorporated (US) |
Marketing Director |
|
Mondelez International (US) |
Product Development Lead |
|
Lindt & Sprüngli (Switzerland) |
Sustainability Manager |
Market Size Estimation
Both the top-down and bottom-up approaches were used to estimate and validate the total size of the cocoa and chocolate market. These approaches were also used extensively to determine the size of various subsegments in the market. The research methodology used to estimate the market size includes the following details:
- The key players in the industry and the overall markets were identified through extensive secondary research.
- All shares, splits, and breakdowns were determined using secondary sources and verified through primary sources.
- All possible parameters that affect the market covered in this research study were accounted for, viewed in extensive detail, verified through primary research, and analyzed to obtain final quantitative and qualitative data.
- The research included the study of reports, reviews, and newsletters of top market players, along with extensive interviews for opinions from leaders, such as CEOs, directors, and marketing executives.
Cocoa and Chocolate Market : Top-Down and Bottom-Up Approach

Data Triangulation
After arriving at the overall market size from the estimation process explained above, the total market was split into several segments and subsegments. The data triangulation and market breakdown procedures were employed, wherever applicable, to estimate the overall cocoa and chocolate market and arrive at the exact statistics for all segments and subsegments. The data was triangulated by studying various factors and trends from the demand and supply sides. The market size was also validated using both the top-down and bottom-up approaches.
Market Definition
Cocoa is a product of cocoa tree seeds, which originated in the Latin American region but is heavily grown in Africa. Cocoa beans are used in the manufacturing of various products, including cocoa liquor, cocoa butter, and cocoa powder.
According to the Food Safety and Standards (Food Products Standards and Food Additives) Regulations 2011, chocolate is defined as a “homogeneous product which is produced from an appropriate process of manufacture from a mixture of one or more of the ingredients, such as cocoa beans, cocoa nib, cocoa press cake, and cocoa dust (cocoa fine/powder), cocoa mass, including defatted cocoa powder with or without the addition of sugars, cocoa butter, and milk solids including milk fat.
Stakeholders
Farmers & Primary Producers
- Smallholder farmers (the main source of the global cocoa supply)
- Farmer cooperatives and associations
- Local buying agents and aggregators
Input & Support Providers
- Agri-input suppliers (fertilizers, seedlings, crop protection)
- Training and extension service providers
- Microfinance and agri-credit institutions
Cocoa Traders & Exporters
- International trading firms (e.g., Olam, Ecom, Sucden)
- National cocoa marketing boards (e.g., COCOBOD – Ghana, CCC – Côte d’Ivoire)
- Licensed local exporters
Processors & Manufacturers
- Cocoa grinders (e.g., Barry Callebaut, Cargill)
- Chocolate manufacturers (e.g., Mars, Nestlé, Ferrero, Mondelez)
- Ingredient suppliers (e.g., cocoa butter, powder, liquor processors)
Retailers & Distributors
- Supermarkets and hypermarkets (e.g., Carrefour, Tesco, Walmart)
- Specialty chocolate retailers and boutiques
- Online direct-to-consumer (DTC) platforms
Certification & Compliance Bodies
- Sustainability certification organizations (e.g., Fairtrade, Rainforest Alliance)
- Traceability solution providers (e.g., SourceMap, Farmforce)
- National and international regulatory authorities (e.g., FDA, EFSA, EU Deforestation Regulation bodies)
Logistics & Infrastructure Providers
- Storage and warehousing operators
- Port handlers and transport companies
- Cold chain and packaging service providers
Research & Development Stakeholders
- Agricultural R&D institutions (e.g., CIRAD, ICCO, national cocoa research institutes)
- Food innovation labs and universities
- Gen AI developers and AI solution partners
NGOs & Development Organizations
- Non-profits working on farmer welfare, child labor prevention, and environmental protection (e.g., IDH, Solidaridad, WCF)
- Donor agencies and multilateral development banks (e.g., IFC, GIZ, USAID)
Report Objectives
- To determine and project the size of the cocoa and chocolate market with respect to the cocoa type, application, nature, chocolate type, distribution channel, product form, and regions in terms of value over five years, ranging from 2025 to 2030
- To identify the attractive opportunities in the market by determining the largest and fastest-growing segments across regions
- To provide detailed information about the key factors influencing market growth (drivers, restraints, opportunities, and challenges)
- To analyze the opportunities in the market for stakeholders and provide details of the competitive landscape for market leaders
- To analyze the micro-markets with respect to individual growth trends, prospects, and their contribution to the total market
- To identify and profile the key players in the market
- To understand the competitive landscape and identify the major growth strategies adopted by players across the key regions.
Available Customizations
With the given market data, MarketsandMarkets offers customizations according to company-specific scientific needs.
The following customization options are available for the report:
Product Analysis
- Service Matrix, which gives a detailed comparison of the service portfolio of each company.
Geographic Analysis as per Feasibility
With the given market data, MarketsandMarkets offers customizations according to company-specific scientific needs.
- Further breakdown of the Rest of Europe cocoa and chocolate market into key countries.
- Further breakdown of the Rest of Asia Pacific cocoa and chocolate market into key countries.
- Further breakdown of the Rest of South America cocoa and chocolate market into key countries.
Company Information
- Detailed analyses and profiling of additional market players (up to five)
Key Questions Addressed by the Report
What is the current size of the cocoa and chocolate market?
The cocoa and chocolate market is estimated to be USD 28.74 billion in 2025 and is projected to reach USD 33.89 billion by 2030, at a CAGR of 3.4% from 2025 to 2030.
What is driving the growth of the cocoa and chocolate market?
The market is driven by the increasing demand for premium, dark, and organic chocolate, supported by health consciousness and ethical consumption trends. Product innovations such as low sugar, vegan, and functional variants are further moving the market among urban consumers. Continuous chocolate consumption across formats and demographics is flourishing, with rising disposable incomes in emerging economies and the expansion of digital retail.
Which region is projected to dominate the market during the forecast period?
North America is estimated to dominate the market because of the strong brand presence, advanced distribution networks, and the parallel nature of chocolate consumption in the region. Recent launches of plant-powered and ethically sourced chocolate lines by major players such as Hershey and Mars, coupled with North America being a reference for sustainability-focused digital retail and health-oriented innovations, strengthen its dominating market position.
Which cocoa type is expected to hold the largest market share?
Cocoa liquor is expected to dominate due to its primary use in chocolate manufacturing for dark and premium categories. Demand is further driven by the trend toward products with a higher cocoa content. Investments in origin-specific, sustainably sourced cocoa liquor by companies like Barry Callebaut are supporting the growth of artisanal and gourmet chocolate applications.
What application segment contributes the most to market revenue?
Food & beverages account for the largest revenue share as cocoa and chocolate are widely used in confectionery, bakery, and dairy items. Indulgence, clean labels, and functional foods are attracting consumer attention. The emerging product areas of protein snacks, flavored beverages, and frozen desserts will continue to provide new avenues for cocoa application in the food sector.
What are the key challenges faced by stakeholders in this market?
Cocoa prices are highly volatile, thereby affecting their cost forecasting; the other is the highly fragmented farm system of smallholders, which obstructs, among others, the consistent quality and supply. Evolving sustainability legislations, including the EU due diligence legislation, are yet another layer of added complexity. Traceability, increasing productivity at a farm level, and striking a balance between ethical sourcing and profitability are a few of the concerns faced by market participants.
Need a Tailored Report?
Customize this report to your needs
Get 10% FREE Customization
Customize This ReportPersonalize This Research
- Triangulate with your Own Data
- Get Data as per your Format and Definition
- Gain a Deeper Dive on a Specific Application, Geography, Customer or Competitor
- Any level of Personalization
Let Us Help You
- What are the Known and Unknown Adjacencies Impacting the Cocoa and Chocolate Market
- What will your New Revenue Sources be?
- Who will be your Top Customer; what will make them switch?
- Defend your Market Share or Win Competitors
- Get a Scorecard for Target Partners

Custom Market Research Services
We Will Customise The Research For You, In Case The Report Listed Above Does Not Meet With Your Requirements
Get 10% Free CustomisationTESTIMONIALS

Business Innovation Director
US Based Leading Agribusiness,
Food and Ingredients ManufacturerI highly appreciate the team's efficiency for a well conducted study that helped us clarify some blind spots in food and agricultural niche markets. Although compiling information for B2B markets is very difficult, the MnM team pulled out the task successfully. The quality of research, level of insights, and responsiveness of team were commendable.


Growth opportunities and latent adjacency in Cocoa and Chocolate Market