Confectionery Ingredients Market by Type (Cocoa & Chocolate, Dairy Ingredients, Hydrocolloids, Emulsifiers, Malts, Oils & Shortenings, Starches & Derivatives, Flavors), Application (Chocolate, Sugar Confectionery, Gums), Form - Global Forecast to 2021


The confectionery ingredients market is projected to reach USD 76.81 Billion by 2021, at a CAGR of 6.2% from 2016 to 2021. The objectives of the study are to define, segment, and measure the confectionery ingredients market with respect to its type, application, source, form, and key regional market. It also includes factors influencing the growth of the market, strategic analysis of the micro markets, analysis of the opportunities for stakeholders, details of the competitive landscape, and strategic profiling of the key players with respect to their market share and core competencies.
The years considered for the study are as follows:
- Base year – 2015
- Estimated year – 2016
- Projected year – 2021
- Forecast period – 2016 to 2021
This report includes estimations of market sizes for value (USD billion). Both, top-down and bottom-up approaches have been used to estimate and validate the size of the confectionery ingredients market and to estimate the size of various other dependent submarkets in the overall market. Key players in the market have been identified through secondary research (FAO, Bloomberg, Factiva, companies’ annual reports), and their market share in respective regions has been determined through primary and secondary research. All percentage shares, splits, and breakdowns have been determined using secondary sources and verified through primary sources.
To know about the assumptions considered for the study, download the pdf brochure
Market Ecosystem:
The various contributors involved in the value chain of Confectionery ingredients include Confectionery ingredients manufacturers such as Barry Callebaut (Switzerland), Olam International (Singapore), Cargill, Incorporated (U.S.), Archer Daniels Midland Company (U.S.), Ingredion Incorporated (U.S.), and E. I. du Pont de Nemours and Company (U.S.); government bodies & regulatory associations such as United States Department of Agriculture (USDA), FDA (Food and Drug Administration), FSSA (Food Safety and Standards Authority), EFSA (European Food Safety Authority); distributors such as Koninklijke DSM N.V. (Netherlands), Kerry Group plc (Ireland), and Tate & Lyle PLC (U.K.); and end uses such as chocolates, sugar confectionaries, gums, and other industries which include fillings , coatings , caramel, aerated confectionery , spreads, cereal bars.
Target Audience
- Confectionery ingredients manufacturers
- Confectionery ingredients suppliers
- Research institutions
- Government bodies
- Distributors
- End users (industries) (chocolate manufacturers, sugar confectioners, gum manufacturing)
“The study answers several questions for stakeholders, primarily which market segments to focus on in the next two to five years for prioritizing efforts and investments.”
Scope of the Report
On the basis of Type, the confectionery ingredients market has been segmented as follows:
- Cocoa & chocolate
- Dairy ingredients
- Hydrocolloids
- Emulsifiers
- Malts
- Oils & shortenings
- Starches & derivatives
- Sweeteners
- Flavors
- Others (food color additives & flavors, functional systems, fruits & vegetables)
On the basis of Application, the confectionery ingredients market has been segmented as follows:
- Chocolate
- Sugar confectionery
- Gum
- Others (fillings, coatings, caramel, aerated confectionery, spreads, and cereal bars)
On the basis of Source, the confectionery ingredients market has been segmented as follows:
- Synthetic
- Natural
On the basis of Form, the confectionery ingredients market has been segmented as follows:
- Dry
- Liquid
On the basis of Region, the confectionery ingredients market has been segmented as follows:
- North America
- Europe
- Asia-Pacific
- RoW
Available Customizations
With the given market data, MarketsandMarkets offers customizations according to the client-specific needs.
The following customization options are available for the report:
Product Analysis
- Product matrix, which gives a detailed comparison of the product portfolio of each company
Application Analysis
- Application analysis, which gives a detailed analysis of other applications of confectionery ingredients
Regional Analysis
- Further breakdown of the Rest of the World confectionery ingredients market into Middle Eastern countries
- Further breakdown of the Rest of Asia-Pacific confectionery ingredients market into other Asian countries
Company Information
- Detailed analysis and profiling of additional market players (up to five)
The market for confectionery ingredients is projected to reach USD 76.81 Billion by 2021, at a CAGR of 6.2% from 2016 to 2021. The confectionery ingredients market is driven by growing industrialization, large-scale adoption of confectionery ingredients for various applications in diverse industries including chocolate, sugar confectionery, gums, and other industries such as fillings, coatings, caramel, aerated confectionery, spreads, and cereal bars. Also, owing to the factors such as changing consumer lifestyles, R&D and innovations to strengthen the confectionery ingredients market, increasing demand for natural ingredients due to increasing consumer awareness, and health benefits of chocolates result in the growth of the confectionery ingredients market.
The confectionery ingredients market has been segmented on the basis of type into cocoa & chocolate, dairy ingredients, hydrocolloids, emulsifiers, malts, oils & shortenings, starches & derivatives, sweeteners, flavors, and others, which include food color additives & flavors, functional systems and fruits & vegetables. The cocoa & chocolate segment dominated the confectionery ingredients market, owing to the increasing producers’ demand as it is commercially viable, abundant demand for chocolate, diverse application dimensions not only in confectionery but also in baking industry and development of food technology and food processing.
Based on application, the confectionery ingredients market has been segmented into chocolate, sugar confectionery, gums, and other applications such as fillings, coatings, caramel, aerated confectionery, spreads, and cereal bars. The chocolate segment dominated the confectionery ingredients market as there is an abundant demand for chocolates, owing to the health benefits attached to it, changing lifestyles coupled with evolving eating habits, consumers’ preference for convenience food and high purchasing power of consumers.
Based on source, the confectionery ingredients market has been segmented into natural and synthetic. The synthetic segment dominated the confectionery ingredients market due to confectionery ingredients manufacturers’ reliance on this source, owing to its functional benefits and the cost efficiencies involved.
The market has also been segmented on the basis of form into dry and liquid. The dry form dominated the confectionery ingredients market due to its functional benefits and operational efficiencies attached to it. It is also projected to grow at the highest CAGR from 2016 to 2021.
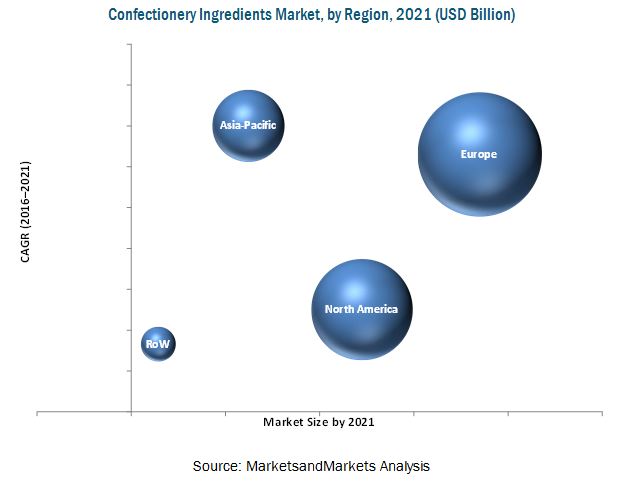
On the basis of region, the confectionery ingredients market has been segmented into North America, Europe, Asia-Pacific, Latin America, and the Rest of the World (RoW). Europe dominated the global confectionery ingredients market due to the developed industries in this region. Asia-Pacific is projected to be the fastest-growing region due to the continuous increase in demand for confectionery ingredients, owing to the suitable climate and operational benefits from confectionery ingredients, along with increase in disposable income, grow in purchasing power and industrialization especially in countries such as China and India. Ease of doing business, and broad application spectrum are also some of the prominent factors that are driving the demand for confectionery ingredients in the Asia-Pacific economies.
Adherence to the international quality standards and regulations for confectionery ingredient products, volatile cocoa prices, and ambiguity over the consumption of trans-fatty acids & health issues related to it are the factors which restrain the market.
The confectionery ingredients market is fragmented and competitive, with a large number of players operating at regional and local levels. The key players in the market adopted expansions and investments as their preferred growth strategies. Key players in this market include Cargill, Incorporated (U.S.), Archer Daniels Midland Company (U.S.), Olam International (Singapore), Barry Callebaut (Switzerland), E. I. du Pont de Nemours and Company (U.S.), Koninklijke DSM N.V. (Netherlands), and Kerry Group plc (Ireland). Other players such as Arla Foods (Denmark), Tate & Lyle PLC (U.K.), Ingredion Incorporated (U.S.), and AarhusKarlshamn (Sweden) also have a strong presence in the global confectionery ingredients market.
To speak to our analyst for a discussion on the above findings, click Speak to Analyst
 Exclusive indicates content/data unique to MarketsandMarkets and not available with any competitors.
Table of Contents
1 Introduction (Page No. - 16)
1.1 Objectives of the Study
1.2 Market Definition
1.3 Study Scope
1.3.1 Periodization Considered
1.4 Currency Considered
1.5 Units Considered
1.6 Stakeholders
1.7 Limitations
2 Research Methodology (Page No. - 20)
2.1 Research Data
2.2 Market Share Estimation
2.2.1 Secondary Data
2.2.1.1 Key Data From Secondary Sources
2.2.2 Primary Data
2.2.2.1 Key Data From Primary Sources
2.2.2.2 Key Industry Insights
2.2.2.3 Breakdown of Primaries
2.3 Factor Analysis
2.3.1 Introduction
2.3.2 Demand-Side Analysis
2.3.2.1 Developing Economies and Per Capita Consumption of Confectionery
2.3.2.2 Growing Middle-Class Population
2.3.3 Supply-Side Analysis
2.3.3.1 Raw Material Suppliers: Cocoa Producers
2.4 Market Size Estimation
2.5 Market Breakdown & Data Triangulation
2.5.1 Assumptions
2.5.2 Limitations
3 Executive Summary (Page No. - 34)
3.1 Overview of the Confectionery Ingredients Market
4 Premium Insights (Page No. - 39)
4.1 Attractive Opportunities in the Confectionery Ingredients Market
4.2 Asia-Pacific Region Shows Promising Growth for the Confectionery Ingredients Market Until 2021
4.3 Europe Held Largest Share in the Confectionery Ingredients Market (KT)
4.4 Asia-Pacific Economies Such as India and China Projected to Grow at the Highest CAGR; U.S. Market for Confectionery Ingredients to Remain Dominant (USD Million)
4.5 Europe Dominated the Confectionery Ingredients Market Across All Types of Ingredients in 2015, in Terms of Volume
4.6 Confectionery Ingredients Market Attractiveness Across Regions
4.7 Product Life Cycle
4.8 Year on Year Growth Outlook
5 Market Overview (Page No. - 46)
5.1 Introduction
5.2 Market Segmentation
5.3 Market Dynamics
5.3.1 Drivers
5.3.1.1 Changing Consumer Lifestyles
5.3.1.2 Health Benefits of Chocolates
5.3.1.3 Large Number of Confectionery Applications
5.3.1.4 R&D and Innovations to Strengthen the Confectionery Ingredients Market
5.3.1.5 Increasing Demand for Natural Ingredients Due to Increasing Consumer Awareness
5.3.2 Restraints
5.3.2.1 Adherence to International Quality Standards and Regulations for Confectionery Ingredient Products
5.3.2.2 Volatile Cocoa Prices
5.3.2.3 Ambiguity Over the Consumption of Trans-Fatty Acids and Its Related Health Issues
5.3.3 Opportunities
5.3.3.1 Emerging Applications of Confectionery Ingredient
5.3.3.2 Product Innovation to Reflect Changes in Consumer Behavior
5.3.3.3 Increasing Consumption of Confectionery Goods in Developed and Developing Countries
5.3.3.4 Seasonal and Festive Related Demand
5.3.4 Challenges
5.3.4.1 Growing Substitution of Confectionery Goods
5.3.4.2 Consumer Perception Towards ‘Chocolate-Flavored Products’ and Chocolate Products
5.3.4.3 Demand for Clean Label Products From Consumers
6 Industry Trends (Page No. - 54)
6.1 Introduction
6.2 Value Chain Analysis
6.3 Supply Chain Analysis
6.3.1 Prominent Companies
6.3.2 Small & Medium Enterprises
6.3.3 End Users (Chocolate Manufacturers/Confectioners/Food Industry/Retail Customers/Governments/Researchers)
6.4 Industry Trends
6.5 Porter’s Five Forces Analysis
6.5.1 Threat of New Entrants
6.5.2 Threat of Substitutes
6.5.3 Bargaining Power of Suppliers
6.5.4 Bargaining Power of Buyers
6.5.5 Intensity of Competitive Rivalry
7 Confectionery Ingredients Market, By Type (Page No. - 62)
7.1 Introduction
7.2 Cocoa & Chocolate
7.3 Dairy Ingredients
7.4 Hydrocolloids
7.5 Emulsifiers
7.6 Malts
7.7 Oils & Shortenings
7.8 Starch & Derivatives
7.9 Sweeteners
7.10 Flavors
7.11 Others
8 Confectionery Ingredients Market, By Source (Page No. - 81)
8.1 Introduction
8.2 Synthetic
8.3 Natural
9 Confectionery Ingredients Market, By Form (Page No. - 88)
9.1 Introduction
9.2 Dry Form
9.3 Liquid Form
10 Confectionery Ingredients Market, By Application (Page No. - 94)
10.1 Introduction
10.2 Chocolate
10.3 Sugar Confectionery
10.4 Gum
10.5 Others
11 Confectionery Ingredients Market, By Region (Page No. - 104)
11.1 Introduction
11.2 North America
11.2.1 U.S.
11.2.2 Canada
11.2.3 Mexico
11.3 Europe
11.3.1 U.K.
11.3.2 France
11.3.3 Germany
11.3.4 Italy
11.3.5 Spain
11.3.6 Rest of Europe
11.4 Asia-Pacific
11.4.1 China
11.4.2 India
11.4.3 Australia
11.4.4 Japan
11.4.5 Rest of Asia Pacific
11.5 Rest of the World (RoW)
11.5.1 Brazil
11.5.2 Argentina
11.5.3 Chile
11.5.4 Middle East
11.5.5 Africa
12 Confectionery Ingredients Market, Branding Overview (Page No. - 135)
12.1 Introduction
12.1.1 Cornsweet
12.1.2 Novalipid
12.1.3 Coroli
12.1.4 Jeltec
12.1.5 Fibersol-2
12.1.6 Choc-A-Like
12.1.7 Kerrylac;
12.1.8 Resistamyl
12.1.9 Elastigel
12.1.10 Tasteva
13 Competitive Landscape (Page No. - 137)
13.1 Overview
13.2 Competitive Situation & Trends
13.3 Expansions & Investments
13.4 Acquisitions
13.5 New Product Launches
13.6 Collaborations, Agreements, Joint Ventures & Partnerships
14 Company Profiles (Page No. - 144)
(Company at A Glance, Business Overview, Products Offered, Key Strategy, Recent Developments, SWOT Analysis & MnM View)*
14.1 Introduction
14.1.1 Geographic Revenue Mix
14.2 Cargill, Incorporated
14.3 Archer Daniels Midland Company
14.4 Olam International Ltd.
14.5 Barry Callebaut
14.6 E. I. Du Pont De Nemours and Company
14.7 Koninklijke DSM N.V.
14.8 Kerry Group PLC
14.9 Arla Foods
14.10 Tate & Lyle PLC
14.11 Ingredion Incorporated
14.12 Aarhuskarlshamn (AAK)
*Details on Company at A Glance, Recent Financials, Products Offered, Strategies & Insights, & Recent Developments Might Not Be Captured in Case of Unlisted Companies.
15 Appendix (Page No. - 185)
15.1 Discussion Guide
15.2 Knowledge Store: Marketsandmarkets’ Subscription Portal
15.3 More Company Developments
15.3.1 Expansions & Investments
15.3.2 Acquisitions
15.3.3 New Product Launches
15.3.4 Collaborations, Agreements, Joint Ventures & Partnerships
15.4 Introducing RT: Real Time Market Intelligence
15.5 Available Customizations
15.6 Related Reports
List of Tables (95 Tables)
Table 1 Healthy Food Product Consumption, By Attribute & Region in 2014
Table 2 Confectionery Ingredients Market Size, By Type, 2014-2021 (USD Million)
Table 3 Market Size For Confectionery Ingredients, By Type, 2014-2021 (KT)
Table 4 Cocoa & Chocolate Market Size, By Region, 2014-2021 (USD Million )
Table 5 Cocoa & Chocolate Market Size, By Region, 2014-2021 (KT)
Table 6 Dairy Ingredients Market Size, By Region, 2014-2021 (USD Million)
Table 7 Dairy Ingredients Market Size, By Region, 2014-2021 (KT)
Table 8 Hydrocolloids Market Size, By Region, 2014-2021 (USD Million)
Table 9 Hydrocolloids Market Size, By Region, 2014-2021 (KT)
Table 10 Emulsifiers Market Size, By Region, 2014-2021 (USD Million)
Table 11 Emulsifiers Market Size, By Region, 2014-2021 (KT)
Table 12 Malts Market Size, By Region, 2014-2021 (USD Million)
Table 13 Malts Market Size, By Region, 2014-2021 (KT)
Table 14 Oils & Shortenings Market Size, By Region, 2014-2021 (USD Million)
Table 15 Oils & Shortenings Market Size, By Region, 2014-2021 (KT)
Table 16 Starch & Derivatives Market Size, By Region, 2014-2021 (USD Million)
Table 17 Starch & Derivatives Market Size, By Region, 2014-2021 (KT)
Table 18 Sweeteners Market Size, By Region, 2014-2021 (USD Million)
Table 19 Sweeteners Market Size, By Region, 2014-2021 (KT)
Table 20 Flavors Market Size, By Region, 2014-2021 (USD Million)
Table 21 Flavors Market Size, By Region, 2014-2021 (KT)
Table 22 Other Confectionery Ingredients Market Size, By Region, 2014-2021 (USD Million)
Table 23 Other Confectionery Ingredients Market Size, By Region, 2014-2021 (KT)
Table 24 Market Size For Confectionery Ingredients, By Source, 2014–2021 (USD Million)
Table 25 Market Size For Confectionery Ingredients, By Source, 2016–2021 (KT)
Table 26 Market Size For Synthetic Confectionery Ingredients, By Region, 2014–2021 (USD Million)
Table 27 Market Size For Synthetic Confectionery Ingredients, By Region, 2014–2021 (KT)
Table 28 Market Size For Natural Confectionery Ingredients, By Region, 2014–2021 (USD Million)
Table 29 Market Size For Natural Confectionery Ingredients, By Region, 2014–2021 (KT)
Table 30 Market Size For Confectionery Ingredients, By Form, 2014–2021 (USD Million)
Table 31 Market Size For Confectionery Ingredients, By Form, 2014–2021 (KT)
Table 32 Market Size For Dry Confectionery Ingredients, By Region, 2014–2021 (USD Million)
Table 33 Market Size For Dry Confectionery Ingredients, By Region, 2014–2021 (KT)
Table 34 Liquid Form Market Size, By Region, 2014–2021 (USD Million)
Table 35 Market Size For Liquid Confectionery Ingredients, By Region, 2014–2021 (KT)
Table 36 Market Size For Confectionery Ingredients, By Application, 2014–2021 (USD Million)
Table 37 Market Size For Confectionery Ingredients, By Application, 2014–2021 (KT)
Table 38 Chocolate Confectionery Market Size, By Region, 2014–2021 (USD Million)
Table 39 Chocolate Confectionery Market Size, By Region, 2014–2021 (KT)
Table 40 Sugar Confectionery Market Size, By Region, 2014–2021 (USD Million)
Table 41 Sugar Confectionery Market Size, By Region, 2014–2021 (KT)
Table 42 Gum Market Size, By Region, 2014–2021 (USD Million)
Table 43 Gum Market Size, By Region, 2014–2021 (KT)
Table 44 Other Applications Market Size, By Region, 2014–2021 (USD Million)
Table 45 Other Applications Market Size, By Region, 2014–2021 (KT)
Table 46 Market Size For Confectionery Ingredients, By Region, 2014–2021 (USD Million)
Table 47 Confectionery Ingredients Market Size, By Region, 2014–2021 (KT)
Table 48 North America: Confectionery Ingredients Market Size, By Country, 2014–2021 (USD Million)
Table 49 North America: Market Size For Confectionery Ingredients, By Country, 2014–2021 (KT)
Table 50 North America: Market Size For Confectionery Ingredients, By Type, 2014–2021 (USD Million)
Table 51 North America: Market Size For Confectionery Ingredients, By Type, 2014–2021 (KT)
Table 52 North America: Market Size For Confectionery Ingredients, By Application, 2014–2021 (USD Million)
Table 53 North America: Market Size For Confectionery Ingredients, By Application, 2014–2021 (KT)
Table 54 North America: Market Size For Confectionery Ingredients, By Form, 2014–2021 (USD Million)
Table 55 North America: Market Size For Confectionery Ingredients, By Form, 2014–2021 (KT)
Table 56 North America: Market Size For Confectionery Ingredients, By Source, 2014–2021 (USD Million)
Table 57 North America: Confectionery Ingredients Market Size, By Source, 2014–2021 (KT)
Table 58 Europe: Confectionery Ingredients Market Size, By Country, 2014–2021 (USD Million)
Table 59 Europe: Market Size For Confectionery Ingredients, By Country, 2014–2021 (KT)
Table 60 Europe: Market Size For Confectionery Ingredients, By Type, 2014–2021 (USD Million)
Table 61 Europe: Market Size For Confectionery Ingredients, By Type, 2014-2021 (KT)
Table 62 Europe: Market Size For Confectionery Ingredients, By Application, 2014–2021 (USD Million)
Table 63 Europe: Market Size For Confectionery Ingredients, By Application, 2014–2021 (KT)
Table 64 Europe: Market Size For Confectionery Ingredients, By Form, 2014–2021 (USD Million)
Table 65 Europe: Market Size For Confectionery Ingredients, By Form, 2014–2021 (KT)
Table 66 Europe: Market Size For Confectionery Ingredients, By Source, 2014–2021 (USD Million)
Table 67 Europe: Confectionery Ingredients Market Size, By Source, 2014–2021 (KT)
Table 68 Asia-Pacific: Confectionery Ingredients Market Size, By Country, 2014–2021 (USD Million)
Table 69 Asia-Pacific: Market Size For Confectionery Ingredients, By Country, 2014–2021(KT)
Table 70 Asia-Pacific: Market Size For Confectionery Ingredients, By Type, 2014–2021 (USD Million)
Table 71 Asia-Pacific: Market Size For Confectionery Ingredients, By Type, 2014–2021 (KT)
Table 72 Asia-Pacific: Market Size For Confectionery Ingredients, By Application, 2014–2021 (USD Million)
Table 73 Asia-Pacific: Market Size For Confectionery Ingredients, By Application, 2014–2021 (KT)
Table 74 Asia-Pacific: Market Size For Confectionery Ingredients, By Source, 2014–2021(USD Million)
Table 75 Asia-Pacific: Market Size For Confectionery Ingredients, By Source, 2014–2021 (KT)
Table 76 Asia-Pacific: Market Size For Confectionery Ingredients, By Form, 2014–2021 (USD Million)
Table 77 Asia-Pacific: Confectionery Ingredients Market Size, By Form, 2014–2021(KT)
Table 78 RoW: Confectionery Ingredients Market Size, By Country/Region, 2014–2021 (USD Million)
Table 79 RoW: Market Size For Confectionery Ingredients, By Country/Region, 2014–2021 (KT)
Table 80 RoW: Market Size For Confectionery Ingredients, By Type, 2014-2021 (USD Million)
Table 81 RoW: Market Size For Confectionery Ingredients, By Type, 2014-2021 (KT)
Table 82 RoW: Market Size For Confectionery Ingredients, By Application, 2014-2021 (USD Million)
Table 83 RoW: Market Size For Confectionery Ingredients, By Application, 2014-2021 (KT)
Table 84 RoW: Market Size For Confectionery Ingredients, By Form, 2014-2021 (USD Million)
Table 85 RoW: Market Size For Confectionery Ingredients, By Form, 2014-2021 (KT)
Table 86 RoW: Market Size For Confectionery Ingredients, By Source, 2014-2021 (USD Million)
Table 87 RoW: Market Size For Confectionery Ingredients, By Source, 2014-2021 (KT)
Table 88 Expansions & Investments, 2010-2015
Table 89 Mergers & Acquisitions, 2010-2015
Table 90 New Product Launches, 2010–2016
Table 91 Collaborations, Agreements, Joint Ventures & Partnerships, 2010–2016
Table 92 Expansions & Investments, 2011–2016
Table 93 Acquisitions, 2011–2016
Table 94 New Product/Development Launches, 2011–2016
Table 95 Collaborations, Agreements, Joint Ventures & Partnerships , 2011–2016
List of Figures (79 Figures)
Figure 1 Confectionery Ingredients Market Segmentation
Figure 2 Confectionery Ingredients Market: Research Design
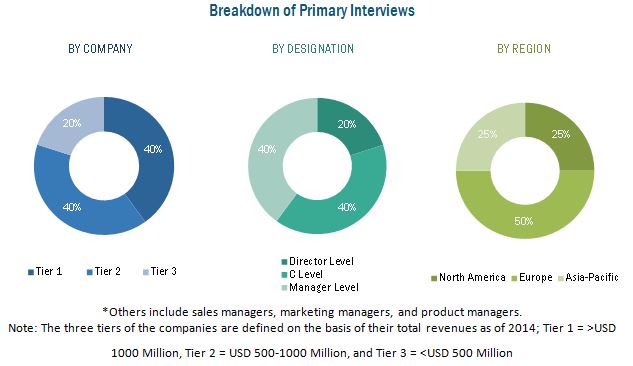
Figure 3 Breakdown of Primary Interviews: By Company Type, Designation, and Region
Figure 4 GDP (PPP) of Top Economies, 2015
Figure 5 Consumption of Confectionery (Kg Per Capita)
Figure 6 Middle-Class Population in the Asia-Pacific Region Projected to Account for the Largest Share in the Global Market By 2030
Figure 7 Market Size Estimation: Bottom-Up Approach
Figure 8 Market Size Estimation Methodology: Top-Down Approach
Figure 9 Market Breakdown & Data Triangulation
Figure 10 Confectionery Ingredients Market Growth Trend (2016 vs 2021)
Figure 11 Chocolate Confectionery Dominated the Market For Confectionery Ingredients, By Application
Figure 12 Asia-Pacific is Projected to Be the Fastest-Growing Market for Confectionery Ingredients From 2016 to 2021
Figure 13 Cocoa & Chocolate Segment to Dominate the Global Confectionery Ingredients Market, By Type, 2016–2021
Figure 14 Confectionery Ingredients Market, By Source, 2016 vs 2021 (USD Million)
Figure 15 Major Players Adopted Expansion & Investments as the Key Strategy From 2011 to 2016
Figure 16 Confectionery Ingredients: an Emerging Market With Promising Growth Potential, 2016–2021 (USD Million)
Figure 17 Asia-Pacific Projected to Grow at the Highest Rate From 2016 to 2021
Figure 18 The Cocoa & Chocolate Segment Accounted for the Largest Share in the European Market in 2015 (KT)
Figure 19 Indian Market is Projected to Grow at the Highest Rate From 2016 to 2021
Figure 20 Confectionery Ingredients Market Size, By Type , 2015 (KT)
Figure 21 Asia-Pacific Confectionery Ingredients Market to Grow at the Highest Rate From 2016 to 2021
Figure 22 Europe to Hit Maturity Phase in the Confectionery Ingredients Market
Figure 23 Europe & North America Market are Expected to Grow at A Decreasing Rate
Figure 24 Confectionery Ingredients Market Segmentation
Figure 25 Changing Lifestyles and Eating Habits Drive the Growth of the Confectionery Ingredients Market
Figure 26 Value Chain Analysis: Major Value is Added During Manufacturing & Material Sourcing
Figure 27 Supply Chain: Multi-Model Distribution System Followed By Prominent Players
Figure 28 New Product Launch is the Key Strategy for Industry Players
Figure 29 Porter’s Five Forces Analysis
Figure 30 Confectionery Ingredients Market Size for Cocoa & Chocolate, By Region, 2016 & 2021 (USD Million)
Figure 31 Confectionery Ingredients Market Size for Dairy Ingredients, By Region, 2016 & 2021 (USD Million)
Figure 32 Confectionery Ingredients Market Size for Hydrocolloids, By Region, 2016 & 2021 (USD Million)
Figure 33 Confectionery Ingredients Market Size for Emulsifiers, By Region, 2016 & 2021 (USD Million)
Figure 34 Confectionery Ingredients Market Size for Malts, By Region, 2016 & 2021 (USD Million)
Figure 35 Confectionery Ingredients Market Size for Oils & Shortenings, By Region, 2016 & 2021 (USD Million)
Figure 36 Confectionery Ingredients Market Size for Starch & Derivatives, By Region, 2016 & 2021 (USD Million)
Figure 37 Confectionery Ingredients Market Size for Sweeteners, By Region, 2016 & 2021 (USD Million)
Figure 38 Confectionery Ingredients Market Size for Flavors, By Region, 2016 & 2021 (USD Million)
Figure 39 Other Confectionery Ingredients Market Size, By Region, 2016 & 2021 (USD Million)
Figure 40 Market For Confectionery Ingredients, By Source
Figure 41 Synthetic Segment Projected to Account for the Higher Share in Terms of Value
Figure 42 Synthetic Confectionery Ingredients Market in Asia-Pacific is Projected to Grow at the Highest Rate From 2016 to 2021 in Terms of Value
Figure 43 Europe is Projected to Lead the Natural Segment of Confectionery Ingredients Market in Terms of Value
Figure 44 Rising Presence of Manufacturers in Natural Ingredients
Figure 45 Market For Confectionery Ingredients, By Form
Figure 46 Dry Form Segment Projected to Account for the Larger Share in Terms of Value Through 2021
Figure 47 Dry Confectionery Ingredients Market in Asia-Pacific is Projected to Grow at the Highest Rate From 2016 to 2021 in Terms of Value
Figure 48 Europe is Projected to Lead the Liquid Form of Confectionery Ingredients Through 2021
Figure 49 Market For Confectionery Ingredients, By Application
Figure 50 Chocolate Confectionery is Projected to Account for the Highest Share Through 2021 in Terms of Value
Figure 51 Europe is Projected to Dominate the Gums Market Through 2021 in Terms of Volume
Figure 52 Market For Confectionery Ingredients: Geographic Snapshot, 2016–2021
Figure 53 North America: Confectionery Ingredients Market Snapshot
Figure 54 Europe: Confectionery Ingredients Market, 2014–2021
Figure 55 Switzerland Had the Highest Per Capita Confectionery Consumption in 2015
Figure 56 Asia-Pacific: Market Size For Confectionery Ingredients, By Country, 2015-2021
Figure 57 Expansions & Investments: Current Approach of Leading Confectionery Ingredients Market Players
Figure 58 Portfolio Strengthening Through Developments
Figure 59 Share of Collaborations, Agreements, Joint Ventures & Partnerships in Total Developments
Figure 60 Expansions & Investments: the Key Growth Strategies, 2010–2016
Figure 61 Geographic Revenue Mix of Top Five Market Players
Figure 62 Cargill, Incorporated: Company Snapshot
Figure 63 Cargill, Incorporated: SWOT Analysis
Figure 64 Archer Daniels Midland Company: Company Snapshot
Figure 65 Archer Daniels Midland Company: SWOT Analysis
Figure 66 Olam International Ltd.: Company Snapshot
Figure 67 Olam International Ltd.: SWOT Analysis
Figure 68 Barry Callebaut: Company Snapshot
Figure 69 Barry Callebaut: SWOT Analysis
Figure 70 E.I. Du Pont De Nemours and Company: Company Snapshot
Figure 71 E. I Du Pont De Nemours and Company: SWOT Analysis
Figure 72 Koninklijke DSM N.V.: Company Snapshot
Figure 73 Koninklijke DSM N.V.: SWOT Analysis
Figure 74 Kerry Group PLC: Company Snapshot
Figure 75 Kerry Group PLC: SWOT Analysis
Figure 76 Arla Foods: Company Snapshot
Figure 77 Tate & Lyle PLC: Company Snapshot
Figure 78 Ingredion Incorporated: Company Snapshot
Figure 79 Aarhuskarlshamn : Company Snapshot


Growth opportunities and latent adjacency in Confectionery Ingredients Market