Computational Photography Market by Offering (Camera Modules, Software), Type (Single- and Dual-Lens, 16-Lens), Product (Smartphone Cameras, Standalone Cameras, Machine Vision Cameras), Application (3D Imaging, AR, VR, MR), Region - Global Forecast to 2024-2033


The global computational photography market was valued at USD 17.60 billion in 2024 and is estimated to reach USD 54.20 billion by 2033, at a CAGR of 13.4% between 2025 and 2033.
The growth of the computational photography market is driven by rapid advancements in artificial intelligence (AI) and machine learning (ML) that enhance image processing, low-light performance, and scene optimization in smartphones and digital cameras. Increasing consumer demand for high-quality imaging in compact devices, along with the proliferation of multi-camera setups and 3D sensing technologies, is further propelling market expansion. Additionally, applications in autonomous vehicles, augmented reality (AR), and surveillance are accelerating the adoption of computational photography across diverse sectors.

Computational photography refers to the use of advanced algorithms, artificial intelligence (AI), and machine learning (ML) techniques to enhance or extend the capabilities of digital imaging systems beyond traditional optical limitations. It combines software and hardware innovations to improve image quality, dynamic range, depth perception, and low-light performance. This technology enables features such as HDR imaging, portrait mode, night mode, and 3D imaging, transforming how cameras capture, process, and reproduce visual information.
Market by Offering
Camera modules
Camera modules dominates the computational photography market due to their widespread integration in smartphones, tablets, and consumer electronics. These modules combine advanced optics, sensors, and processing units, enabling AI-driven features such as HDR, portrait mode, and low-light enhancement. Their versatility, compact design, and ability to deliver high-quality imaging at scale make them a preferred choice for manufacturers, sustaining their market leadership. Strong consumer demand for enhanced photography experiences continues to drive the adoption of camera modules across multiple device categories.
Software
The software segment of the computational photography market is poised for rapid growth, driven by the increasing importance of AI and machine learning in image processing. Software solutions enable features such as scene recognition, noise reduction, depth mapping, and real-time enhancement without requiring extensive hardware upgrades. As devices become more connected and cloud-based processing gains traction, software-driven improvements will expand applications across smartphones, professional cameras, autonomous systems, and AR/VR, making it a critical growth driver for the market.
Market by Product
Smartphone cameras
Smartphone cameras hold the largest share of the computational photography market, fueled by the global proliferation of smartphones and consumer demand for high-quality imaging in compact devices. Integration of AI-powered features like night mode, portrait effects, and multi-lens processing enhances user experience and drives adoption. Manufacturers continuously innovate to differentiate their offerings with advanced computational photography capabilities, making smartphone cameras a dominant segment in the market and a key driver of overall growth across consumer electronics.
Machine vision cameras
Machine vision cameras are expected to register high growth in the computational photography market, driven by their increasing adoption in industrial automation, robotics, and quality inspection. These cameras leverage advanced algorithms and AI processing to capture precise, high-resolution images for real-time decision-making. The rise of smart manufacturing, autonomous systems, and industrial IoT applications is accelerating demand for machine vision solutions, making them a rapidly expanding segment with significant potential for innovation and market penetration.
Market by Geography
Geographically, the computational photography market is witnessing strong adoption across North America, Europe, Asia Pacific, and RoW. North America stands out as the largest and fastest-growing region, driven by rapid technological innovation, high smartphone penetration, and early integration of AI and machine learning in imaging systems. The presence of leading technology companies, robust R&D investments, and strong demand for premium imaging in smartphones, autonomous vehicles, and AR/VR applications further fuel growth. Europe follows with growing adoption in automotive and industrial imaging, while Asia Pacific shows significant potential due to the expanding consumer electronics and semiconductor manufacturing base. Meanwhile, the countries in RoW are gradually emerging, supported by increasing use of AI-powered imaging in smart city and surveillance projects.
Market Dynamics
Driver: Growing integration of AI and ML in smartphone camera systems
The integration of artificial intelligence (AI) and machine learning (ML) in smartphone cameras is a key driver for the computational photography market. These technologies enable intelligent scene detection, image segmentation, and real-time optimization, resulting in sharper, more vibrant, and detail-rich images. AI-powered features like portrait mode, night mode, and automatic white balance correction enhance user experience without manual adjustments. As smartphone manufacturers compete to deliver professional-grade photography in compact devices, AI-driven imaging continues to fuel innovation and widespread adoption of computational photography solutions.
Restraint: Complexity and cost of integrating advanced imaging algorithms
The implementation of advanced computational photography algorithms requires significant processing power, memory, and energy efficiency, leading to higher development costs. Integrating AI-based imaging capabilities demands specialized hardware, such as neural processing units (NPUs) and image signal processors (ISPs), which increase manufacturing expenses. Additionally, optimizing algorithms for diverse camera sensors and operating environments adds design complexity. Smaller manufacturers and mid-range device makers often face challenges in balancing cost efficiency with performance, limiting large-scale adoption and hindering market growth, especially in price-sensitive regions.
Opportunity: Integration with 3D imaging, LiDAR, and depth-sensing technologies
The integration of computational photography with 3D imaging, LiDAR, and depth-sensing technologies presents significant growth opportunities. These technologies enable advanced features such as depth mapping, object recognition, spatial awareness, and augmented reality (AR) imaging. Combining AI-driven image processing with precise 3D data enhances applications in smartphones, autonomous vehicles, robotics, and industrial inspection. This convergence allows for highly detailed spatial visualization and real-time environment mapping, driving innovation across consumer and professional imaging sectors and expanding the scope of computational photography beyond traditional photography.
Challenge: Balancing image quality improvements with real-time processing constraints
Achieving superior image quality while maintaining real-time processing speed remains a major challenge in computational photography. AI-based image enhancement techniques, such as noise reduction and HDR processing, require substantial computational resources, which can cause latency or overheating issues in compact devices. Balancing complex algorithmic processing with limited hardware capabilities, especially in mobile platforms, demands highly optimized software-hardware integration. Manufacturers face the ongoing challenge of ensuring instantaneous image capture and rendering without compromising accuracy or color fidelity, pushing the limits of system design and performance optimization.
Future Outlook
Between 2025 and 2033, the computational photography market is projected to experience robust growth as AI-driven imaging becomes central to next-generation camera systems across smartphones, automotive, and industrial applications. Advances in neural image processing, 3D imaging, and quantum dot sensors will redefine how devices capture and interpret visual data. The convergence of computational imaging with augmented reality, metaverse experiences, and autonomous technologies will further expand its use cases. As hardware becomes more energy-efficient and algorithms more adaptive, computational photography will evolve from an enhancement feature to a core imaging standard across digital ecosystems.
Key Market Players
Top computational photography companies Apple Inc. (US), Samsung (South Korea), NVIDIA Corporation (US), Qualcomm Technologies, Inc. (US), Adobe (US).
Key Questions addressed in this report:
- What are the global trends in demand for the market?
- What are the upcoming technologies/product areas that will have a significant impact on the market in the future?
- What will be the revenue pockets for the market players in the next 6 years?
- What are the prime strategies followed by key players in the market?
 Exclusive indicates content/data unique to MarketsandMarkets and not available with any competitors.
Table of Contents
1 Introduction (Page No. - 18)
1.1 Study Objectives
1.2 Definition
1.3 Markets Covered
1.3.1 Years Considered
1.4 Currency
1.5 Stakeholders
2 Research Methodology (Page No. - 21)
2.1 Research Data
2.1.1 Secondary Data
2.1.1.1 Key Data From Secondary Sources
2.1.2 Primary Data
2.1.2.1 Key Data From Primary Sources
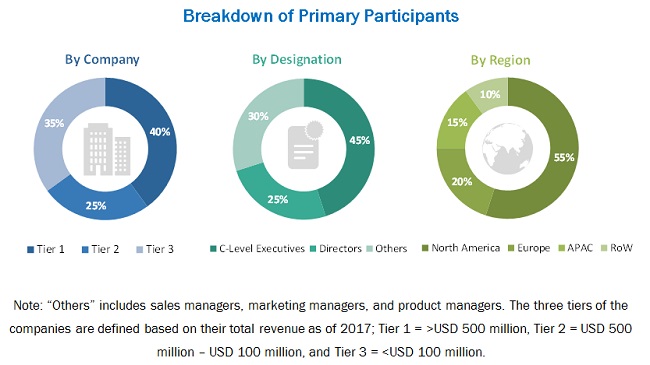
2.1.2.2 Breakdown of Primaries
2.1.2.3 Key Industry Insights
2.2 Market Size Estimation
2.2.1 Bottom-Up Approach
2.2.1.1 Approach for Capturing Market Share By Bottom-Up Analysis (Demand Side)
2.2.1.2 Approach for Capturing Market Share With Help of Various Players in Value Chain of Market
2.2.2 Top-Down Approach
2.2.2.1 Approach for Capturing Market Share By Top-Down Analysis (Supply Side)
2.3 Market Breakdown and Data Triangulation
2.4 Research Assumptions
3 Executive Summary (Page No. - 29)
4 Premium Insights (Page No. - 33)
4.1 Attractive Opportunities in Computational Photography Market
4.2 Market, By Product
4.3 Market, By Type
4.4 Market, By Offering
4.5 Market, By Application and Region
4.6 Market, By Geography
5 Market Overview (Page No. - 37)
5.1 Introduction
5.2 Market Dynamics
5.2.1 Drivers
5.2.1.1 Accelerated Demand for High-Resolution Still Cameras
5.2.1.2 Increased Adoption of Computational Photography in Smartphone Cameras
5.2.2 Restraints
5.2.2.1 High Maintenance and Manufacturing Costs of Computational Camera Modules
5.2.3 Opportunities
5.2.3.1 Growing Adoption of Image Fusion Technique to Achieve High-Quality Image
5.2.3.2 Rising Use of Displays With 4k Resolution Standard
5.2.3.3 Increasing Demand for High-Resolution Computational Cameras in Machine Vision
5.2.4 Challenges
5.2.4.1 Rising Focus on Miniaturization of Image Sensor Chips
6 Computational Photography Market, By Offering (Page No. - 41)
6.1 Introduction
6.2 Camera Modules
6.3 Software
7 Computational Photography Market, By Type (Page No. - 45)
7.1 Introduction
7.2 Single- and Dual-Lens Cameras
7.2.1 Single- and Dual-Lens Cameras to Hold Largest Market Size of Computational Photography
7.3 16-Lens Cameras
7.3.1 16-Lens Cameras to Witness Highest Growth in Market
7.4 Others
8 Computational Photography Market, By Product (Page No. - 55)
8.1 Introduction
8.2 Smartphone Cameras
8.2.1 Smartphone Cameras Held Largest Market Size of Computational Photography
8.3 Standalone Cameras
8.3.1 Standalone Cameras Held Second-Largest Size of Market
8.4 Machine Vision Cameras
8.4.1 Machine Vision Cameras Accounted for Highest Growth of Market During Forecast Period
9 Computational Photography Market, By Application (Page No. - 67)
9.1 Introduction
9.2 3D Imaging
9.2.1 Rising Focus on Image Quality Propels Growth of Market for 3D Imaging
9.3 Virtual Reality
9.3.1 Growing Demand for Content Creation in VR Drives Market
9.4 Augmented Reality
9.4.1 Increasing Focus on Advanced Quality Cameras and Images Drives Market for AR
9.5 Mixed Reality
9.5.1 Rising Need for Enhanced User Experience Drives Growth of Market for MR
10 Geographic Analysis (Page No. - 80)
10.1 Introduction
10.2 North America
10.2.1 Market in US to Grow at Highest CAGR During Forecast Period
10.2.2 US
10.2.2.1 US Market is Largely Driven By Commercialization of L16 Cameras
10.2.3 Canada
10.2.3.1 Canadian Market Driven By Surge in Smartphone Production
10.2.4 Mexico
10.2.4.1 Mexican Market Driven By Expansion of Chinese Smartphone Manufacturers
10.3 Europe
10.3.1 Adoption of Machine Vision and Ai-Enabled Cameras Across Several Industries
10.3.2 UK
10.3.2.1 Trend of Sharing Images and Videos Using Advanced Media-Sharing Technologies
10.3.3 Germany
10.3.3.1 Adoption of Machine Vision Cameras in Germany
10.3.4 France
10.3.4.1 Demand for 4k Pixel and Ultra Hd Camera Modules in France
10.3.5 Italy
10.3.5.1 Presence of Automobile Manufacturing Plants in Italy Require Advanced Machine Vision Cameras
10.3.6 Spain
10.3.6.1 Popularity of Chinese Phones Including Xiaomi and Huawei
10.3.7 Sweden
10.3.7.1 Large Market Share of Apple Smartphones in Sweden
10.3.8 Netherlands
10.3.8.1 Growth of Economy in Netherlands
10.3.9 Belgium
10.3.9.1 Domination of Samsung, Apple, and Huawei in Belgium
10.3.10 Norway
10.3.10.1 Leadership of Nokia in Norwegian Market
10.3.11 Rest of Europe
10.3.11.1 High Expenditure on Advanced Smartphones
10.4 APAC
10.4.1 Chinese Smartphone Manufacturers Boost Growth of Market in APAC
10.4.2 Japan
10.4.2.1 Strong Foothold of Major Companies Offering Computational Photography Such as Canon, Nikon, and Sony
10.4.3 China
10.4.3.1 High Involvement of China in Technological Adoptions
10.4.4 South Korea
10.4.4.1 Adoption of Computational Photography By Major Companies Such as Apple and Samsung Having Presence in Country
10.4.5 India
10.4.5.1 Setup of New Manufacturing Plants
10.4.6 Australia
10.4.6.1 Growing Adoption of AR and VR Applications
10.4.7 Singapore
10.4.7.1 Expansion of Manufacturing Base
10.4.8 Taiwan
10.4.8.1 Huge Market Base of Sony, Huawei, and Xiaomi
10.4.9 Rest of APAC
10.4.9.1 Growth of Manufacturing Industry
10.5 RoW
10.5.1 Growing Machine Vision Application in Middle Eastern Region
10.5.2 South America
10.5.2.1 Large Number of Tech-Savvy Consumers in Brazil
10.5.3 Middle East
10.5.3.1 Region Likely to Move Toward New Cognitive Technology
10.5.4 Africa
10.5.4.1 Smartphone Cameras have Huge Potential in African Market
11 Competitive Landscape (Page No. - 108)
11.1 Overview
11.2 Market Ranking Analysis 2018
11.3 Recent Developments
11.3.1 Product Launches
11.3.2 Partnerships, Contracts, Agreements, and Collaborations
11.4 Competitive Leadership Mapping
11.4.1 Visionary Leaders
11.4.2 Dynamic Differentiators
11.4.3 Innovators
11.4.4 Emerging Companies
11.5 Strength of Product Portfolio
11.6 Business Strategies Excellence
12 Company Profiles (Page No. - 115)
(Business Overview, Products Offered, Recent Developments, SWOT Analysis, and MnM View)*
12.1 Key Players
12.1.1 Apple
12.1.2 Adobe
12.1.3 Samsung Electronics
12.1.4 Qualcomm Technologies
12.1.5 NVIDIA
12.1.6 Canon
12.1.7 Nikon
12.1.8 Light
12.1.9 Sony
12.1.10 on Semiconductor
12.2 Other Key Players
12.2.1 Microsoft
12.2.2 HTC
12.2.3 Corephotonics
12.2.4 DXO Labs
12.2.5 Xperi
12.2.6 Affinity Media
12.2.7 Algolux
12.2.8 Leica Camera Ag
12.2.9 Raytrix
12.2.10 Almalence
*Details on Business Overview, Products Offered, Recent Developments, SWOT Analysis, and MnM View Might Not Be Captured in Case of Unlisted Companies.
13 Appendix (Page No. - 136)
13.1 Insights From Industry Experts
13.2 Discussion Guide
13.3 Knowledge Store: Marketsandmarkets’ Subscription Portal
13.4 Available Customizations
13.5 Related Reports
13.6 Author Details
List of Tables (103 Tables)
Table 1 Computational Photography Market, By Offering, 2017–2024 (USD Billion)
Table 2 Market for Camera Modules, By Product, 2017–2024 (USD Million)
Table 3 Market for Software, By Type, 2017–2024 (USD Million)
Table 4 Market for Software, By Product, 2017–2024 (USD Million)
Table 5 Market, By Type, 2017–2024 (USD Million)
Table 6 Market for Single- & Dual-Lens Cameras, By Region, 2017–2024 (USD Million)
Table 7 Market for Single- & Dual-Lens Cameras in North America, By Country, 2017–2024 (USD Million)
Table 8 Market for Single- & Dual-Lens Cameras in Europe, By Country, 2017–2024 (USD Million)
Table 9 Market for Single- & Dual-Lens Cameras in APAC, By Country, 2017–2024 (USD Million)
Table 10 Market for Single- & Dual-Lens Cameras in RoW, By Country, 2017–2024 (USD Million)
Table 11 Market for 16-Lense Cameras, By Region, 2017–2024 (USD Million)
Table 12 Market for 16-Lens Cameras in North America, By Country, 2017–2024 (USD Million)
Table 13 Market for 16-Lens Cameras in Europe, By Country, 2017–2024 (USD Million)
Table 14 Market for 16-Lens Cameras in APAC, By Country, 2017–2024 (USD Million)
Table 15 Market for 16-Lens Cameras in RoW, By Country, 2017–2024 (USD Million)
Table 16 Market for Other Cameras, By Region, 2017–2024 (USD Million)
Table 17 Market for Other Cameras in North America, By Country, 2017–2024 (USD Million)
Table 18 Market for Other Cameras in Europe, By Country, 2017–2024 (USD Million)
Table 19 Market for Other Cameras in APAC, By Country, 2017–2024 (USD Million)
Table 20 Market for Other Cameras in RoW, By Country, 2017–2024 (USD Million)
Table 21 Market, By Product, 2017–2024 (USD Million)
Table 22 Market for Smartphone Cameras, By Offering, 2017–2024 (USD Million)
Table 23 Market for Smartphone Cameras, By Region, 2017–2024 (USD Million)
Table 24 Market for Smartphone Cameras in North America, By Country, 2017–2024 (USD Million)
Table 25 Market for Smartphone Cameras in Europe, By Country, 2017–2024 (USD Million)
Table 26 Market for Smartphone Cameras in APAC, By Country, 2017–2024 (USD Million)
Table 27 Market for Smartphone Cameras in RoW, By Country, 2017–2024 (USD Million)
Table 28 Market for Standalone Cameras, By Offering, 2017–2024 (USD Million)
Table 29 Market for Standalone Cameras, By Region, 2017–2024 (USD Million)
Table 30 Market for Standalone Cameras in North America, By Country, 2017–2024 (USD Million)
Table 31 Market for Standalone Cameras in Europe, By Country, 2017–2024 (USD Million)
Table 32 Market for Standalone Cameras in APAC, By Country, 2017–2024 (USD Million)
Table 33 Market for Standalone Cameras in RoW, By Country, 2017–2024 (USD Million)
Table 34 Market for Machine Vision Cameras, By Offering, 2017–2024 (USD Million)
Table 35 Market for Machine Vision Cameras, By Region, 2017–2024 (USD Million)
Table 36 Market for Machine Vision Cameras in North America, By Country, 2017–2024 (USD Million)
Table 37 Market for Machine Vision Cameras in Europe, By Country, 2017–2024 (USD Million)
Table 38 Market for Machine Vision Cameras in APAC, By Country, 2017–2024 (USD Million)
Table 39 Market for Machine Vision Cameras in RoW, By Country, 2017–2024 (USD Million)
Table 40 Market, By Application, 2017–2024 (USD Million)
Table 41 Market for 3D Imaging, By Region, 2017–2024 (USD Million)
Table 42 Market for 3D Imaging in North America, By Country, 2017–2024 (USD Million)
Table 43 Market for 3D Imaging in Europe, By Country, 2017–2024 (USD Million)
Table 44 Market for 3D Imaging in APAC, By Country, 2017–2024 (USD Million)
Table 45 Market for 3D Imaging in RoW, By Country, 2017–2024 (USD Million)
Table 46 Market for Virtual Reality, By Region, 2017–2024 (USD Million)
Table 47 Market for Virtual Reality in North America, By Country, 2017–2024 (USD Million)
Table 48 Market for Virtual Reality in Europe, By Country, 2017–2024 (USD Million)
Table 49 Market for Virtual Reality in APAC, By Country, 2017–2024 (USD Million)
Table 50 Market for Virtual Reality in RoW, By Country, 2017–2024 (USD Million)
Table 51 Market for Augmented Reality, By Region, 2017–2024 (USD Million)
Table 52 Market for Augmented Reality in North America, By Country, 2017–2024 (USD Million)
Table 53 Market for Augmented Reality in Europe, By Country, 2017–2024 (USD Million)
Table 54 Market for Augmented Reality in APAC, By Country, 2017–2024 (USD Million)
Table 55 Market for Augmented Reality in RoW, By Country, 2017–2024 (USD Million)
Table 56 Market for Mixed Reality, By Region, 2017–2024 (USD Million)
Table 57 Market for Mixed Reality in North America, By Country, 2017–2024 (USD Million)
Table 58 Market for Mixed Reality in Europe, By Country, 2017–2024 (USD Million)
Table 59 Market for Mixed Reality in APAC, By Country, 2017–2024 (USD Million)
Table 60 Market for Mixed Reality in RoW, By Country, 2017–2024 (USD Million)
Table 61 Market, By Region, 2017–2024 (USD Billion)
Table 62 North American Computational Photography Market, By Product, 2017–2024 (USD Million)
Table 63 North American Market, By Application, 2017–2024 (USD Million)
Table 64 North American Market, By Type, 2017–2024 (USD Million)
Table 65 North American Market, By Country, 2017–2024 (USD Million)
Table 66 Market in US , By Product, 2017–2024 (USD Million)
Table 67 Market in Canada , By Product, 2017–2024 (USD Million)
Table 68 Market in Mexico , By Product, 2017–2024 (USD Million)
Table 69 European Computational Photography Market, By Product, 2017–2024 (USD Million)
Table 70 European Market, By Application, 2017–2024 (USD Million)
Table 71 European Market, By Type, 2017–2024 (USD Million)
Table 72 European Market, By Country, 2017–2024 (USD Million)
Table 73 Market in UK , By Product, 2017–2024 (USD Million)
Table 74 Market in Germany , By Product, 2017–2024 (USD Million)
Table 75 Market in France , By Product, 2017–2024 (USD Million)
Table 76 Market in Italy, By Product, 2017–2024 (USD Million)
Table 77 Market in Spain, By Product, 2017–2024 (USD Million)
Table 78 Market in Sweden, By Product, 2017–2024 (USD Million)
Table 79 Market in Netherlands, By Product, 2017–2024 (USD Million)
Table 80 Market in Belgium, By Product, 2017–2024 (USD Million)
Table 81 Market in Norway, By Product, 2017–2024 (USD Million)
Table 82 Market in Rest of Europe, By Product, 2017–2024 (USD Million)
Table 83 Market in APAC, By Product, 2017–2024 (USD Million)
Table 84 APAC Computational Photography Market, By Application, 2017–2024 (USD Million)
Table 85 APAC Market, By Type, 2017–2024 (USD Million)
Table 86 Market in APAC, By Country, 2017–2024 (USD Million)
Table 87 Market in Japan, By Product, 2017–2024 (USD Million)
Table 88 Market in China, By Product, 2017–2024 (USD Million)
Table 89 Market in South Korea, By Product, 2017–2024 (USD Million)
Table 90 Market in India, By Product, 2017–2024 (USD Million)
Table 91 Market in Australia, By Product, 2017–2024 (USD Million)
Table 92 Market in Singapore, By Product, 2017–2024 (USD Million)
Table 93 Market in Taiwan, By Product, 2017–2024 (USD Million)
Table 94 Market in Rest of APAC, By Product, 2017–2024 (USD Million)
Table 95 Market in RoW, By Product, 2017–2024 (USD Million)
Table 96 RoW Computational Photography Market, By Application, 2017–2024 (USD Million)
Table 97 RoW Market, By Type, 2017–2024 (USD Million)
Table 98 Market in RoW, By Region, 2017–2024 (USD Million)
Table 99 Market in South America, By Product, 2017–2024 (USD Million)
Table 100 Market in Middle East, By Product, 2017–2024 (USD Million)
Table 101 Market in Africa, By Product, 2017–2024 (USD Million)
Table 102 Product Launches, 2017–2019
Table 103 Partnerships, Contracts, Agreements, and Collaborations, 2016–2019
List of Figures (43 Figures)
Figure 1 Market Segmentation
Figure 2 Computational Photography Market: Research Design
Figure 3 Market Size Estimation Methodology: Bottom-Up Approach
Figure 4 Market Size Estimation Methodology: Top-Down Approach
Figure 5 Data Triangulation Methodology
Figure 6 Computational Photography Market Size, 2017–2024 (USD Billion)
Figure 7 Smartphone Cameras to Hold Largest Size of Market By 2024
Figure 8 Single- and Dual-Lens Cameras to Hold Largest Share of Market By 2024
Figure 9 Camera Modules to Hold Larger Size of Computational Photography Market By 2024
Figure 10 3D Imaging Held Largest Share of Market in 2018
Figure 11 APAC Offers Lucrative Opportunities for Market During Forecast Period
Figure 12 Demand for Advance Imaging Drives Growth of Market
Figure 13 Smartphone Cameras to Hold Largest Market Share From 2019 to 2024
Figure 14 Single- and Dual-Lens Cameras Held Largest Size of Market in 2018
Figure 15 Camera Modules Held Larger Size of Market Than Software in 2018
Figure 16 3D Imaging Held Largest Share of Market in 2018
Figure 17 Market in China to Grow at Highest CAGR From 2019 to 2024
Figure 18 Market: Drivers, Restraints, Opportunities, and Challenges
Figure 19 Camera Modules to Account for Largest Size of Market By 2024
Figure 20 Single- and Dual-Lens Cameras to Hold Largest Market Size By 2024
Figure 21 Smartphone Cameras to Hold Largest Market Size of Market During Forecast Period
Figure 22 Camera Modules for Standalone Cameras to Hold Larger Market Share During Forecast Period
Figure 23 3D Imaging Application to Hold Largest Market Size During 2019–2024
Figure 24 North America Held Largest Market Size of Market for Virtual Reality in 2018
Figure 25 Market in China is Expected to Grow at Highest CAGR During Forecast Period
Figure 26 North America: Geographic Snapshot
Figure 27 Snapshot of Market in Europe
Figure 28 Smartphone Cameras Held Largest Market Size of European Market in 2018
Figure 29 Snapshot of Market in APAC
Figure 30 Market in APAC for Smartphone Cameras Held Largest Size in 2018
Figure 31 Companies Adopted Product Launches as Key Growth Strategy From 2016 to 2019
Figure 32 Ranking of Key Players in Market 2018.
Figure 33 Battle for Market Share: Product Launch Was Key Strategy
Figure 34 Market (Global) Competitive Leadership Mapping, 2018
Figure 35 Apple: Company Snapshot
Figure 36 Adobe : Company Snapshot
Figure 37 Samsung Electronics: Company Snapshot
Figure 38 Qualcomm Technologies: Company Snapshot
Figure 39 NVIDIA: Company Snapshot
Figure 40 Canon: Company Snapshot
Figure 41 Nikon: Company Snapshot
Figure 42 Sony: Company Snapshot
Figure 43 On Semiconductors: Company Snapshot
The study involved four major activities in estimating the current size of the computational photography market. Exhaustive secondary research has been conducted to collect information about the market, the peer market, and the parent market. Validating findings, assumptions, and sizing with industry experts across the value chain through primary research has been the next step. Both top-down and bottom-up approaches have been employed to estimate the complete market size. After that, market breakdown and data triangulation methods have been used to estimate the market size of segments and subsegments.
Secondary Research
The research methodology used to estimate and forecast the computational photography market begins with capturing data on revenues of the key vendors in the market through secondary research. This study involves the use of extensive secondary sources, directories, and databases such as Hoovers, Bloomberg Businessweek, Factiva, and OneSource to identify and collect information useful for the technical and commercial study of the computational photography market. Moreover, secondary sources include annual reports, press releases, and investor presentations of companies; white papers, certified publications, and articles from recognized authors; directories; and databases. Secondary research has been mainly done to obtain key information about the industry’s supply chain, the market’s value chain, the total pool of key players, market classification and segmentation according to industry trends, geographic markets, and key developments from both market- and technology oriented perspectives.
Primary Research
In the primary research process, various primary sources from both supply and demand sides were interviewed to obtain the qualitative and quantitative information relevant to the computational photography market. Primary sources from the supply side include experts such as CEOs, vice presidents, marketing directors, technology and innovation directors, application developers, application users, and related executives from various key companies and organizations operating in the ecosystem of the computational photography market.
To know about the assumptions considered for the study, download the pdf brochure
Market Size Estimation
Both top-down and bottom-up approaches have been used to estimate and validate the overall size of the computational photography market. These methods have also been used extensively to estimate the size of various market subsegments. The research methodology used to estimate the market size includes the following:
- Key players in major applications and markets have been identified through extensive secondary research.
- The industry’s supply chain and market size, in terms of value, have been determined through primary and secondary research processes.
- All percentage shares, splits, and breakdowns have been determined using secondary sources and verified through primary sources.
Data Triangulation
After arriving at the overall market size using the estimation processes as explained above, the market was split into several segments and subsegments. To complete the overall market engineering process and arrive at the exact statistics of each market segment and subsegment, data triangulation, and market breakdown procedures have been employed, wherever applicable. The data have been triangulated by studying various factors and trends from both the demand and supply sides.
Report Objectives
- Describe and forecast the computational photography market, by offering, by type, by product, by application, in terms of value
- Describe and forecast the market for various segments by region—North America, Europe, Asia Pacific (APAC), and Rest of the World (RoW), in terms of value
- Provide detailed information regarding drivers, restraints, opportunities, and challenges pertaining to the computational photography market
- Analyze micromarkets1 with respect to individual growth trends, prospects, and contribution to the total market
- Profile key players and analyze their market ranking in terms of revenue and core competencies and provide the details of the competitive landscape for market leaders
- Analyze competitive developments such as new product developments; partnerships, collaborations; and others in the computational photography market
Available Customizations
With the given market data, MarketsandMarkets offers customizations according to the company’s specific needs. The following customization options are available for the report:
Product Analysis
- Product matrix that gives a detailed comparison of the product portfolio of each company
- Comprehensive coverage of funding/M&A activities, regulations followed in each region (North America, APAC, Europe, and RoW)
Company Information
- Detailed analysis and profiling of additional market players (up to 5)


Growth opportunities and latent adjacency in Computational Photography Market