Concentrated Nitric Acid Market by Type (Strong, Fuming), Application (Ammonium Nitrate, Adipic Acid, Nitrobenzene, Toluene Diisocyanate), End-use Industry (Agrochemicals, Explosives, Automotive, Electronics), and Region - Global Forecast to 2022


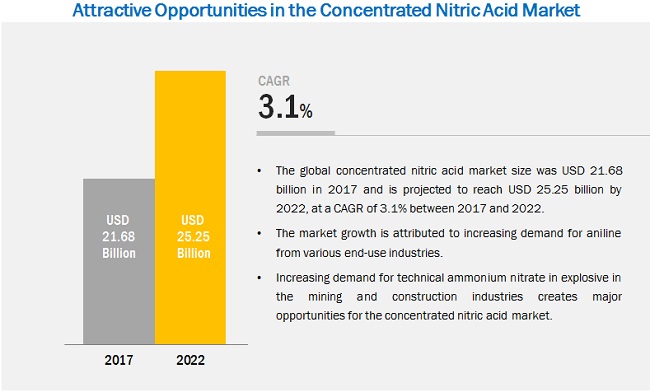
[162 Pages Report] Concentrated Nitric Acid Market was valued at USD 21.11 Billion in 2016 and is projected to reach USD 25.24 Billion by 2022, at a CAGR of 3.1% during the forecast period. The base year considered for the study is 2016, while the forecast period is from 2017 to 2022.
The objectives of the report are as follows:
- To define, describe, and forecast the concentrated nitric acid market on the basis of type, application, end-use industry, and region
- To identify the factors, such as drivers, restraints, opportunities, and challenges influencing the growth of the concentrated nitric acid market during the forecast period
- To forecast the size of the concentrated nitric acid market, in terms of volume and value
- To analyze the detailed segmentation of the concentrated nitric acid market and forecast the market size, in terms of volume and value for the five key regions, namely, North America, Europe, Asia Pacific, the Middle East & Africa, and South America
- To analyze the competitive developments, such as expansions, new product developments, joint ventures, and mergers & acquisitions in the market of concentrated nitric acid
- To profile the leading players operating in the market of concentrated nitric acid and identify their core competencies
Research Methodology
Both, top-down and bottom-up approaches were used to estimate and validate the sizes of the concentrated nitric acid market and various other dependent submarkets. The research study involved the extensive use of secondary sources, directories, and databases, such as D&B Hoovers, Bloomberg, Chemical Weekly, Factiva, and other government and private websites to identify and collect information useful for this technical, market-oriented, and commercial study of the concentrated nitric acid.
To know about the assumptions considered for the study, download the pdf brochure
Some of the major players operating in the market of concentrated nitric acid include Agrium Inc.(Canada), CF Industries (US), Deepak Fertilisers and Petrochemicals Corp. Ltd. (India), Hanwha Corporation (South Korea), Koch Fertilizers LLC (US), LSB Industries Inc. (U.S.), National Chemical Group (Russia), OCI N.V. (Netherlands), Shandong Fengyuan Chemical Stock Co. Ltd. (China), Ube Industries (Japan), and Yara International (Norway).
Key Target Audience:
- Manufacturers, Dealers, and Suppliers of Concentrated Nitric Acid
- Concentrated nitric acid Manufacturing Plant Developers and Related Service Providers
- Companies Manufacturing Ammonium Nitrate, Adipic Acid, Nitrobenzene, Toluene Diisocyanate
- Investors
Scope of the Report:
This research report categorizes the concentrated nitric acid market on the basis of type, application, end-use industry, and region.
Concentrated Nitric Acid Market, by Type:
- Strong Nitric Acid
- Fuming Nitric Acid
Concentrated Nitric Acid Market, by Application:
- Ammonium Nitrate
- Adipic Acid
- Nitrobenzene
- Toluene Diisocyanate
- Others
Concentrated Nitric Acid Market, by End-use Industry:
- Agrochemicals
- Explosives
- Automotive
- Electronics
- Others
Concentrated Nitric Acid Market, by Region:
- Asia-Pacific
- Europe
- North America
- Middle East & Africa
- South America
The market has been further analyzed for the key countries in each of these regions.
Available Customizations:
Along with the market data, MarketsandMarkets offers customizations as per the specific needs of the companies. The following customization options are available for the report:
Country Information:
- Concentrated nitric acid market analysis for additional countries
Company Information:
- Detailed analysis and profiling of additional market players (up to 5)
Pricing Analysis:
- Detailed pricing analysis for each type of concentrated nitric acid
The concentrated nitric acid market is projected to reach USD 25.24 Billion by 2022, at a CAGR of 3.1% from 2017 to 2022. Concentrated nitric acid is used in the manufacturing of ammonium nitrate, adipic acid, nitrobenzene, toluene diisocyanate, trinitrotoluene, and nitroglycerine. These applications are used across various end-use industries such as agrochemicals, explosives, automotive, electronics, and others. The growth of these end-use industries is expected to drive the market growth of the concentrated nitric acid during the forecast period.
Based on type, the concentrated nitric acid market has been segmented into strong nitric acid (concentration 50-85%) and fuming nitric acid (concentration equal to or more than 86%). Strong nitric acid is estimated to be the fastest-growing type of the concentrated nitric acid market during the forecast period. It is used in manufacturing various applications such as ammonium nitrate, adipic acid, nitrobenzene, nitro chlorobenzene, toluene diisocyanate (TDI), and trinitrotoluene (TNT). Strong nitric acid, a class-2 oxidizer, moderately increase the burning rate of materials that they are in contact. This property is used in developing secondary explosives.
Ammonium nitrate is estimated to be the largest segment among the applications. It is widely used in fertilizers and explosives. In fertilizers, ammonium nitrate can be used directly, or it can be used as an intermediate for other nitrogen fertilizers, such as calcium ammonium nitrate and urea ammonium nitrate.
Among end-use industries of concentrated nitric acid, agrochemicals is estimated to remain the largest segment during the forecast period. The increasing demand for nitrogen fertilizers from the emerging countries such as China, India, and Brazil is estimated to fuel the demand for ammonium nitrate in the fertilizers segment. Increased awareness about impacts of ammonium nitrate on soil fertilizer and water resources have reduced the demand from developed countries in Europe and North America. However, the demand for other nitrogen fertilizers such as calcium ammonium nitrate and urea ammonium nitrate is rising. Nitrobenzene is used in crop protection products such as pesticides. The rising demand for nitrogen fertilizer and crop protection products in the global agrochemical industry is estimated to fuel the demand for concentrated nitric acid during the forecast period.
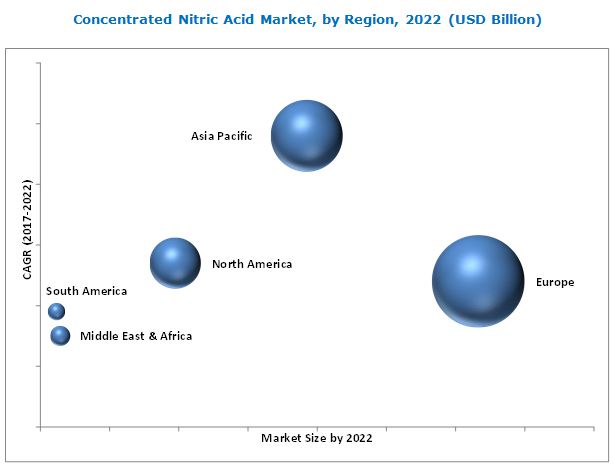
Rising demand for concentrated nitric acid from the agrochemicals, explosives, automotive, and electronics industries is driving the market of concentrated nitric acid, globally. Asia Pacific is projected to be the fastest-growing market for concentrated nitric acid during the forecast period, followed by Europe and North America. The growth of the market can be attributed to the presence of the regional manufacturers of concentrated nitric acid, such as Hanwha Corporation (South Korea), Shandong Fengyuan Chemical Stock Co. Ltd. (China), and Ube Industries (Japan) in the region. The concentrated nitric acid market in China is projected to grow at the highest CAGR during the forecast period.
The prices of concentrated nitric acid are dependent on the prices of natural gas and its derivatives (ammonia). The fluctuations in the prices of natural gas and ammonia compel the manufacturers of concentrated nitric acid to change prices of their products. This affects the concentrated nitric acid market growth in the short term.
The companies operating in the market of concentrated nitric acid are investing increasingly in the expansion of capacities and improving distribution networks and thus enhance their positions in the market. They have adopted the strategy of mergers & acquisitions to cater to the increasing demand for concentrated nitric acid from different regions. For instance, CF Industries. acquired the remaining 50% shares of GrowHow (UK), the largest nitrogen fertilizer manufacturer in the UK. This has increased the capacity of CF Industries to cater the demand from Europe and increased its brand value in the region.
To speak to our analyst for a discussion on the above findings, click Speak to Analyst
 Exclusive indicates content/data unique to MarketsandMarkets and not available with any competitors.
Table of Contents
1 Introduction (Page No. - 16)
1.1 Objectives of the Study
1.2 Market Definition
1.3 Market Scope
1.3.1 Years Considered for the Study
1.4 Currency
1.5 Package Size
1.6 Limitations
1.7 Stakeholders
2 Research Methodology (Page No. - 19)
2.1 Research Data
2.1.1 Secondary Data
2.1.1.1 Key Data From Secondary Sources
2.1.2 Primary Data
2.1.2.1 Key Data From Primary Sources
2.1.2.2 Key Industry Insights
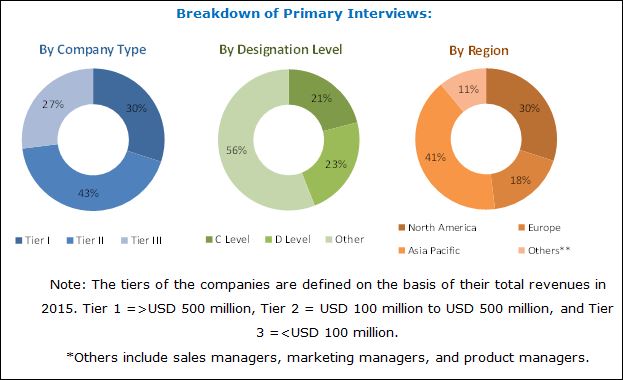
2.1.2.3 Breakdown of Primary Interviews
2.2 Market Size Estimation
2.2.1 Bottom-Up Approach
2.2.2 Top-Down Approach
2.3 Data Triangulation
2.4 Research Assumptions
3 Executive Summary (Page No. - 27)
4 Premium Insights (Page No. - 31)
4.1 Attractive Opportunities in the Concentrated Nitric Acid Market
4.2 Europe Concentrated Nitric Acid Market, By End-Use Industry and Country
4.3 Concentrated Nitric Acid Market Attractiveness
4.4 Concentrated Nitric Acid Market, By Application and Region
5 Market Overview (Page No. - 34)
5.1 Introduction
5.2 Market Dynamics
5.2.1 Drivers
5.2.1.1 Increasing Demand for Aniline in Various End-Use Industries
5.2.1.2 Growing Demand From the Automotive & Infrastructure Industries
5.2.2 Restraints
5.2.2.1 Growing Environmental Concerns and Government Regulations
5.2.3 Opportunities
5.2.3.1 Increasing Demand for Technical Ammonium Nitrate
5.2.4 Challenges
5.2.4.1 Slow Growth of Fertilizer Industry and Toxic Nature of Ammonium Nitrate and Nitrobenzene
5.2.4.2 Bio-Based Adipic Acid Production
5.3 Porter’s Five Forces Analysis
5.3.1 Bargaining Power of Suppliers
5.3.2 Threat of New Entrants
5.3.3 Threat of Substitutes
5.3.4 Bargaining Power of Buyers
5.3.5 Intensity of Competitive Rivalry
5.4 Macroeconomic Overview and Key Drivers
5.4.1 Trends in Nitrogen Fertilizer Industry
5.4.2 Trends in Passenger Cars Segment, 2010–2016
5.5 Trends in Footwear Industry
6 Concentrated Nitric Acid Market, By Type (Page No. - 45)
6.1 Introduction
6.2 Strong Nitric Acid
6.3 Fuming Nitric Acid
7 Concentrated Nitric Acid Market, By Application (Page No. - 50)
7.1 Introduction
7.2 Ammonium Nitrate
7.3 Adipic Acid
7.4 Nitrobenzene
7.5 Toluene Diisocyanate
7.6 Others
8 Concentrated Nitric Acid Market, By End-Use Industry (Page No. - 60)
8.1 Introduction
8.2 Agrochemicals
8.3 Explosives
8.4 Automotive
8.5 Electronics
8.6 Others
9 Concentrated Nitric Acid Market, By Region (Page No. - 70)
9.1 Introduction
9.2 North America
9.2.1 U.S.
9.2.2 Canada
9.2.3 Mexico
9.3 Europe
9.3.1 Russia
9.3.2 U.K.
9.3.3 Germany
9.3.4 Ukraine
9.3.5 Poland
9.3.6 Rest of Europe
9.4 Asia-Pacific
9.4.1 China
9.4.2 India
9.4.3 Australia & New Zealand
9.4.4 Japan
9.4.5 South Korea
9.4.6 Rest of Asia-Pacific
9.5 Middle East & Africa
9.5.1 Egypt
9.5.2 Saudi Arabia
9.5.3 South Africa
9.5.4 Rest of Middle East & Africa
9.6 South America
9.6.1 Brazil
9.6.2 Argentina
9.6.3 Rest of South America
10 Competitive Landscape (Page No. - 123)
10.1 Introduction
10.2 Competitive Leadership Mapping, 2016
10.2.1 Visionary Leaders
10.2.2 Innovators
10.2.3 Dynamic Differentiators
10.2.4 Emerging Companies
10.3 Competitive Benchmarking
10.3.1 Strength of Product Portfolio (25 Companies)
10.3.2 Business Strategy Excellence (25 Companies)
10.4 Market Ranking of Key Players
*Top 25 companies analyzed for this studies are - BASF, The Dow Chemical Company, Hanwha Corporation, Ineos Enterprises, Linde Group, Agrium Inc, Sasol Limited Group, Yara, International, Chemours Company, Ube Industries Ltd, Potash Corporation of Saskatchewan Inc., J R Simplot Company, CF Industries, Grupa Azoty S.A., Omnia Holdings Ltd, Rashtriya Chemicals & Fertilizers Ltd (RCF), Gujarat Narmada Valley Fertilizers & Chemicals Ltd, LSB Industries Inc., Koch fertilizers, LLC, Deepak Fertilisers and, Petrochemicals Corp. Ltd., Ixom, Dyno Nobel, National Chemical Group, Shandong Fengyuan Chemical Stock Co. Ltd., OCI NV
11 Company Profiles (Page No. - 129)
(Overview, Products Offered, Product Offering Scorecard, Business Strategy Scorecard, Recent Developments)*
11.1 Yara International
11.2 CF Industries Holdings, Inc.
11.3 Potash Corp
11.4 Agrium Inc.
11.5 OCI N.V.
11.6 BASF
11.7 Hanwha Corporation
11.8 Linde Group
11.9 UBE Industries
11.10 LSB Industries Inc.
11.11 Other Companies
11.11.1 Sasol Limited Group
11.11.2 The DOW Chemical Company
11.11.3 Ineos Enterprises
11.11.4 Chemours Company.
11.11.5 Rashtriya Chemicals and Fertilizers Ltd
11.11.6 National Chemical Group
11.11.7 Deepak Fertilizers and Petrochemicals Corp. Ltd
11.11.8 Koch Fertilizers
11.11.9 Gujarat Narmada Valley Fertilizers & Chemicals Ltd.
11.11.10 Shandong Fengyuan Chemical Co. Ltd.
11.11.11 JR Simplot Company
11.11.12 Omnia Holdings Ltd
11.11.13 Ixom
11.11.14 Grupa Azoty S.A.
11.11.15 Dyno Nobel Americas.
*Details on Marketsandmarkets View, Overview, Products Offered, Product Offering Scorecard, Business Strategy Scorecard, and Recent Developments Might Not Be Captured in Case of Unlisted Companies.
12 Appendix (Page No. - 154)
12.1 Insights of Industry Experts
12.2 Discussion Guide
12.3 Knowledge Store: Marketsandmarkets’ Subscription Portal
12.4 Introducing RT: Real Time Market Intelligence
12.5 Available Customizations
12.6 Related Reports
12.7 Author Details
List of Tables (138 Tables)
Table 1 Global Demand for Nitrogen Fertilizers, 2010-2014,(Volume)
Table 2 Passenger Cars Sales Growth, By Country, 2011–2016
Table 3 Concentrated Nitric Acid Market Size, By Type, 2015–2022 (Kiloton)
Table 4 Concentrated Nitric Acid Market Size, By Type, 2015–2022 (USD Million)
Table 5 Strong Nitric Acid Market Size, By Region, 2015–2022 (Kiloton)
Table 6 Strong Nitric Acid Market Size, By Region, 2015–2022 (USD Million)
Table 7 Fuming Nitric Acid Market Size, By Region, 2015–2022 (Kiloton)
Table 8 Fuming Nitric Acid Market Size, By Region, 2015–2022 (USD Million)
Table 9 Concentrated Nitric Acid Market Size, By Application, 2015–2022 (Kiloton)
Table 10 Concentrated Nitric Acid Market Size, By Application, 2015–2022 (USD Million)
Table 11 Concentrated Nitric Acid Market Size in Ammonium Nitrate, By Region, 2015–2022 (Kiloton)
Table 12 Concentrated Nitric Acid Market Size in Ammonium Nitrate, By Region, 2015–2022 (USD Million)
Table 13 Concentrated Nitric Acid Market Size in Adipic Acid, By Region, 2015–2022 (Kiloton)
Table 14 Concentrated Nitric Acid Market Size in Adipic Acid, By Region, 2015–2022 (USD Million)
Table 15 Concentrated Nitric Acid Market Size in Nitrobenzene, By Region, 2015–2022 (Kiloton)
Table 16 Concentrated Nitric Acid Market Size in Nitrobenzene, By Region, 2015–2022 (USD Million)
Table 17 Concentrated Nitric Acid Market Size in Toluene Diisocyanate, By Region, 2015–2022 (Kiloton)
Table 18 Concentrated Nitric Acid Market Size in Toluene Diisocyanate, By Region, 2015–2022 (USD Million)
Table 19 Concentrated Nitric Acid Market Size in Other Applications, By Region, 2015–2022 (Kiloton)
Table 20 Concentrated Nitric Acid Market Size in Other Applications, By Region, 2015–2022 (USD Million)
Table 21 By Market Size, By End-Use Industry, 2015–2022 (Kiloton)
Table 22 By Market Size, By End-Use Industry, 2015–2022 (USD Million)
Table 23 By Market Size in Agrochemicals, By Region, 2015–2022 (Kiloton)
Table 24 By Market Size in Agrochemicals, By Region, 2015–2022 (USD Million)
Table 25 By Market Size in Explosives, By Region, 2015–2022 (Kiloton)
Table 26 By Market Size in Explosives, By Region, 2015–2022 (USD Million)
Table 27 By Market Size in Automotive, By Region, 2015–2022 (Kiloton)
Table 28 By Market Size in Automotive, By Region, 2015–2022 (USD Million)
Table 29 By Market Size in Electronics, By Region, 2015–2022 (Kiloton)
Table 30 By Market Size in Electronics, By Region, 2015–2022 (USD Million)
Table 31 By Market Size in Other End-Use Industries, By Region, 2015–2022 (Kiloton)
Table 32 By Market Market Size in Other End-Use Industries, By Region, 2015–2022 (USD Million)
Table 33 By Market Size, By Region, 2015–2022 (Kiloton)
Table 34 By Market Market Size, By Region, 2015–2022 (USD Million)
Table 35 North America: By Market Market Size, By Country, 2015–2022 (Kiloton)
Table 36 North America: By Market Size, By Country, 2015–2022 (USD Million)
Table 37 North America: By Market Market Size, By Type, 2015–2022 (Kiloton)
Table 38 North America: By Market Size, By Type, 2015–2022 (USD Million)
Table 39 North America: By Market Market Size, By Application, 2015–2022 (Kiloton)
Table 40 North America: By Market Size, By Application, 2015–2022 (USD Million)
Table 41 North America: By Market Market Size, By End-Use Industry, 2015–2022 (Kiloton)
Table 42 North America: By Market Size, By End-Use Industry, 2015–2022 (USD Million)
Table 43 U.S.: By Market Market Size, By Type, 2015–2022 (Kiloton)
Table 44 U.S.: By Market Size, By Application, 2015–2022 (Kiloton)
Table 45 U.S.: By Market Market Size, By End-Use Industry, 2015–2022 (Kiloton)
Table 46 Canada: By Market Size, By Type, 2015–2022 (Kiloton)
Table 47 Canada: By Market Size, By Application, 2015–2022 (Kiloton)
Table 48 Canada: By Market Size, By End-Use Industry, 2015–2022 (Kiloton)
Table 49 Mexico: By Market Size, By Type, 2015–2022 (Kiloton)
Table 50 Mexico: By Market Size, By Application, 2015–2022 (Kiloton)
Table 51 Mexico: By Market Size, By End-Use Industry, 2015–2022 (Kiloton)
Table 52 Europe: By Market Size, By Country, 2015–2022 (Kiloton)
Table 53 Europe: By Market Size, By Country, 2015–2022 (USD Million)
Table 54 Europe: By Market Size, By Type, 2015–2022 (Kiloton)
Table 55 Europe: By Market Size, By Type, 2015–2022 (USD Million)
Table 56 Europe: By Market Size, By Application, 2015–2022 (Kiloton)
Table 57 Europe: By Market Size, By Application, 2015–2022 (USD Million)
Table 58 Europe: By Market Size, By End-Use Industry, 2015–2022 (Kiloton)
Table 59 Europe: By Market Size, By End-Use Industry, 2015–2022 (USD Million)
Table 60 Russia: By Market Size, By Type, 2015–2022 (Kiloton)
Table 61 Russia: By Market Size, By Application, 2015–2022 (Kiloton)
Table 62 Russia: By Market Size, By End-Use Industry, 2015–2022 (Kiloton)
Table 63 U.K.: By Market Size, By Type, 2015–2022 (Kiloton)
Table 64 U.K.: By Market Size, By Application, 2015–2022 (Kiloton)
Table 65 U.K.: By Market Size, By End-Use Industry, 2015–2022 (Kiloton)
Table 66 Germany: By Market Size, By Type, 2015–2022 (Kiloton)
Table 67 Germany: By Market Size, By Application, 2015–2022 (Kiloton)
Table 68 Germany: By Market Size, By End-Use Industry, 2015–2022 (Kiloton)
Table 69 Ukraine: By Market Size, By Type, 2015–2022 (Kiloton)
Table 70 Ukraine: By Market Size, By Application, 2015–2022 (Kiloton)
Table 71 Ukraine: By Market Size, By End-Use Industry, 2015–2022 (Kiloton)
Table 72 Poland: By Market Size, By Type, 2015–2022 (Kiloton)
Table 73 Poland: By Market Size, By Application, 2015–2022 (Kiloton)
Table 74 Poland: By Market Size, By End-Use Industry, 2015–2022 (Kiloton)
Table 75 Rest of Europe: By Market Size, By Type, 2015–2022 (Kiloton)
Table 76 Rest of Europe: By Market Size, By Application, 2015–2022 (Kiloton)
Table 77 Rest of Europe: By Market Size, By End-Use Industry, 2015–2022 (Kiloton)
Table 78 Asia-Pacific: By Market Size, By Country, 2015–2022 (Kiloton)
Table 79 Asia-Pacific: By Market Size, By Country, 2015–2022 (USD Million)
Table 80 Asia-Pacific: By Market Size, By Application, 2015–2022 (Kiloton)
Table 81 Asia-Pacific: By Market Size, By Application, 2015–2022 (USD Million)
Table 82 Asia-Pacific: By Market Size, By End-Use Industry, 2015–2022 (Kiloton)
Table 83 Asia-Pacific: By Market Size, By End-Use Industry, 2015–2022 (USD Million)
Table 84 China: By Market Size, By Type, 2015–2022 (Kiloton)
Table 85 China: By Market Size, By Application, 2015–2022 (USD Million)
Table 86 China: By Market Size, By End-Use Industry, 2015–2022 (Kiloton)
Table 87 India: By Market Size, By Type, 2015–2022 (Kiloton)
Table 88 India: By Market Size, By Application, 2015–2022 (Kiloton)
Table 89 India: By Market Size, By End-Use Industry, 2015–2022 (Kiloton)
Table 90 Australia & New Zealand: By Market Size, By Type, 2015–2022 (Kiloton)
Table 91 Australia & New Zealand: By Market Size, By Application, 2015–2022 (Kiloton)
Table 92 Australia & New Zealand: By Market Size, By End-Use Industry, 2015–2022 (Kiloton)
Table 93 Japan: By Market Size, By Type, 2015–2022 (Kiloton)
Table 94 Japan: By Market Size, By Application, 2015–2022 (Kiloton)
Table 95 Japan: By Market Size, By End-Use Industry, 2015–2022 (Kiloton)
Table 96 South Korea: By Market Size, By Type, 2015–2022 (Kiloton)
Table 97 South Korea: By Market Size, By Application, 2015–2022 (Kiloton)
Table 98 South Korea: By Market Size, By End-Use Industry, 2015–2022 (Kiloton)
Table 99 Rest of Asia-Pacific: By Market Size, By Type, 2015–2022 (Kiloton)
Table 100 Rest of Asia-Pacific: By Market Size, By Application, 2015–2022 (Kiloton)
Table 101 Rest of Asia-Pacific: By Market Size, By End-Use Industry, 2015–2022 (Kiloton)
Table 102 Middle East & Africa: By Market Size, By Country, 2015–2022 (Kiloton)
Table 103 Middle East & Africa: By Market Size, By Country, 2015–2022 (USD Million)
Table 104 Middle East & Africa: By Market Size, By Type, 2015–2022 (Kiloton)
Table 105 Middle East & Africa: By Market Size, By Type, 2015–2022 (USD Million)
Table 106 Middle East & Africa: By Market Size, By Application, 2015–2022 (Kiloton)
Table 107 Middle East & Africa: By Market Size, By Application, 2015–2022 (USD Million)
Table 108 Middle East & Africa: By Market Size, By End-Use Industry, 2015–2022 (Kiloton)
Table 109 Middle East & Africa: By Market Size, By End-Use Industry, 2015–2022 (USD Million)
Table 110 Egypt: By Market Size, By Type, 2015–2022 (Kiloton)
Table 111 Egypt: By Market Size, By Application, 2015–2022 (Kiloton)
Table 112 Egypt: By Market Size, By End-Use Industry, 2015–2022 (Kiloton)
Table 113 UAE: By Market Size, By Type, 2015–2022 (Kiloton)
Table 114 UAE: Market Size, By Application, 2015–2022 (Kiloton)
Table 115 Saudi Arabia: By Market Size, By End-Use Industry, 2015–2022 (Kiloton)
Table 116 South Africa: By Market Size, By Type, 2015–2022 (Kiloton)
Table 117 South Africa: By Market Size, By Application, 2015–2022 (Kiloton)
Table 118 Saudi Arabia: By Market Size, By End-Use Industry, 2015–2022 (Kiloton)
Table 119 Rest of Middle East & Africa: By Market Size, By Type, 2015–2022 (Kiloton)
Table 120 Rest of Middle East & Africa: By Market Size, By Application, 2015–2022 (Kiloton)
Table 121 Rest of Middle East & Africa: By Market Size, By End-Use Industry, 2015–2022 (Kiloton)
Table 122 South America: By Market Size, By Country, 2015–2022 (Kiloton)
Table 123 South America: By Market Size, By Country, 2015–2022 (USD Million)
Table 124 South America: By Market Size, By Type, 2015–2022 (Kiloton)
Table 125 South America: By Market Size, By Type, 2015–2022 (USD Million)
Table 126 South America: By Market Size, By Application, 2015–2022 (Kiloton)
Table 127 South America: By Market Size, By Application, 2015–2022 (USD Million)
Table 128 South America: By Market Size, By End-Use Industry, 2015–2022 (Kiloton)
Table 129 South America: By Market Size, By End-Use Industry, 2015–2022 (USD Million)
Table 130 Brazil: By Market Size, By Type, 2015–2022 (USD Million)
Table 131 Brazil: By Market Size, By Application, 2015–2022 (Kiloton)
Table 132 Brazil: By Market Size, By End-Use Industry, 2015–2022 (Kiloton)
Table 133 Argentina: By Market Size, By Type, 2015–2022 (USD Million)
Table 134 Argentina: By Market Size, By Application, 2015–2022 (Kiloton)
Table 135 Argentina: By Market Size, By End-Use Industry, 2015–2022 (Kiloton)
Table 136 Rest of South America: By Market Size, By Type, 2015–2022 (USD Million)
Table 137 Rest of South America: By Market Size, By Application, 2015–2022 (Kiloton)
Table 138 Rest of South America: By Market Size, By End-Use Industry, 2015–2022 (Kiloton)
List of Figures (45 Figures)
Figure 1 Concentrated Nitric Acid: Market Segmentation
Figure 2 Concentrated Nitric Acid Market: Research Design
Figure 3 Market Size Estimation: Bottom-Up Approach
Figure 4 Market Size Estimation: Top-Down Approach
Figure 5 Market: Data Triangulation
Figure 6 Strong Nitric Acid to Dominate the Concentrated Nitric Acid Market Between 2017 and 2022
Figure 7 Ammonium Nitrate to Dominate Concentrated Nitric Acid Market Between 2017 and 2022
Figure 8 Agrochemicals End-Use Industry to Dominate the Concentrated Nitric Acid Market Between 2017 and 2022
Figure 9 Asia-Pacific to Witness Significant Growth in the Market During the Forecast Period
Figure 10 Growing Demand for Nitrobenzene and Ammonium Nitrate Application to Drive the Market
Figure 11 Ammonium Nitrate Segment Accounted for the Largest Market Share in Europe, 2016
Figure 12 Asia-Pacific to Be the Fastest-Growing Market During the Forecast Period
Figure 13 Ammonium Nitrate Accounted for the Largest Market Share in 2016
Figure 14 Factors Governing the Concentrated Nitric Acid Market
Figure 15 Concentrated Nitric Acid: Porter’s Five Forces Analysis
Figure 16 Global Footwear Production, By Country, 2015
Figure 17 Asia-Pacific to Be the Fastest-Growing Market for Strong Nitric Acid Between 2017 and 2022
Figure 18 Europe to Dominate the Fuming Nitric Acid Market During the Forecast Period
Figure 19 Asia-Pacific to Be the Fastest-Growing Market of Concentrated Nitric Acid in Ammonium Nitrate Between 2017 and 2022
Figure 20 Asia-Pacific to Lead the Market of Concentrated Nitric Acid in Adipic Acid During the Forecast Period
Figure 21 Asia-Pacific to Lead the Market of Concentrated Nitric Acid in Nitrobenzene Between 2017 and 2022
Figure 22 Europe to Lead the Market of Concentrated Nitric Acid in Toluene Diisocyanate Between2017 and 2022
Figure 23 Europe to Lead the Market of Concentrated Nitric Acid in Other Applications During the Forecast Period
Figure 24 Agrochemicals Was the Largest End-Use Industry of Concentrated Nitric Acid in 2016
Figure 25 Europe to Lead Market of Concentrated Nitric Acid in Agrochemicals Between 2017 and 2022
Figure 26 Europe to Be the Largest Market of Concentrated Nitric Acid in Explosives During the Forecast Period
Figure 27 Asia-Pacific to Lead the Market of Concentrated Nitric Acid in Automotive During the Forecast Period
Figure 28 Asia-Pacific to Be the Largest Market of Concentrated Nitric Acid in Electronics During the Forecast Period
Figure 29 Europe to Be the Largest Market in Other End-Use Industries Between 2017 and 2022
Figure 30 Regional Snapshot: Rapidly Growing Markets are Emerging as New Strategic Locations
Figure 31 North America Market Snapshot: U.S. and Canada are the Most Lucrative Markets
Figure 32 Agrochemicals Was the Leading End-Use Industry of Concentrated Nitric Acid in Europe, 2016
Figure 33 Agrochemicals Was the Largest End-Use Industry of Concentrated Nitric Acid in 2016
Figure 34 Asia-Pacific Market Snapshot: China and India are the Most Lucrative Markets
Figure 35 Competitive Leadership Mapping,2016
Figure 36 Yara International: Company Snapshot
Figure 37 CF Industries Holdings, Inc.: Company Snapshot
Figure 38 Potash Corp: Company Snapshot
Figure 39 Agrium Inc.: Company Snapshot
Figure 40 OCI N.V.: Company Snapshot
Figure 41 BASF: Company Snapshot
Figure 42 Hanwha Corporation: Company Snapshot
Figure 43 Linde Group: Company Snapshot
Figure 44 UBE Industries: Company Snapshot
Figure 45 LSB Industries: Company Snapshot


Growth opportunities and latent adjacency in Concentrated Nitric Acid Market