Nitrogenous Fertilizers Market by Type (Urea, Ammonium Nitrate, Ammonium Sulfate, and Calcium Ammonium Nitrate), Form (Liquid and Dry), Mode of Application (Soil, Foliar, and Fertigation), Crop Type, and Region - Global Forecast to 2022


The nitrogenous fertilizers market was valued at USD 110.55 billion in 2016. It is projected to grow at a CAGR of 2.33% from 2017, to reach USD 126.96 billion by 2022.
The years considered for the study are as follows:
- Base year – 2015
- Estimated year – 2016
- Projected year – 2022
- Forecast period – 2016 to 2022
The objectives of the report are as follows:
- To define, segment, measure, and project the nitrogenous fertilizers market with respect to fertilizer type, crop type, mode of application, form, and key regions
- To identify, analyze, and comment on crucial factors influencing the overall market (drivers, restraints, opportunities, and industry-specific challenges)
- To profile the key players to comprehensively analyze their core competencies and market strategies and provide an overall competitive landscape in the market
- Analyzing the demand-side factors based on the impact of macro and microeconomic factors on the market and shifts in the demand patterns across different subsegments and regions
Research Methodology:
- Major regions were identified along with countries contributing the maximum share.
- Secondary research was conducted to obtain the value of nitrogenous fertilizers market for regions such as North America, Europe, Asia Pacific, South America, and RoW.
- Key players have been identified through secondary sources such as the Bloomberg Businessweek, Factiva, agricultural magazines, and companies’ annual reports, while their market share in the respective regions has been determined through both, primary and secondary research.
- The research methodology includes the study of annual and financial reports of top market players as well as interviews with industry experts (such as CEOs, VPs, directors, and marketing executives) for key insights (both quantitative and qualitative) for the nitrogenous fertilizers market.
To know about the assumptions considered for the study, download the pdf brochure
The key players that have been profiled in this report include Yara International ASA (Norway), CF Industries Holdings (US), Nutrien [Agrium (Canada) and Potash Corp. of Saskatchewan (Canada)], and EuroChem Group AG (Switzerland).
Target Audience
The stakeholders for the report are as follows:
- Supply-side stakeholders: fertilizer producers, suppliers, distributors, importers, and exporters
- Demand-side stakeholders: Large contract-scale farming companies, farmers and researchers
- Regulatory-side stakeholders: Concerned government authorities and other regulatory bodies
- Other related associations, research organizations and industry bodies: Food and Agriculture Organization (FAO), International Fertilizer Industry Association (IFA), International Fertilizer Society (IFS) and Organization for Economic Co-operation and Development (OECD)
Scope of the report
This research report categorizes the nitrogenous fertilizers market based on type, crop type, application, form, and region.
On the basis of Type, the market has been segmented as follows:
- Urea
- Ammonium Nitrate
- Ammonium Sulfate
- Calcium ammonium nitrate (CAN)
- Others (NPK blends, potassium nitrate, diammonium phosphate (DAP), monoammonium phosphate (MAP), and other nitrogen & phosphate compounds)
On the basis of Crop Type, the market has been segmented as follows:
- Cereals & grains
- Oilseeds & pulses
- Fruits & vegetables
- Others (floriculture crops, permanent crops, plantation crops, pastures, grasslands, and other agricultural cultivation)
On the basis of Application, the market has been segmented as follows:
- Soil
- Foliar
- Fertigation
- Others (aerial application, basal application, and starter solution)
On the basis of Form, the market has been segmented as follows:
- Liquid
- Dry
- Others (granular and pelleted)
On the basis of Region, the market has been segmented as follows:
- North America
- Europe
- Asia Pacific
- South America
- Rest of the World (the Middle East and Africa)
Available Customizations
With the given market data, MarketsandMarkets offers customizations according to the company’s specific scientific needs.
The following customization options are available for the report:
Product Analysis
- Product matrix, which gives a detailed comparison of the product portfolio of each company
Company Information
- Detailed analyses and profiling of additional market players (up to five)
The nitrogenous fertilizers market is projected to grow at a CAGR of 2.33% from 2016, to reach a projected value of USD 126.96 billion by 2022. The growing need to increase the productivity, level yield, and fertilizer intensity gaps across regions, as well as increasing awareness regarding soil profile and nutritional balance backed by government support, are the major drivers for the market.
On the basis of type of nitrogenous fertilizers, urea is most widely used in agriculture and has contributed to nearly 90% of the growth of the nitrogenous fertilizers market in the past decade. Urea is preferred as a substitute for ammonium nitrate and is used widely as farmers have identified it as an economical and easy to use an alternative. Ammonium nitrate is projected to grow at the fastest CAGR between 2016 and 2022, due to its increasing demand attributed to the rapid absorption features of the nitrate compounds by plants, with minimal loss of nutrients as compared to other nitrogen fertilizers. Nitrogen fertilizers have been witnessing traction in the market in the form of slow release and specialty fertilizers along with nitrogen stabilizers to reduce the excessive wastage of these fertilizers.
Dry nitrogenous fertilizers are widely used as they are easily available and inexpensive as compared to the liquid nitrogenous fertilizers. In addition, farmers are becoming aware of the advantages of liquid nitrogenous fertilizers, which include their stability and enhanced efficiency for absorption by crops. This has led to an increase in the demand for liquid nitrogenous fertilizers.
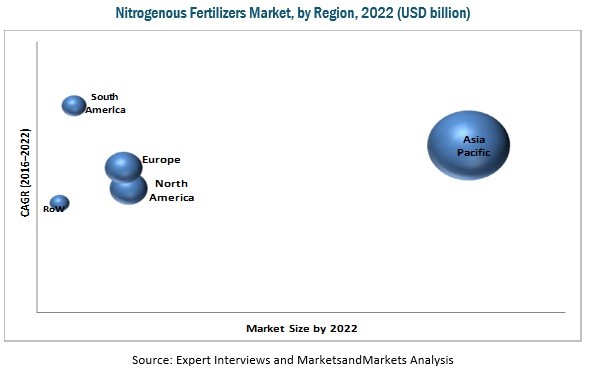
The Asia Pacific region accounted for the largest share of the total nitrogenous fertilizers market in 2015, due to the presence of several leading players producing nitrogenous fertilizers for various applications in the region. South America is expected to grow at the highest CAGR, due to the growing awareness about the advantages of other forms of nitrogenous fertilizers among farmers in the region.
Farmers across the globe use some amount of synthetic or chemical fertilizers to boost productivity. However, the growing trend of preference for organic food that is produced without any synthetic or chemical components or is produced mainly with natural components or biofertilizers has been witnessed in recent years. This is due to growing health awareness, environment protection, food safety, and other related concerns and is made affordable by rising income levels. This, in turn, is projected to impact the nitrogenous fertilizers market during the forecast period.
Over the past years, competition in the nitrogenous fertilizers market has intensified. Yara International ASA (Norway), CF Industries Holdings Inc. (US), Agrium Inc. (Canada), Potash Corp. of Saskatchewan Inc. (Canada), and EuroChem Group AG (Switzerland) are some of the major players dominating the market. Growth in the market for nitrogenous fertilizers is largely driven by strategies such as expansions, acquisitions, and investments & divestments, which improved the product offerings and catered to the demand for nitrogenous fertilizers in various regions.
To speak to our analyst for a discussion on the above findings, click Speak to Analyst
 Exclusive indicates content/data unique to MarketsandMarkets and not available with any competitors.
Table of Contents
1 Introduction (Page No. - 17)
1.1 Objectives of the Study
1.2 Market Definition
1.3 Study Scope
1.4 Periodization Considered for the Study
1.5 Currency
1.6 Units
1.7 Stakeholders
2 Research Methodology (Page No. - 20)
2.1 Introduction
2.2 Research Data
2.2.1 Secondary Data
2.2.1.1 Key Data From Secondary Sources
2.2.2 Primary Data
2.2.2.1 Key Data From Primary Sources
2.2.2.2 Key Industry Insights
2.2.2.3 Breakdown of Primaries
2.3 Macro Indicators
2.3.1 Shrinking Arable Land Area
2.3.2 Growth in Global Population
2.3.3 Rising Food Prices
2.3.4 Increased Reliance on Use of Fertilizers for Productivity Enhancement
2.3.5 Expected Improvement in Non-Fuel Commodity Prices
2.3.6 Downward Trend in Input Prices
2.3.7 Regulatory, Fiscal, and Trade Policy Developments
2.4 Market Size Estimation
2.5 Market Breakdown & Data Triangulation
2.6 Research Assumptions and Limitations
2.6.1 Assumptions
2.6.2 Limitations
3 Executive Summary (Page No. - 39)
4 Premium Insights (Page No. - 45)
4.1 Attractive Opportunities in this Market
4.2 Nitrogenous Fertilizers Markets, By Key Country
4.3 Life Cycle Analysis: Nitrogenous Fertilizers Market, By Region
4.4 Nitrogenous Fertilizers Market, By Type
4.5 Largest and Fastest Growing Nitrogenous Fertilizers Markets, 2016 vs 2022
4.6 Nitrogenous Fertilizers Market, By Type & Region
4.7 Asia-Pacific Nitrogenous Fertilizers Market, By Country & Crop Type
4.8 Nitrogenous Fertilizers Market, By Mode of Application
5 Market Overview (Page No. - 53)
5.1 Introduction
5.2 Market Segmentation
5.2.1 By Type
5.2.2 By Crop Type
5.2.3 By Mode of Application
5.2.4 By Form
5.2.5 By Region
5.3 Market Dynamics
5.3.1 Drivers
5.3.1.1 Need to Increase Productivity and to Level Yield & Fertilizer Intensity Gaps Across Regions
5.3.1.2 Rising Awareness About Soil Profile and Nutritional Balance, Backed By State Support
5.3.2 Restraints
5.3.2.1 Increasing Trend of Organic Consumption
5.3.3 Opportunities
5.3.3.1 Rising Input Demand as A Result of Increasing Investment in Agriculture, Especially in Africa
5.3.4 Challenges
5.3.4.1 Environmental Concerns
5.3.4.2 Unfavorable Regulatory Stance
6 Industry Trends (Page No. - 66)
6.1 Trade Analysis
6.2 Supply Chain
6.3 Porter’s Five Force Analysis
6.3.1 Threat From New Entrants
6.3.2 Threat of Substitutes
6.3.3 Bargaining Power of Suppliers
6.3.4 Bargaining Power of Buyers
6.3.5 Intensity of Competitive Rivalry
7 Nitrogenous Fertilizers Market, By Type (Page No. - 71)
7.1 Introduction
7.2 Urea
7.3 Ammonium Nitrate
7.4 Ammonium Sulfate
7.5 Ammonia
7.6 Calcium Ammonium Nitrate (CAN)
7.7 Others
8 Nitrogenous Fertilizers Market, By Form (Page No. - 79)
8.1 Introduction
8.2 Dry
8.3 Liquid
8.4 Other Forms
9 Nitrogenous Fertilizers Market, By Crop Type (Page No. - 83)
9.1 Introduction
9.2 Cereals & Grains
9.3 Oilseeds & Pulses
9.4 Fruits & Vegetables
9.5 Others
10 Nitrogenous Fertilizers Market, By Mode of Application (Page No. - 94)
10.1 Introduction
10.2 Soil
10.3 Foliar
10.4 Fertigation
10.5 Others
11 Nitrogenous Fertilizers Market, By Region (Page No. - 100)
11.1 Introduction
11.2 North America
11.2.1 U.S.
11.2.2 Canada
11.2.3 Mexico
11.3 Europe
11.3.1 U.K.
11.3.2 Germany
11.3.3 France
11.3.4 Italy
11.3.5 Spain
11.3.6 Rest of Europe
11.4 Asia-Pacific
11.4.1 China
11.4.2 India
11.4.3 Japan
11.4.4 Rest of Asia-Pacific
11.5 South America
11.5.1 Brazil
11.5.2 Argentina
11.5.3 Rest of South America
11.6 Middle East & Africa
11.6.1 Africa
11.6.2 Middle East
12 Competitive Landscape (Page No. - 136)
12.1 Overview
12.2 Competitive Situations & Trends
12.2.1 Acquisitions
12.2.2 Expansions
12.2.3 Investments & Divestments
12.2.4 Agreements
12.2.5 Collaborations & Joint Ventures
12.2.6 New Product Launches
12.3 Vendor Analysis
12.4 Ranking Analysis, By Company
13 Company Profiles (Page No. - 146)
(Company at A Glance, Recent Financials, Products & Services, Strategies & Insights, & Recent Developments)*
13.1 Introduction
13.2 Bunge Limited
13.3 Agrium Inc.
13.4 Yara International ASA
13.5 Potash Corp. of Saskatchewan, Inc.
13.6 Eurochem Group AG
13.7 CF Industries Holdings Inc.
13.8 Sinofert Holdings Limited.
13.9 Coromandel International Ltd.
13.10 CVR Partners, LP
13.11 Koch Industries, Inc.
*Details on Company at A Glance, Recent Financials, Products & Services, Strategies & Insights, & Recent Developments Might Not Be Captured in Case of Unlisted Companies.
14 Appendix (Page No. - 171)
14.1 Insights of Industry Experts
14.2 Discussion Guide
14.3 Knowledge Store: Marketsandmarkets’ Subscription Portal
14.4 Other Developments
14.5 Introducing RT: Real-Time Market Intelligence
14.6 Available Customizations
14.7 Related Reports
14.8 Author Details
List of Tables (84 )
Table 1 Nitrogenous Fertilizers Trade Data, By Largest Exporter, 2011–2015 (USD Million)
Table 2 Nitrogenous Fertilizers Trade Data, By Largest Importer, 2011–2015 (USD Million)
Table 3 Nitrogenous Fertilizers Market Size, By Type, 2014-2022 (USD Billion)
Table 4 Market Size, By Type, 2014-2022 (KT)
Table 5 Urea Fertilizers Market, By Region, 2014–2022 (USD Billion)
Table 6 Ammonium Nitrate Fertilizers Market, By Region, 2014–2022 (USD Billion)
Table 7 Ammonium Sulfate Fertilizers Market, By Region, 2014–2022 (USD Million)
Table 8 Ammonia Fertilizers Market, By Region, 2014–2022 (USD Billion)
Table 9 Calcium Ammonium Nitrate Fertilizers Market, By Region, 2014–2022 (USD Billion)
Table 10 Other Nitrogenous Fertilizers Market, By Region, 2014–2022 (USD Billion)
Table 11 Nitrogenous Fertilizers Market Size, By Form, 2014–2022 (USD Billion)
Table 12 Market Size, By Form, 2014–2022 (KT)
Table 13 Dry Nitrogenous Fertilizers Market Size, By Region, 2014–2022 (USD Billion)
Table 14 Liquid Nitrogenous Market Size, By Region, 2014–2022 (USD Million)
Table 15 Other Forms: Nitrogenous Market Size, By Region, 2014–2022 (USD Million)
Table 16 Nitrogenous Fertilizers Market Size, By Crop Type, 2014-2022 (USD Billion)
Table 17 Market Size, By Crop Type, 2014-2022 (KT)
Table 18 Cereals & Grains Market Size, By Region, 2014-2022 (USD Billion)
Table 19 Cereals & Grains Market Size, By Type, 2014-2022 (USD Billion)
Table 20 Oilseeds & Pulses Market Size, By Region, 2014-2022 (USD Billion)
Table 21 Oilseeds & Pulses Market Size, By Type, 2014-2022 (USD Billion)
Table 22 Fruits & Vegetables Market Size, By Region, 2014-2022 (USD Billion)
Table 23 Fruits & Vegetables Market Size, By Type, 2014-2022 (USD Billion)
Table 24 Nitrogenous Fertilizers Market Size for Other Crop Types, By Region, 2014-2022 (USD Billion)
Table 25 Nitrogenous Fertilizers Market Size, By Mode of Application, 2014-2021 (USD Billion)
Table 26 Market Size, By Mode of Application, 2014-2022 (KT)
Table 27 Soil: Nitrogenous Fertilizers Market Size, By Region, 2014-2022 (USD Billion)
Table 28 Foliar: Nitrogenous Fertilizers Market Size, By Region, 2014-2022 (USD Million)
Table 29 Fertigation: Nitrogenous Fertilizers Market Size, By Region, 2014-2022 (USD Million)
Table 30 Other Modes of Application: Nitrogenous Fertilizers Market Size, By Region, 2014-2022 (USD Million)
Table 31 Nitrogenous Fertilizers Market Size, By Region, 2014-2022 (USD Billion)
Table 32 Market Size, By Region, 2014-2022 (KT)
Table 33 North America: Nitrogenous Fertilizers Market Size, By Country, 2014-2022 (USD Billion)
Table 34 North America: Market Size, By Type, 2014-2022 (USD Million)
Table 35 North America: Market Size, By Form, 2014-2022 (USD Million)
Table 36 North America: Market Size, By Mode of Application, 2014-2022 (USD Million)
Table 37 North America: Market Size, By Crop Type, 2014-2022 (USD Billion)
Table 38 U.S.: Nitrogenous Fertilizers Market Size, By Type, 2014–2022 (USD Million)
Table 39 Canada: Market Size, By Type, 2014–2022 (USD Million)
Table 40 Mexico: Market Size, By Type, 2014–2022 (USD Billion)
Table 41 Europe: Nitrogenous Fertilizers Market Size, By Country, 2014–2022 (USD Billion)
Table 42 Europe: Market Size, By Type, 2014–2022 (USD Million)
Table 43 Europe: Market Size, By Mode of Application, 2014–2022 (USD Billion)
Table 44 Europe: Market Size, By Crop Type, 2014–2022 (USD Billion)
Table 45 Europe: Market Size, By Form, 2014–2022 (USD Billion)
Table 46 U.K.: Nitrogenous Fertilizers Market Size, By Type, 2014–2022 (USD Million)
Table 47 Germany: Market Size, By Type, 2014–2022 (USD Billion)
Table 48 France: Nitrogenous Fertilizers Market Size, By Type, 2014–2022 (USD Million)
Table 49 Italy: Market Size, By Type, 2014–2022 (USD Billion)
Table 50 Spain: Nitrogenous Fertilizers Market Size, By Type, 2014–2022 (USD Million)
Table 51 Rest of Europe: Market Size, By Type, 2014–2022 (USD Million)
Table 52 Asia-Pacific: Nitrogenous Fertilizers Market Size, By Country, 2014–2022 (USD Billion)
Table 53 Asia-Pacific: Market Size, By Type, 2014-2022 (USD Billion)
Table 54 Asia-Pacific: Market Size, By Mode of Application, 2014–2022 (USD Billion)
Table 55 Asia-Pacific: Market Size, By Crop Type, 2014–2022 (USD Billion)
Table 56 Asia-Pacific: Market Size, By Form, 2014–2022 (USD Billion)
Table 57 China: Nitrogenous Fertilizers Market Size, By Type, 2014–2022 (USD Billion)
Table 58 India: Market Size, By Type, 2014–2022 (USD Billion)
Table 59 Japan: Market Size, By Type, 2014–2022 (USD Billion)
Table 60 Rest of Asia-Pacific: Nitrogenous Fertilizers Market Size, By Type, 2014–2022 (USD Billion)
Table 61 South America: Nitrogenous Fertilizers Market Size, By Country, 2014–2022 (USD Billion)
Table 62 South America: Market Size, By Type, 2014–2022 (USD Billion)
Table 63 South America: Market Size, By Mode of Application, 2014–2022 (USD Billion)
Table 64 South America: Market Size, By Crop Type, 2014–2022 (USD Billion)
Table 65 South America: Market Size, By Form, 2014–2022 (USD Billion)
Table 66 Brazil: Nitrogenous Fertilizers Market Size, By Type, 2014–2022 (USD Billion)
Table 67 Argentina: Market Size, By Type, 2014–2022 (USD Million)
Table 68 Rest of South America: Nitrogenous Fertilizers Market Size, By Type, 2014–2022 (USD Million)
Table 69 Middle East & Africa: Nitrogenous Fertilizers Market Size, By Region, 2014–2022 (USD Billion)
Table 70 Middle East & Africa: Market Size, By Type, 2014–2022 (USD Million)
Table 71 Middle East & Africa: Market Size, By Mode of Application, 2014–2022 (USD Million)
Table 72 Middle East & Africa: Market Size, By Crop Type, 2014–2022 (USD Million)
Table 73 Middle East & Africa: Market Size, By Form, 2014–2022 (USD Million)
Table 74 Africa: Nitrogenous Fertilizers Market Size, By Type, 2014–2022(USD Million)
Table 75 Middle East: Nitrogenous Fertilizers Market Size, By Type, 2014–2022 (USD Million)
Table 76 Acquisitions, 2011–2016
Table 77 Expansions, 2011–2016
Table 78 Investments & Divestments, 2011–2016
Table 79 Agreement, 2011–2016
Table 80 Collaborations & Joint Ventures, 2011–2016
Table 81 New Product Launches, 2011–2016
Table 82 Top Five Companies in the Nitrogenous Fertilizers Market, on the Basis of Production Capacity and Products
Table 83 Acquisitions
Table 84 Expansions, 2011–2016
List of Figures (80 Figures)
Figure 1 Market Segmentation
Figure 2 Nitrogenous Fertilizers Market: Research Design
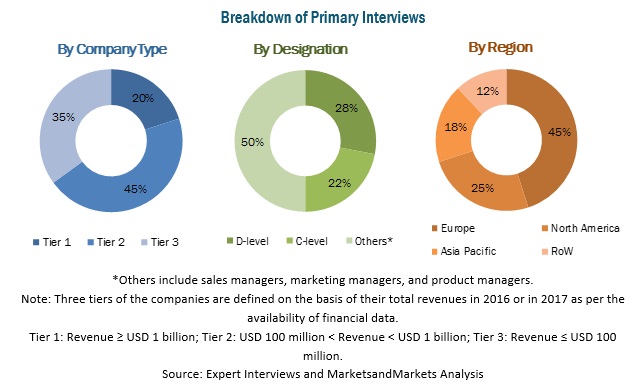
Figure 3 Breakdown of Primary Interviews, By Company Type, Designation, and Region
Figure 4 Global Arable Land Area, 1985–2014
Figure 5 Arable Land Area, Decadal Average (1965–2014)
Figure 6 Per Capita Arable Land (1961–2013)
Figure 7 Population Growth Trend, 1950–2100
Figure 8 Global Food Price Index
Figure 9 Fertilizer Consumption (Kilograms Per Hectare of Arable Land)
Figure 10 Global Fertilizer Price Index
Figure 11 Oil & Non-Fuel Commodity Price, 2015–2017 (Percentage Change Over Previous Year)
Figure 12 Natural Gas Price Trend (2005–2016)
Figure 13 Market Size Estimation Methodology: Bottom-Up Approach
Figure 14 Market Size Estimation Methodology: Top-Down Approach
Figure 15 Data Triangulation Methodology
Figure 16 Nitrogenous Fertilizers Market Size, By Type, 2016 vs 2022
Figure 17 Fruits & Vegetables Segment is Projected to Be the Fastest-Growing From 2016 to 2022
Figure 18 Dry Segment is Projected to Dominate the Market From 2016 to 2022
Figure 19 Soil Segment is Estimated to Dominate the Market for Nitrogenous Fertilizers in 2016
Figure 20 Asia-Pacific is Expected to Be the Largest Market, 2014–2022 (USD Billion)
Figure 21 South America is Projected to Be the Fastest-Growing Nitrogenous Fertilizers Market From 2016 to 2022
Figure 22 Nitrogenous Fertilizers: an Emerging Market With Promising Growth Potential, 2016-2022
Figure 23 China Accounted for the Largest Share in the Nitrogenous Fertilizers Market in 2015
Figure 24 Nitrogenous Fertilizers Market in Asia-Pacific is Experiencing High Growth
Figure 25 Urea is Expected to Dominate the Market Throughout the Forecast Period
Figure 26 India & Brazil are Projected to Be the Most Attractive Markets for Nitrogenous Fertilizers During the Forecast Period
Figure 27 Asia-Pacific Accounted for the Largest Share in the Urea Segment in 2015
Figure 28 Large Availability of Agricultural Land and Increased Nutrient Deficiency in the Soil Strengthened the Demand for Nitrogenous Fertilizers in the Asia-Pacific Region
Figure 29 Soil Segment is Projected to Be the Largest Throughout the Forecast Period
Figure 30 Nitrogenous Fertilizers Market Segmentation, By Type
Figure 31 Market Segmentation, By Crop Type
Figure 32 Market Segmentation, By Mode of Application
Figure 33 Market Segmentation, By Form
Figure 34 Market Segmentation, By Region
Figure 35 Nitrogenous Fertilizers Market
Figure 36 Corn Yield Comparison, By Country (2014)
Figure 37 Wheat Yield Comparison, By Country (2014)
Figure 38 Rice Yield Comparison, By Country (2014)
Figure 39 Soybean Yield Comparison, By Country (2014)
Figure 40 Global FDI Inflow (2010-15)
Figure 41 Global and African Inward FDI Stock, Sectoral Distribution (2014)
Figure 42 FDI Inflow in Africa, By Region, 2010-2015 (USD Million)
Figure 43 Nitrogenous Fertilizers: Supply Chain
Figure 44 Nitrogenous Fertilizers: Porter’s Five Force Analysis
Figure 45 Nitrogenous Fertilizers, By Type, 2016 vs 2022
Figure 46 Urea: Nitrogenous Fertilizers Market in 2015
Figure 47 Demand for Cereals & Grains is Expected to Dominate the Global Nitrogenous Fertilizers Market From 2016 to 2022
Figure 48 Brazil: Demand for Nitrogenous Fertilizers in the Production of Cereals, 2010-2020 (Tons/KT)
Figure 49 Cereal Production in EU Countries, 2014
Figure 50 Asia-Pacific to Be the Largest Market for Cereals & Grains, 2016 vs 2022
Figure 51 Global Production of Major Oilseed Crops, 2010 to 2014 (Million Tons)
Figure 52 Global Fruit Production, By Region, 2013 (Million Metric Tons)
Figure 53 Global Production of Vegetables and Melons, 1990 to 2013 (Million Metric Tons)
Figure 54 Fertigation is Projected to Be the Fastest-Gorwing Market, 2016-2022
Figure 55 Geographic Snapshot (2016-2022): India, Brazil, and Japan Emerging as New Hotspots
Figure 56 Soil Types in the U.S.
Figure 57 Fertilizer Production Trend in Canada
Figure 58 Asia-Pacific Nitrogenous Fertilizers Market Snapshot
Figure 59 South America: Nitrogenous Fertilizers Market Snapshot
Figure 60 Acquisition is the Key Startegy Adopted By the Key Players in the Market
Figure 61 Acquisitions: the Key Strategy, 2011–2016
Figure 62 Nitrogenous Fertilizers Market: Annual Developments, 2011–2016
Figure 63 Vendor Analysis: Criteria Weightage
Figure 64 Product Offerings Comparison
Figure 65 Business Strategy Comparison
Figure 66 Geographical Revenue Mix of Top 4 Market Players
Figure 67 Bunge Limited: Company Snapshot
Figure 68 Bunge Limited: SWOT Analysis
Figure 69 Agrium Inc.: Company Snapshot
Figure 70 Agrium Inc. : SWOT Analysis
Figure 71 Yara International ASA: Company Snapshot
Figure 72 Yara International ASA: SWOT Analysis
Figure 73 Potash Corp. of Saskatchewan, Inc.: Company Snapshot
Figure 74 Potash Corp. of Saskatchewan, Inc.: SWOT Analysis
Figure 75 Eurochem Group AG: Company Snapshot
Figure 76 Eurochem Group AG: SWOT Analysis
Figure 77 CF Industries Holdings Inc.: Company Snapshot
Figure 78 Sinofert Holdings Limited.: Company Snapshot
Figure 79 Coromandel International Ltd.: Company Snapshot
Figure 80 CVR Partners, LP: Company Snapshot


Growth opportunities and latent adjacency in Nitrogenous Fertilizers Market