Concrete Bonding Agents Market by Agent (Cementitious Latex Based, and Epoxy Based), Application (Repairing, Flooring, Decorative, and Marine) and Region - Global Forecast to 2026


[166 Pages Report] The global concrete bonding agents market was valued at USD 2.48 Billion in 2015 and is projected to reach USD 5.87 Billion by 2026, at a CAGR of 8.2% from 2016 to 2026. The market size in terms of volume was 3,991.4 KT in 2015 and is projected to reach 8,038.4 KT, by 2026, at a CAGR of 6.6% during the same period. In this study, 2015 has been considered the base year and 2021, and 2026 as the forecast years to estimate the market sizes of concrete bonding agents for the midterm forecast period, 2016 - 2021, and the long term period, 2016 - 2026.
The objectives of the study are:
- To define and segment the global market of concrete bonding agents by agent, application, and region
- To estimate and forecast the global concrete bonding agents market by application at country-level in different regions, namely, North America, the Asia-Pacific, Europe, South America, and Middle East & Africa
- To estimate and forecast the market size of concrete bonding agents, in terms of value (USD billion), and volume (Kilotons), at global and regional-levels
- To estimate and forecast the market of concrete bonding agents, in terms of value (USD billion), and volume (Kilotons), at country-level
- To identify and analyze the key growth drivers, restraints, opportunities, and challenges influencing the global concrete bonding agents market.
- To analyze recent market developments and competitive strategies, such as expansions, product launches/developments, agreements/collaborations, and mergers & acquisitions to draw the competitive landscape in the global concrete bonding agents market
- To strategically identify and profile the key market players and analyze their core competencies in each type and application of the global concrete bonding agents market
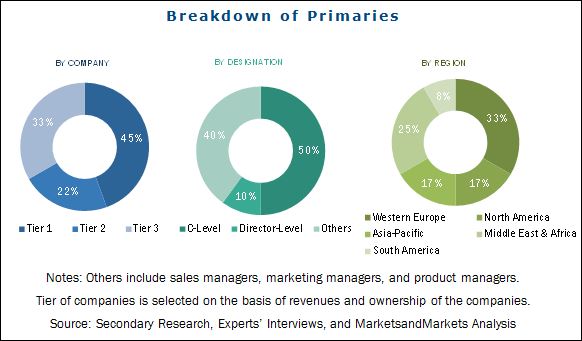
Different secondary sources such as company websites, encyclopedia, directories, and database such as Hoovers, Bloomberg, Businessweek, Factiva, and OneSource have been used to identify and collect information useful for this extensive commercial study of the global concrete bonding agents market. The primary sources, including experts from related industries, have been interviewed to verify and collect critical information and assess the future prospects of the market. The top-down approach has been implemented to validate the market size in terms of value. With the data triangulation procedure and validation of data through primaries, the exact values of the overall parent market size and individual market sizes have been determined and confirmed in this study.
To know about the assumptions considered for the study, download the pdf brochure
The concrete bonding agents market has a diversified and established ecosystem of its upstream players such as the raw material suppliers, and downstream stakeholders such as manufacturers, vendors, end-users, and government organizations.
This study answers several questions for the stakeholders, primarily which market segments they should focus upon during the next two to five years to prioritize their efforts and investments. These stakeholders include concrete bonding agents manufacturers such as Sika AG (Switzerland), Fosroc International Ltd. (U.K), BASF SE (Germany), Saint-Gobain Weber S.A. (France), Mapei S.p.A. (Italy), Dow Construction Chemicals (U.S), LafargeHolcim (Switzerland), The Euclid Chemical Company (U.S), GCP Applied Technologies Inc. (U.S), Dow Corning Corporation (U.S), The Quikrete Companies, Inc. (U.S).
Key Target Audience:
- Regional manufacturers’ associations and general concrete bonding agents associations
- Raw material manufacturers
- Traders, distributors, and suppliers of concrete bonding agents
- Government and regional agencies and research organizations
Scope of the Report:
This research report categorizes the global concrete bonding agents market based on agent, application, and region, and forecasts the revenue growth and provides an analysis of trends in each of the submarkets.
On the Basis of Agent:
- Cementitious latex based
- Epoxy based
Each agent is further described in detail in the report with value forecasts until 2021
On the Basis of Application:
- Repairing
- Flooring
- Decorative
- Marine
Each application segment is further described in detail in the report, with value forecasts until 2021.
On the Basis of Region:
- Europe
- North America
- Asia-Pacific
- South America
- Middle East & Africa
- Others
Each region is further segmented by key countries such as the U.S., Mexico, Canada, China, Japan, South Korea, India, Australia, Germany, the U.K., Italy, France, Turkey, Russia, Saudi Arabia, UAE, Argentina, and Brazil.
Available Customizations: The following customization options are available for the report:
- Company Information
Analysis and profiles of additional global as well as regional market players (up to three)
The global concrete bonding agents market is projected to reach USD 5.87 Billion by 2026, at a CAGR of 8.2%. It is projected to reach 8,038.4 KT, at a CAGR of 6.6% from 2016 to 2026 by volume. Rising incomes of the middle class population in emerging countries such as India, Thailand, Indonesia, and Vietnam and the preference in repairing existing infrastructure rather than constructing new ones are the key factors driving the global concrete bonding agents market.
The cementitious latex based concrete bonding agent was the largest bonding agent in 2015 due to the appreciable adhesion it imparts to new concrete when it is adhered to the existing concrete. Cementitious latex based bonding agents are cost-effective and their availability in a variety of formulations drives the demand in the global concrete bonding agents market. Moreover they are highly compatible with concrete admixtures.
Repairing is estimated to be the largest application of concrete bonding agents. Exposure to diverse climatic changes and pollution often lead to the early failure in concrete compaction and damage. Thus, timely reparation is imperative to maintain the infrastructure for generations. Concrete bonding agents are extensively used in the repairing application, making it the largest application in the global concrete bonding agents market.
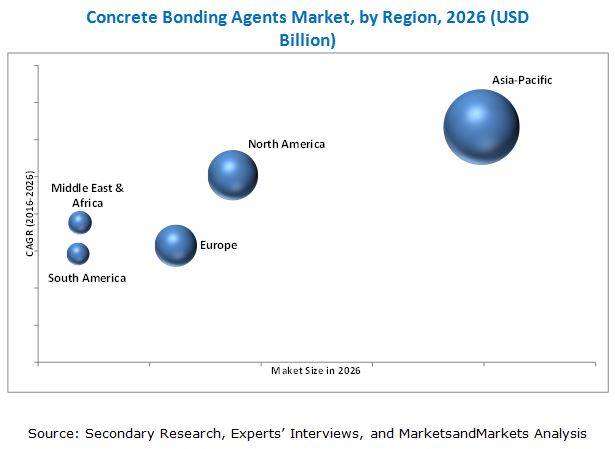
The Asia-Pacific region led the global concrete bonding agents market, both, in terms of value and volume, in 2015. China is the largest market for concrete bonding agents in the Asia-Pacific region, and accounted for a major share of the market in terms of value, in 2015. The growing construction sector, increasing R&D activities initiated by major players, the ease of availability of raw material, and increasing development strategies to meet the demand for concrete bonding agents in the established and emerging applications are the key growth drivers for concrete bonding agents in this region.
Although the global concrete bonding agents market is growing rapidly, a few factors restrain growth. Poor and inadequate workmanship and lack of awareness in the choice of repair materials used, are some of the factors restraining the growth of the global concrete bonding agents market.
Sika AG (Switzerland), Fosroc International Ltd. (U.K), BASF SE (Germany), Saint-Gobain Weber S.A. (France), Mapei S.p.A. (Italy), led the global concrete bonding agents market. The diverse product portfolios, strategically positioned R&D centers, adoption of development strategies, and technological advancements, are some of the factors that strengthen the market positions of these companies in the global concrete bonding agents market. They have been adopting various organic and inorganic growth strategies to enhance their shares in the global concrete bonding agents market.
To speak to our analyst for a discussion on the above findings, click Speak to Analyst
 Exclusive indicates content/data unique to MarketsandMarkets and not available with any competitors.
Table of Contents
1 Introduction (Page No. - 16)
1.1 Objectives of the Study
1.2 Market Definition
1.3 Market Scope
1.3.1 Markets Covered
1.3.2 Years Considered for the Study
1.4 Currency
1.5 Packaging
1.6 Limitations
1.7 Stakeholders
2 Research Methodology (Page No. - 19)
2.1 Research Data
2.1.1 Secondary Data
2.1.1.1 Key Data From Secondary Sources
2.1.2 Primary Data
2.1.2.1 Key Data From Primary Sources
2.1.2.2 Key Industry Insights
2.1.2.3 Breakdown of Primary Interviews
2.2 Market Size Estimation
2.3 Data Triangulation
2.4 Research Assumptions
3 Executive Summary (Page No. - 27)
4 Premium Insights (Page No. - 31)
4.1 Attractive Market Opportunities in the Concrete Bonding Agents Market
4.2 Concrete Bonding Agents Market, By Region (2016–2021)
4.3 Concrete Bonding Agents Market in Asia-Pacific, 2015
4.4 Concrete Bonding Agents Market: Emerging vs Mature Markets
4.5 Fastest-Growing Markets, By Application
5 Market Overview (Page No. - 36)
5.1 Introduction
5.2 Market Segmentation
5.2.1 By Agent
5.2.2 By Application
5.2.3 By Region
5.3 Market Dynamics
5.3.1 Drivers
5.3.1.1 Short-Term Driver
5.3.1.1.1 High Compatibility of Concrete Bonding Agents With Portland Cement and Other Hydraulic Cements
5.3.1.2 Mid-Term Driver
5.3.1.2.1 Preference for Repairing Old Infrastructure Instead of New Construction
5.3.1.3 Long-Term Driver
5.3.1.3.1 Rising Income of People Leading to Growth in Infrastructural Development in Emerging Economies
5.3.2 Restraints
5.3.2.1 Poor and Inadequate Workmanship
5.3.2.2 Lack of Awareness Regarding the Choice of Repairing Materials Leading to Premature Failure Or De-Bonding
5.3.3 Opportunities
5.3.3.1 High Investment Made By Government on Repair & Maintenance
5.3.4 Challenges
5.3.4.1 Economic Downturn in Europe
5.4 Revenue Pocket Matrix
6 Industry Trends (Page No. - 43)
6.1 Introduction
6.2 Value Chain Analysis
6.2.1 Raw Material Analysis
6.2.2 Manufacturers
6.2.3 Distribution Channel
6.2.4 End Users
6.3 Porter’s Five Forces Analysis
6.3.1 Threat of New Entrants
6.3.2 Bargaining Power of Buyers
6.3.3 Threat of Substitutes
6.3.4 Bargaining Power of Suppliers
6.3.5 Intensity of Rivalry
6.4 Patent Analysis
6.5 Macro Economic Overview
6.5.1 Introduction
6.5.2 Trends and Forecast of the Construction Industry
6.5.3 U.K. and Germany to Spend the Largest Amount for Growth of the Construction Industry, in Europe
6.5.4 China and India to Spend the Largest Amount for the Construction Industry in Asia-Pacific
6.5.5 Turkey and Saudi Arabia to Spend the Largest Amount for Construction Industry in the Middle East & Africa
6.5.6 Brazil to Spend the Largest Amount for Construction Industry in South America
7 Method of Application (Page No. - 55)
7.1 Introduction
7.1.1 Manual
7.1.2 Spraying
7.1.3 Pouring
8 Concrete Bonding Agents Market, By Agent (Page No. - 56)
8.1 Introduction
8.2 Cementitious Latex Based Agents
8.3 Epoxy Based Agents
9 Concrete Bonding Agents Market, By Application (Page No. - 63)
9.1 Introduction
9.2 Repairing
9.3 Decorative
9.4 Flooring
9.5 Marine
10 Concrete Bonding Agents Market, By Region (Page No. - 72)
10.1 Introduction
10.2 North America
10.2.1 U.S.
10.2.2 Canada
10.2.3 Mexico
10.3 Europe
10.3.1 Germany
10.3.2 Italy
10.3.3 U.K.
10.3.4 France
10.3.5 Russia
10.3.6 Turkey
10.3.7 Rest of Europe
10.4 Asia-Pacific
10.4.1 China
10.4.2 Japan
10.4.3 Australia
10.4.4 India
10.4.5 South Korea
10.4.6 Rest of Asia-Pacific
10.5 South America
10.5.1 Brazil
10.5.2 Argentina
10.5.3 Rest of South America
10.6 Middle East & Africa
10.6.1 Saudi Arabia
10.6.2 UAE
10.6.3 Rest of the Middle East & Africa
11 Competitive Landscape (Page No. - 116)
11.1 Overview
11.2 Market Evolution Framework: New Product Launches/Developments and Expansions Have Led the Market Growth, 2011–2016
11.3 Expansions is the Most Preferred Growth Strategy, 2011–2016
11.4 Competitive Situations and Trends
11.4.1 New Product Launches/Development
11.4.2 Expansions
11.4.3 Agreements & Joint Ventures
11.4.4 Mergers & Acquisitions
12 Company Profiles (Page No. - 124)
(Overview, Financial*, Products & Services, Strategy, and Developments)
12.1 Sika AG
12.2 Fosroc International Ltd.
12.3 Saint-Gobain Weber S.A.
12.4 Mapei S.P.A.
12.5 BASF SE
12.6 Lafargeholcim
12.7 The DOW Chemical Company
12.8 DOW Corning Corporation
12.9 GCP Applied Technologies, Inc.
12.10 The Euclid Chemical Company
12.11 The Quikrete Companies, Inc.
12.12 Additional Company Profiles
*Details Might Not Be Captured in Case of Unlisted Companies.
13 Appendix (Page No. - 156)
13.1 Insights From Industry Experts
13.2 Discussion Guide
13.3 Knowledge Store: Marketsandmarkets Subscription Portal
13.4 Introducing RT: Real Time Market Intelligence
13.5 Available Customizations
13.6 Related Reports
13.7 Author Details
List of Tables (127 Tables)
Table 1 Concrete Bonding Agents Market, By Agent
Table 2 Concrete Bonding Agents Market, By Application
Table 3 North America: Construction Spending, By Country, 2014–2021 (USD Billion)
Table 4 Europe: Construction Spending, By Country, 2014–2021 (USD Billion)
Table 5 Asia-Pacific: Construction Spending, By Country, 2014–2021 (USD Billion)
Table 6 Middle East & Africa: Construction Spending, By Country GDP, 2014–2021 (USD Billion)
Table 7 South America: Construction Spending, By Country, 2014–2021 (USD Billion)
Table 8 Concrete Bonding Agents Market Size, By Agent, 2014–2026 (USD Million)
Table 9 Concrete Bonding Agents Market Size, By Agent, 2014–2026 (Kiloton)
Table 10 Cementitious Latex Based Concrete Bonding Agents Market Size, By Region, 2014–2026 (USD Million)
Table 11 Cementitious Latex Based Concrete Bonding Agents Market Size, By Region, 2014–2026 (Kiloton)
Table 12 Epoxy Based Concrete Bonding Agents Market Size, By Region, 2014–2026 (USD Million)
Table 13 Epoxy Based Concrete Bonding Agents Market Size, By Region, 2014–2026 (Kiloton)
Table 14 Concrete Bonding Agents Market Size, By Application, 2014–2026 (USD Million)
Table 15 Concrete Bonding Agents Market Size, By Application, 2014–2026 (Kiloton)
Table 16 Concrete Bonding Agents Market Size in Repairing, By Region, 2014–2026 (USD Million)
Table 17 Concrete Bonding Agents Market Size in Repairing, By Region, 2014–2026 (Kiloton)
Table 18 Concrete Bonding Agents Market Size in Decorative, By Region, 2014–2026 (USD Million)
Table 19 Concrete Bonding Agents Market Size in Decorative, By Region, 2014–2026 (Kiloton)
Table 20 Concrete Bonding Agents Market Size in Flooring, By Region, 2014–2026 (USD Million)
Table 21 Concrete Bonding Agents Market Size in Flooring, By Region, 2014–2026 (Kiloton)
Table 22 Concrete Bonding Agents Market Size in Marine, By Region, 2014–2026 (USD Million)
Table 23 Concrete Bonding Agents Market Size in Marine, By Region, 2014–2026 (Kiloton)
Table 24 Concrete Bonding Agents Market Size, By Region, 2014–2026 (USD Million)
Table 25 Concrete Bonding Agents Market Size, By Region, 2014–2026 (Kiloton)
Table 26 North America: By Market Size, By Country, 2014–2026 (USD Million)
Table 27 North America: By Market Size, By Country, 2014–2026 (Kiloton)
Table 28 U.S.: By Market Size, By Agent, 2014–2026 (USD Million)
Table 29 U.S.: By Market Size, By Agent, 2014–2026 (Kiloton)
Table 30 U.S.: By Market Size, By Application, 2014–2026 (USD Million)
Table 31 U.S.: By Market Size, By Application, 2014–2026 (Kiloton)
Table 32 Canada: By Market Size, By Agent, 2014–2026 (USD Million)
Table 33 Canada: By Market Size, By Agent, 2014–2026 (Kiloton)
Table 34 Canada: By Market Size, By Application, 2014–2026 (USD Million)
Table 35 Canada: By Market Size, By Application, 2014–2026 (Kiloton)
Table 36 Mexico: By Market Size, By Agent, 2014–2026 (USD Million)
Table 37 Mexico: By Market Size, By Agent, 2014–2026 (Kiloton)
Table 38 Mexico: By Market Size, By Application, 2014–2026 (USD Million)
Table 39 Mexico: By Market Size, By Application, 2014–2026 (Kiloton)
Table 40 Europe: By Market Size, By Country, 2014–2026 (USD Million)
Table 41 Europe: By Market Size, By Country, 2014–2026 (Kiloton)
Table 42 Germany: By Market Size, By Agent, 2014–2026 (USD Million)
Table 43 Germany: By Market Size, By Agent, 2014–2026 (Kiloton)
Table 44 Germany: By Market Size, By Application, 2014–2026 (USD Million)
Table 45 Germany: By Market Size, By Application, 2014–2026 (Kiloton)
Table 46 Italy: By Market Size, By Agent, 2014–2026 (USD Million)
Table 47 Italy: By Market Size, By Agent, 2014–2026 (Kiloton)
Table 48 Italy: By Market Size, By Application, 2014–2026 (USD Million)
Table 49 Italy: By Market Size, By Application, 2014–2026 (Kiloton)
Table 50 U.K.: By Market Size, By Agent, 2014–2026 (USD Million)
Table 51 U.K.: By Market Size, By Agent, 2014–2026 (Kiloton)
Table 52 U.K.: By Market Size, By Application, 2014–2026 (USD Million)
Table 53 U.K.: By Market Size, By Application, 2014–2026 (Kiloton)
Table 54 France: By Market Size, By Agent, 2014–2026 (USD Million)
Table 55 France: By Market Size, By Agent, 2014–2026 (Kiloton)
Table 56 France: By gents Market Size, By Application, 2014–2026 (USD Million)
Table 57 France: By Market Size, By Application, 2014–2026 (Kiloton)
Table 58 Russia: By Market Size, By Agent, 2014–2026 (USD Million)
Table 59 Russia: By Market Size, By Agent, 2014–2026 (Kiloton)
Table 60 Russia: By Market Size, By Application, 2014–2026 (USD Million)
Table 61 Russia: By Market Size, By Application, 2014–2026 (Kiloton)
Table 62 Turkey: By Market Size, By Agent, 2014–2026 (USD Million)
Table 63 Turkey: By Market Size, By Agent, 2014–2026 (Kiloton)
Table 64 Turkey: By Market Size, By Application, 2014–2026 (USD Million)
Table 65 Turkey: By Market Size, By Application, 2014–2026 (Kiloton)
Table 66 Rest of Europe: By Market Size, By Agent, 2014–2026 (USD Million)
Table 67 Rest of Europe: By Market Size, By Agent, 2014–2026 (Kiloton)
Table 68 Rest of Europe: By Market Size, By Application, 2014–2026 (USD Million)
Table 69 Rest of Europe: By Market Size, By Application, 2014–2026 (Kiloton)
Table 70 Asia-Pacific: By Market Size, By Country, 2014–2026 (USD Million)
Table 71 Asia-Pacific: By Market Size, By Country, 2014–2026 (Kiloton)
Table 72 China: By Market Size, By Agent, 2014–2026 (USD Million)
Table 73 China: By Market Size, By Agent, 2014–2026 (Kiloton)
Table 74 China: By Market Size, By Application, 2014–2026 (USD Million)
Table 75 China: By Market Size, By Application, 2014–2026 (Kiloton)
Table 76 Japan: By Market Size, By Agent, 2014–2026 (USD Million)
Table 77 Japan: By Market Size, By Agent, 2014–2026 (Kiloton)
Table 78 Japan: By Market Size, By Application, 2014–2026 (USD Million)
Table 79 Japan: By Market Size, By Application, 2014–2026 (Kiloton)
Table 80 Australia: By Market Size, By Agent, 2014–2026 (USD Million)
Table 81 Australia: By Market Size, By Agent, 2014–2026 (Kiloton)
Table 82 Australia: By Market Size, By Application, 2014–2026 (USD Million)
Table 83 Australia: By Market Size, By Application, 2014–2026 (Kiloton)
Table 84 India: By Market Size, By Agent, 2014–2026 (USD Million)
Table 85 India: By Market Size, By Agent, 2014–2026 (Kiloton)
Table 86 India: By Market Size, By Application, 2014–2026 (USD Million)
Table 87 India: By Market Size, By Application, 2014–2026 (Kiloton)
Table 88 South Korea: By Market Size, By Agent, 2014–2026 (USD Million)
Table 89 South Korea: By Market Size, By Agent, 2014–2026 (Kiloton)
Table 90 South Korea: By Market Size, By Application, 2014–2026 (USD Million)
Table 91 South Korea: By Market Size, By Application, 2014–2026 (Kiloton)
Table 92 Rest of Asia-Pacific: By Market Size, By Agent, 2014–2026 (USD Million)
Table 93 Rest of Asia-Pacific: By Market Size, By Agent, 2014–2026 (Kiloton)
Table 94 Rest of Asia-Pacific: By Market Size, By Application, 2014–2026 (USD Million)
Table 95 Rest of Asia-Pacific: By Market Size, By Application, 2014–2026 (Kiloton)
Table 96 South America: By Market Size, By Country, 2014–2026 (USD Million)
Table 97 South America: By Market Size, By Country, 2014–2026 (Kiloton)
Table 98 Brazil: By gents Market Size, By Agent, 2014–2026 (USD Million)
Table 99 Brazil: By Market Size, By Agent, 2014–2026 (Kiloton)
Table 100 Brazil: By Market Size, By Application, 2014–2026 (USD Million)
Table 101 Brazil: By Market Size, By Application, 2014–2026 (Kiloton)
Table 102 Argentina: Concrete Bonding Agents Market Size, By Agent, 2014–2026 (USD Million)
Table 103 Argentina: Concrete Bonding Agents Market Size, By Agent, 2014–2026 (Kiloton)
Table 104 Argentina: Concrete Bonding Agents Market Size, By Application, 2014–2026 (USD Million)
Table 105 Argentina: Concrete Bonding Agents Market Size, By Application, 2014–2026 (Kiloton)
Table 106 Rest of South America: By Market Size, By Agent, 2014–2026 (USD Million)
Table 107 Rest of South America: By Market Size, By Agent, 2014–2026 (Kiloton)
Table 108 Rest of South America: By Market Size, By Application, 2014–2026 (USD Million)
Table 109 Rest of South America: By Market Size, By Application, 2014–2026 (Kiloton)
Table 110 Middle East & Africa: Concrete Bonding Agents Market Size, By Country, 2014–2026 (USD Million)
Table 111 Middle East & Africa: Concrete Bonding Agents Market Size, By Country, 2014–2026 (Kiloton)
Table 112 Saudi Arabia: By Market Size, By Agent, 2014–2026 (USD Million)
Table 113 Saudi Arabia: By Market Size, By Agent, 2014–2026 (Kiloton)
Table 114 Saudi Arabia: By Market Size, By Application, 2014–2026 (USD Million)
Table 115 Saudi Arabia: By Market Size, By Application, 2014–2026 (Kiloton)
Table 116 UAE: Concrete Bonding Agents Market Size, By Agent, 2014–2026 (USD Million)
Table 117 UAE: Concrete Bonding Agents Market Size, By Agent, 2014–2021 (Kiloton)
Table 118 UAE: Concrete Bonding Agents Market Size, By Application, 2014–2026 (USD Million)
Table 119 UAE: Concrete Bonding Agents Market Size, By Application, 2014–2026 (Kiloton)
Table 120 Rest of the Middle East & Africa: Concrete Bonding Agents Market Size, By Agent, 2014–2026 (USD Million)
Table 121 Rest of the Middle East & Africa: Concrete Bonding Agents Market Size, By Agent, 2014–2021 (Kiloton)
Table 122 Rest of the Middle East & Africa: Concrete Bonding Agents Market Size, By Application, 2014–2026 (USD Million)
Table 123 Rest of the Middle East & Africa: Concrete Bonding Agents Market Size, By Application, 2014–2026 (Kiloton)
Table 124 New Product Launches/Development, 2011–2016
Table 125 Expansions, 2011–2016
Table 126 Agreements & Joint Ventures, 2011–2016
Table 127 Mergers & Acquisitions, 2011–2016
List of Figures (58 Figures)
Figure 1 Concrete Bonding Agents: Market Segmentation
Figure 2 Concrete Bonding Agents Market: Research Design
Figure 3 Market Size Estimation: Top-Down Approach
Figure 4 Market Size Estimation: Bottom-Up Approach
Figure 5 Concrete Bonding Agents Market: Data Triangulation
Figure 6 Cementitious Latex Based Agents Dominated the Concrete Bonding Agents Market in 2015
Figure 7 Repairing to Dominate the Concrete Bonding Agents Market Between 2016 and 2021
Figure 8 Concrete Bonding Agents Market in Asia-Pacific to Register the Fastest Growth During the Forecast Period
Figure 9 Asia-Pacific is Estimated to Be the Largest Market for Concrete Bonding Agents
Figure 10 Concrete Bonding Agents Market Size, 2016–2021 (USD Million)
Figure 11 Asia-Pacific to Be the Fastest-Growing Market During the Forecast Period
Figure 12 China Accounted for the Largest Share of the Concrete Bonding Agents Market in Asia-Pacific
Figure 13 China to Emerge as the Most Lucrative Market Between 2016 and 2021
Figure 14 High Growth Potential of the Concrete Bonding Agents Market in Emerging Economies
Figure 15 Concrete Bonding Agents Market, By Region
Figure 16 High Compatibility of Concrete Bonding Agents With Portland Cement and Other Hydraulic Cements Drives the Concrete Bonding Agents Market
Figure 17 Revenue Pocket Matrix, By Application
Figure 18 Raw Material Suppliers and Manufacturers Add Major Value to the Concrete Bonding Agents Value Chain
Figure 19 Porter’s Five Forces Analysis
Figure 20 Concrete Bonding Agents Patent Analysis, By Agent (2011-2016)
Figure 21 Concrete Bonding Agents Patent Analysis, By Application (2011-2016)
Figure 22 Concrete Bonding Agents Patents Analysis, By Region (2011-2016)
Figure 23 North America: Contribution of the Construction Industry to GDP
Figure 24 Europe: Contribution of the Construction Industry to GDP
Figure 25 Asia-Pacific: Contribution of the Construction Industry to GDP
Figure 26 Middle East & Africa: Contribution of the Construction Industry to GDP
Figure 27 Middle East & Africa: Contribution of the Construction Industry to GDP
Figure 28 Cementitious Latex Based Concrete Bonding Agents to Drive the Market Between 2016 and 2021
Figure 29 Asia-Pacific to Be the Fastest-Growing Market for Cementitious Latex Based Concrete Bonding Agents Between 2016 and 2021
Figure 30 Asia-Pacific to Be the Largest Market for Epoxy Based Concrete Bonding Agents Between 2016 and 2021
Figure 31 Repairing to Be the Largest Application of Concrete Bonding Agents, Between 2016 and 2021
Figure 32 Asia-Pacific to Be the Largest Market for Repairing Application, Between 2016 and 2021
Figure 33 Asia-Pacific to Be the Largest Market for Decorative Application, Between 2016 and 2021
Figure 34 Asia-Pacific to Be the Largest Market for Flooring Application, Between 2016 and 2021
Figure 35 Asia-Pacific to Be the Dominant Market in Marine Application, 2016-2021
Figure 36 Japan to Be the Fastest-Growing Market of Conctrete Bonding Agents, Between 2016–2021
Figure 37 U.S. to Be the Fastest-Growing Market in North America, 2016–2021
Figure 38 Japan to Be the Fastest-Growing Market in Asia-Pacific, 2016–2021
Figure 39 Brazil to Be the Largest Market in South America, 2016–2021
Figure 40 UAE to Be the Fastest Growing Market in Middle East & Africa, 2016–2021
Figure 41 Expansions are the Most Preferred Growth Strategy Adopted By Major Players
Figure 42 Market Share Analysis: Sika AG Dominated the Concrete Bonding Agents Market in 2015
Figure 43 Maximum Developments Were Recorded in 2015 and 2016
Figure 44 Expansions is the Most Popular Growth Strategy
Figure 45 Sika AG: Company Snapshot
Figure 46 SWOT Analysis: Sika AG
Figure 47 Fosroc International Ltd.: Company Snapshot
Figure 48 Mapei S.P.A.: Company Snapshot
Figure 49 BASF SE: Company Snapshot
Figure 50 SWOT Analysis: BASF
Figure 51 Lafarargeholcim: Company Snapshot
Figure 52 Lafargeholcim: SWOT Analysis
Figure 53 The DOW Chemical Company: Company Snapshot
Figure 54 The DOW Chemical Company: SWOT Analysis
Figure 55 DOW Corning Corporation: Company Snapshot
Figure 56 DOW Corning Corporation: SWOT Analysis
Figure 57 GCP Applied Technologies, Inc.: Company Snapshot
Figure 58 SWOT Analysis: GCP Applied Technologies Inc.


Growth opportunities and latent adjacency in Concrete Bonding Agents Market