Concrete Admixtures Market

Concrete Admixtures Market by Product Type (Superplasticizers, Normal Plasticizers, Accelerating, Retarding, Air-entraining, Water-proofing), End-Use Sectors (Residential, Commercial and Infrastructure), Region - Global Forecast to 2024

Report Code: CH 2801 Nov, 2019, by marketsandmarkets.com

Updated on : April 05, 2023

Concrete Admixtures Market

The global concrete admixtures market was valued at USD 15.4 billion in 2019 and is projected to reach USD 24.0 billion by 2024, growing at a cagr 9.3% from 2019 to 2024. Increasing construction activities around the globe are driving the demand for concrete admixtures, as it is primarily used for improving the concrete properties during construction. The use of ready-mix concrete in developing countries is expected to act as a growth opportunity for the market, in the future.

Concrete Admixtures Market

MnM assisted a strategic firm in understanding the current market scenario, pricing of concrete admixture types, and tapping into a new customer base in North America.

Client’s Problem Statement

MnM’s client is one of the leading manufacturers of concrete admixtures. The client was interested in knowing the pricing trend of different concrete admixtures in North America.
The key objectives of the study involved:
1. In-depth analysis of concrete admixtures market by product type: Superplasticizers, Normal Plasticizers, Accelerating Admixtures, Retarding Admixtures, Air-entraining Admixtures, Water-proofing Admixtures, and others, and by end-use sector: Residential, Commercial and Infrastructure.
2. Mapping of concrete admixture manufacturers in North America.
3. Detailed analysis of the price for each type of concrete admixtures.

MnM Approach

MnM carried out a detailed search of the public domain and its proprietary and non-proprietary database to initiate the research project, define the scope, and gain knowledge about different stakeholders (suppliers, manufacturers, distributors, customer associations, regulatory authorities, and allied stakeholders). Different concrete admixture manufacturers were contacted and interviewed to know about the latest trends in the concrete admixtures market. The manufacturers were interviewed to gain more insights about their products, chosen manufacturing process, their views on market developments, and market size. End customers of concrete admixture were also interviewed using a semi-structured questionnaire to understand their current and forecast usage of concrete admixtures.

Through the detailed outcome of the study, MnM provided the following inputs:

  • Market size and pricing of the concrete admixtures industry by type, end-use sector, and region.
  • Developments and trends in the concrete admixture market.


Revenue Impact (RI)

• The client was able to understand the current scenario of the concrete admixture market.
• The competitive benchmarking of players done by MnM helped the client understand its present situation in the market and build short as well as long-term strategies to gain a significant amount of market share.
• MnM identified a revenue growth opportunity of more than USD 150 million (within five years) for the client, which could be achieved by increasing its penetration in the North American concrete admixtures market.

Consult our Analyst now

Air-entraining admixtures account for the fastest growth of the concrete admixtures market.

Based on product type, the concrete admixtures market has been segmented into superplasticizers, normal plasticizers, accelerating admixtures, retarding admixtures, air-entraining admixtures, water-proofing admixtures, and others. The air-entraining admixtures is expected to grow at the highest CAGR, in terms of value. Air-entraining admixtures are used to intentionally introduce and stabilize microscopic air bubbles in concrete. Air entrainment will significantly improve the durability of concrete exposed to cycles of freezing and thawing. These are used in preparation of concrete during its mixing operation with water to achieve uniform dispersion. Entrained air in the mixtures also helps in breaking continuous formation of capillaries, thus restricting water flow between cement particles.

Infrastructure is expected to be the fastest-growing end-use sector of the concrete admixtures market.

Based on end-use sector, the concrete admixtures market has been segmented into residential, commercial and infrastructure. The infrastructure segment is projected to grow at the highest CAGR, in terms of value, during the forecast period, owing to an increase in the demand for infrastructure development in the developing countries.

Concrete Admixtures Market

APAC is expected to account for the largest concrete admixtures market share during the forecast period.

The concrete admixtures market in the APAC region is projected to grow at the highest CAGR during the forecast period. Rapid urbanization is fueling the growth of the concrete admixtures market in the region. Increasing government and private-sector investments in infrastructure development can boost the construction market and countries, including India and China are expected to lead the demand for concrete admixtures in the APAC region during the forecast period. Thus, the construction industry has huge potential demand for concrete admixtures.

Concrete Admixtures Market Players

The key players operating in the concrete admixtures market include BASF SE (Germany), SIKA AG (Switzerland), GCP Applied Technologies (US), RPM International Inc. (US), Fosroc International Inc. (UK), Mapei S.P.A (Italy), CICO Technologies Ltd. (India), CHRYSO S.A.S (France), Concrete Additives and Chemicals Pvt. Ltd. (India), and Rhein-Chemotechnik GmbH (Germany).

BASF SE is the world’s leading chemical manufacturing company. The company offers concrete admixtures through its functional materials & solutions business segment. Along with concrete admixtures, this segment offers catalysts, coatings, and performance materials. In order to meet the increasing demand of the concrete admixtures in the construction industry, the company is expanding its construction chemicals business by focusing mainly on facility expansion, R&D activity, and innovation in product technology. The company expanded its global presence through new facility establishments. Its efficient networks of production plants and sales & distribution have helped the company to maintain its leading position in the concrete admixtures market.

Concrete Admixtures Market Report Scope

Report Metric

Details

Years considered for the study

2017–2024

Base year

2018

Forecast period

2019–2024

Units considered

Value (USD Million) and Volume (Kiloton)

Segments

Product Type, End-use Sector, and Region

Regions

Asia Pacific (APAC), the Middle East & Africa, Europe, North America, and South America

Companies

BASF SE (Germany), SIKA AG (Switzerland), GCP Applied Technologies (US), RPM International Inc. (US), Fosroc International Inc. (UK), Mapei S.P.A (Italy), CICO Technologies Ltd. (India), CHRYSO S.A.S (France), Concrete Additives and Chemicals Pvt. Ltd. (India), Rhein-Chemotechnik GmbH (Germany), Weber Saint-Gobain (France), Polisan Kamya San. A.S. (Turkey), Shangdong Wanshan Chemical Co. Ltd. (China), Sakshi Chem Sciences Pvt. Ltd. (India), Fritz-Pak Corporation (US), Fuclear Technologies Inc. (Canada), Ha-Be Betonchemie (Germany), Lanya Concrete Admixtures (China), MUHU (China) Construction Materials Co. Ltd. (China), and Cormix International Ltd. (Thailand).

This research report categorizes the concrete admixtures market based on product type, end-use sector, and region.

Based on product type:

  • Superplasticizers
  • Normal plasticizers
  • Accelerating admixtures
  • Retarding admixtures
  • Air-entraining admixtures
  • Water-proofing admixtures
  • Others (coloring agents, corrosion inhibitors, flame retardants, and fibers)

Based on End-Use Sector:

  • Residential
  • Commercial
  • Infrastructure

Based on Region:

  • APAC
  • Middle East & Africa
  • Europe
  • North America
  • South America

The market is further analyzed for key countries in each of these regions.

Key questions addressed by the report

  • What are the major developments impacting the concrete admixtures market?
  • What are the latest innovations and key events in the industry?
  • What will be the major factors impacting market growth during the forecast period?
  • What are the driving factors, opportunities, restraints, and challenges that affect the growth of the market?
  • What are the strategic growth opportunities for the existing and new players in the market?

Frequently Asked Questions (FAQ):

To speak to our analyst for a discussion on the above findings, click Speak to Analyst


Table of Contents

1 Introduction (Page No. - 18)
    1.1 Objectives of the Study
    1.2 Market Definition
           1.2.1 Market Scope
           1.2.2 Years Considered for the Study
    1.3 Currency
    1.4 Units Considered
    1.5 Stakeholders
    1.6 Limitations

2 Research Methodology (Page No. - 21)
    2.1 Research Data
           2.1.1 Secondary Data
                    2.1.1.1 Key Data From Secondary Sources
           2.1.2 Primary Data
                    2.1.2.1 Key Data From Primary Sources
                    2.1.2.2 Key Industry Insights
                    2.1.2.3 Breakdown of Primary Interviews
    2.2 Market Size Estimation
           2.2.1 Bottom-Up Approach
           2.2.2 Top-Down Approach
    2.3 Data Triangulation
    2.4 Assumptions
    2.5 Limitations

3 Executive Summary (Page No. - 30)

4 Premium Insights (Page No. - 34)
    4.1 Attractive Opportunities in the Concrete Admixtures Market
    4.2 Concrete Admixtures Market, By Product Type
    4.3 Concrete Admixtures Market, Developed vs Developing Countries
    4.4 APAC: Concrete Admixtures Market, By Product Type and End-Use Sectors
    4.5 Concrete Admixtures Market: By Country

5 Market Overview (Page No. - 37)
    5.1 Introduction
           5.1.1 Market Dynamics
           5.1.2 Drivers
                    5.1.2.1 Emerging Construction Industry With Huge Growth Potential in the Developing Countries
                    5.1.2.2 Growing Urbanization Trend
                    5.1.2.3 Improved Quality and Economics of Construction
           5.1.3 Restraints
                    5.1.3.1 Established Infrastructure in Developed Countries
                    5.1.3.2 Unstable Economic Cycles
           5.1.4 Opportunities
                    5.1.4.1 Utilization of Ready-Mix Concrete (RMC) in Developing Countries
           5.1.5 Challenges
                    5.1.5.1 Lack of Technical Guidance and R&D
                    5.1.5.2 Unstable Cost of Raw Materials and Energy
                    5.1.5.3 Stricter Environmental Regulations
                    5.1.5.4 Lack of Awareness Among End Users
                    5.1.5.5 Substandard Products
    5.2 Porter’s Five Forces Analysis
           5.2.1 Threat of New Entrants
           5.2.2 Threat of Substitutes
           5.2.3 Bargaining Power of Buyers
           5.2.4 Bargaining Power of Suppliers
           5.2.5 Intensity of Competitive Rivalry
    5.3 Macroeconomic Indicators
           5.3.1 Introduction
           5.3.2 Trends and Forecast of GDP
           5.3.3 Trends and Forecast in the Construction Industry

6 Concrete Admixtures Market, By Product Type (Page No. - 48)
    6.1 Introduction
    6.2 Mineral Admixtures
           6.2.1 Fly Ash
                    6.2.1.1 Low Calcium Fly Ash is Preferred Due to Low Reactivity
           6.2.2 Granulated Blast Furnace Slag
                    6.2.2.1 Improved Workability and Water Reduction are the Prominent Properties of This Cementitious Material
           6.2.3 Silica Fume
                    6.2.3.1 Use of Silica Fume Increases the Weight of Cement By 15%
           6.2.4 Rice Husk Ash
                    6.2.4.1 Apart From Using Rice Husk Ash as Admixture in Concrete, It is Also Used to Make Bricks
    6.3 Chemical Admixtures
           6.3.1 Superplasticizers
                    6.3.1.1 Improves Workability of the Concrete to A Great Extent Compared to Other Conventional Admixtures
           6.3.2 Normal Plasticizers
                    6.3.2.1 Reduces 15-20% Water Usage, Provides Strength, and Improves Workability of Concrete
           6.3.3 Accelerating Admixtures
                    6.3.3.1 Reduces Segregation, Increases Density & Strength, Improves the Curing Rate of Cement By Providing Uniform Curing During Summer and Winter
           6.3.4 Retarding Admixtures
                    6.3.4.1 Used to Obtain Architectural Finish in the Interior Surface of the Structure to Delay the Hardening of the Cement/Concrete Layer
           6.3.5 Air-Entraining Admixtures
                    6.3.5.1 Uniform Dispersion of Air in the Concrete Restricts Water Flow Between Cement Particles and Formation of Capillaries
           6.3.6 Water-Proofing Admixtures
                    6.3.6.1 Used in Construction of Reservoirs, Sewage, Tanks, Tunnels, Manholes and Other Water Retaining Structures/Floors to Prevent Water Leakages
           6.3.7 Other Concrete Admixtures

7 Concrete Admixtures Market, By End-Use Sector (Page No. - 60)
    7.1 Introduction
    7.2 Residential
           7.2.1 Rise in Population and Rapid Urbanization have Increased the Development of Residential Sector in Urban Areas
    7.3 Commercial
           7.3.1 Higher Costs and Greater Complexity of Commercial Buildings have Resulted in Less Competitors in Commercial Sector
    7.4 Infrastructure
           7.4.1 Growth and Development in the Infrastructure Sector Boosts the Global Economy

8 Concrete Admixtures Market Size, By Region (Page No. - 67)
    8.1 Introduction
    8.2 APAC
           8.2.1 China
                    8.2.1.1 China's Construction Industry to Expand By 5.9% in 2019 and 6.1% By 2020, Driven By the Railway Construction Projects
           8.2.2 India
                    8.2.2.1 Cement Demand in India is Expected to Reach 550-600 Million Tonnes Per Annum (MTPA) By 2025, Supported By the Government’s Infrastructure Projects
           8.2.3 Japan
                    8.2.3.1 Superplasticizers and Normal Plasticizers are Used in Most Concretes in Japan to Endure Natural Calamities
           8.2.4 South Korea
                    8.2.4.1 The Government’s Increased Investment on the Healthcare and Education Sectors are Expected to Boost the Concrete Admixtures Market
           8.2.5 Rest of APAC
    8.3 The Middle East & Africa
           8.3.1 Egypt
                    8.3.1.1 Increasing Demand for Housing to Accommodate the Increasing Population Will Boost the Concrete Admixtures Market
           8.3.2 Iran
                    8.3.2.1 Country Aims to Increase Its Annual Cement Production Capacity to Accommodate 20-Year Vision Plan (2025)
           8.3.3 Saudi Arabia
                    8.3.3.1 Government has Made Huge Investments in Infrastructure Development to Boost Tourism
           8.3.4 United Arab Emirates (UAE)
                    8.3.4.1 Increased Crude Oil Production Helps to Drive Investment in Construction Industry
           8.3.5 Rest of Middle East & Africa
    8.4 Europe
           8.4.1 Turkey
                    8.4.1.1 Cement Sector Contributes to the Growth of Turkey’s Economy
           8.4.2 Italy
                    8.4.2.1 The Production of Cement in Italy is Expected to Remain Stable in the Near Future
           8.4.3 Poland
                    8.4.3.1 Poland is the Fastest Growing-Economy in the European Union (EU)
           8.4.4 Spain
                    8.4.4.1 Transport Infrastructure and Increase in Housing Units Boost the Concrete Admixtures Market
           8.4.5 Germany
                    8.4.5.1 Implementation of Increasing Stringent Environmental Regulations have Increased the Production of Cement and Concrete Admixtures in the Country
           8.4.6 France
                    8.4.6.1 Government’s Focus on the Development of Affordable Houses as Well as Renewable Energy Infrastructure Will Contribute to the Demand for Concrete Admixtures
           8.4.7 UK
                    8.4.7.1 Government of UK has Invested USD 764 Billion Under National Infrastructure and Construction Pipeline (NICP) for the Next 10 Years to Improve the Infrastructure in Energy, Transport, and Other Sectors
           8.4.8 Rest of Europe
    8.5 North America
           8.5.1 US
                    8.5.1.1 Positive Trends in the Residential Market are Boosting the Construction Industry Growth
           8.5.2 Mexico
                    8.5.2.1 Government’s Promise to Increase the Growth of GDP By 4% in 2019, Through Infrastructure Development Will Increase the Demand for Concrete Admixtures
           8.5.3 Canada
                    8.5.3.1 Government Plans to Provide Financial Help to First-Time Home Buyers and Development of the Country’s Transport Infrastructure Under the Transportation 2030 Program Will Boost the Demand for Concrete Admixtures
    8.6 South America
           8.6.1 Brazil
                    8.6.1.1 Investment Partnership Program has Promoted the Private Sector Participation in Infrastructure Development
           8.6.2 Argentina
                    8.6.2.1 China-Built Projects in the Country have Improved the Livelihood and Created Employment Opportunities
           8.6.3 Rest of South America

9 Competitive Landscape (Page No. - 120)
    9.1 Overview
    9.2 Competitive Leadership Mapping, 2018
           9.2.1 Visionary Leaders
           9.2.2 Innovators
           9.2.3 Dynamic Differentiators
           9.2.4 Emerging Companies
    9.3 Strength of Product Portfolio
    9.4 Business Strategy Excellence
    9.5 Market Ranking Analysis
           9.5.1 BASF SE
           9.5.2 SIKA AG
           9.5.3 GCP Applied Technologies
           9.5.4 RPM International Inc.
           9.5.5 Fosroc International Ltd.
    9.6 Competitive Scenario
           9.6.1 New Product Development/Launch
           9.6.2 Merger & Acquisition
           9.6.3 Investment & Expansion
           9.6.4 Partnership & Collaboration

10 Company Profiles (Page No. - 133)
     10.1 BASF SE
             10.1.1 Business Overview
             10.1.2 Functional Materials & Solutions Segment
             10.1.3 Products, Customers, and Applications
             10.1.4 Products Offered
             10.1.5 Recent Developments
             10.1.6 SWOT Analysis
             10.1.7 BASF SE’s Right to Win
     10.2 SIKA AG
             10.2.1 Business Overview
             10.2.2 Products Offered
             10.2.3 Recent Developments
             10.2.4 SWOT Analysis
             10.2.5 SIKA Ag’s Right to Win
     10.3 GCP Applied Technologies Inc.
             10.3.1 Business Overview
             10.3.2 Specialty Construction Chemicals Segment
             10.3.3 The Specialty Construction Chemicals Product Portfolio
             10.3.4 Products Offered
             10.3.5 Recent Development
             10.3.6 GCP Applied Technologies’ Right to Win
     10.4 RPM International Inc.
             10.4.1 Business Overview
             10.4.2 Products Offered
             10.4.3 RPM International Inc.’S Right to Win
     10.5 Fosroc International Ltd
             10.5.1 Business Overview
             10.5.2 Products Offered
             10.5.3 Recent Developments
             10.5.4 Fosroc International Ltd’s Right to Win
     10.6 Mapei S.P.A
             10.6.1 Overview
             10.6.2 Products Offered
             10.6.3 Mapei S.P.A’s Right to Win
     10.7 CICO Technologies Ltd
             10.7.1 Business Overview
             10.7.2 Products Offered
             10.7.3 CICO Technologies Ltd’s Right to Win
     10.8 CHRYSO S.A.S.
             10.8.1 Overview
             10.8.2 Products Offered
             10.8.3 Recent Developments
             10.8.4 CHRYSO S.A.S’s Right to Win
     10.9 Concrete Additives and Chemicals Pvt. Ltd.
             10.9.1 Business Overview
             10.9.2 Products Offered
             10.9.3 Concrete Additives and Chemicals Pvt. Ltd. Right to Win
     10.10 Rhein-Chemotechnik GmbH
             10.10.1 Business Overview
             10.10.2 Products Offered
             10.10.3 Rhein-Chemotechnik GmbH’s Right to Win
     10.11 Other Companies
             10.11.1 Weber Saint-Gobain
             10.11.2 Polisan Kimya San. A.S.
             10.11.3 Shandong Wanshan Chemical Co. Ltd.
             10.11.4 Sakshi Chem Sciences Pvt. Ltd.
             10.11.5 Fritz-Pak Corporation
             10.11.6 Fuclear Technologies Inc.
             10.11.7 Ha-Be Betonchemie
             10.11.8 Lanya Concrete Admixtures
             10.11.9 Muhu (China) Construction Materials Co., Ltd.
             10.11.10 Cormix International Limited

11 Appendix (Page No. - 165)
     11.1 Discussion Guide
     11.2 Knowledge Store: Marketsandmarkets Subscription Portal
     11.3 Available Customizations
     11.4 Related Reports
     11.5 Author Details


List of Tables (117 Tables)

Table 1 Concrete Admixtures Market Snapshot, 2019 vs 2024
Table 2 Countries With the Best Infrastructure in 2017
Table 3 GDP Percentage Change, By Key Country, 2017–2024 (USD Billion)
Table 4 Chemical Composition of Admixtures, By Product Type
Table 5 Concrete Admixtures Market Size, By Product Type, 2017-2024 (Kiloton)
Table 6 Concrete Admixtures Market Size, By Product Type, 2017–2024 (USD Million)
Table 7 Superplasticizers Market Size, By Region, 2017–2024 (Kiloton)
Table 8 Superplasticizers Market Size, By Region, 2017–2024 (USD Million)
Table 9 Normal Plasticizers Market Size, By Region, 2017–2024 (Kiloton)
Table 10 Normal Plasticizers Market Size, By Region, 2017–2024 (USD Million)
Table 11 Accelerating Admixtures Market Size, By Region, 2017–2024 (Kiloton)
Table 12 Accelerating Admixtures Market Size, By Region, 2017–2024 (USD Million)
Table 13 Retarding Admixtures Market Size, By Region, 2017–2024 (Kiloton)
Table 14 Retarding Admixtures Market Size, By Region, 2017–2024 (USD Million)
Table 15 Air-Entraining Admixtures Market Size, By Region, 2017–2024 (Kiloton)
Table 16 Air-Entraining Admixtures Market Size, By Region, 2017–2024 (USD Million)
Table 17 Water-Proofing Admixtures Market Size, By Region, 2017–2024 (Kiloton)
Table 18 Water-Proofing Admixtures Market Size, By Region, 2017–2024 (USD Million)
Table 19 Others Concrete Admixtures Market Size, By Region, 2017–2024 (Kiloton)
Table 20 Other Market Size, By Region, 2017–2024 (USD Million)
Table 21 Concrete Admixtures Market Size, By End-Use Sector, 2017–2024 (Kiloton)
Table 22 Market Size, By End-Use Sector, 2017–2024 (USD Million)
Table 23 Market Size in Residential, By Region, 2017–2024 (Kiloton)
Table 24 Market Size in Residential, By Region, 2017–2024 (USD Million)
Table 25 Market Size in Commercial, By Region, 2017–2024 (Kiloton)
Table 26 Market Size in Commercial, By Region, 2017–2024 (USD Million)
Table 27 Market Size in Infrastructure, By Region, 2017–2024 (Kiloton)
Table 28 Market Size in Infrastructure, By Region, 2017–2024 (USD Million)
Table 29 Market Size, By Region, 2017–2024 (Kiloton)
Table 30 Market Size, By Region, 2017–2024 (USD Million)
Table 31 APAC: Concrete Admixtures Market Size, By Country, 2017–2024 (Kiloton)
Table 32 APAC: Market Size, By Country, 2017–2024 (USD Million)
Table 33 APAC: Market Size, By Product Type, 2017–2024 (Kiloton)
Table 34 APAC: Market Size, By Product Type, 2017–2024 (USD Million)
Table 35 APAC: Market Size, By End-Use Sector, 2017–2024 (Kiloton)
Table 36 APAC: Market Size, By End-Use Sector, 2017–2024 (USD Million)
Table 37 China: Concrete Admixtures Market Size, By Product Type, 2017–2024 (Kiloton)
Table 38 China: Market Size, By Product Type, 2017–2024 (USD Million)
Table 39 China’s Top 10 Infrastructure Projects
Table 40 India: Concrete Admixtures Market Size, By Product Type, 2017–2024 (Kiloton)
Table 41 India: Market Size, By Product Type, 2017–2024 (USD Million)
Table 42 Upcoming Infrastructure Projects in India
Table 43 Japan: Concrete Admixtures Market Size, By Product Type, 2017–2024 (Kiloton)
Table 44 Japan: Market Size, By Product Type, 2017–2024 (USD Million)
Table 45 Upcoming Infrastructure Projects in Japan
Table 46 South Korea: Concrete Admixtures Market Size, By Product Type, 2017–2024 (Kiloton)
Table 47 South Korea: Market Size, By Product Type, 2017–2024 (USD Million)
Table 48 Rest of APAC: Concrete Admixtures Market Size, By Product Type, 2017–2024 (Kiloton)
Table 49 Rest of APAC: Market Size, By Product Type, 2017–2024 (USD Million)
Table 50 The Middle East & Africa: Concrete Admixtures Market Size, By Country, 2017–2024 (Kiloton)
Table 51 The Middle East & Africa: Market Size, By Country, 2017–2024 (USD Million)
Table 52 The Middle East & Africa: Market Size, By Product Type, 2017–2024 (Kiloton)
Table 53 The Middle East & Africa: Market Size, By Product Type, 2017–2024 (USD Million)
Table 54 The Middle East & Africa: Market Size, By End-Use Sector, 2017–2024 (Kiloton)
Table 55 The Middle East & Africa: Market Size, By End-Use Sector, 2017–2024 (USD Million)
Table 56 Egypt: Concrete Admixtures Market Size, By Product Type, 2017–2024 (Kiloton)
Table 57 Egypt: Market Size, By Product Type, 2017–2024 (USD Million)
Table 58 Iran: Concrete Admixtures Market Size, By Product Type, 2017–2024 (Kiloton)
Table 59 Iran: Market Size, By Product Type, 2017–2024 (USD Million)
Table 60 Saudi Arabia: Concrete Admixtures Market Size, By Product Type, 2017–2024 (Kiloton)
Table 61 Saudi Arabia: Market Size, By Product Type, 2017–2024 (USD Million)
Table 62 UAE: Concrete Admixtures Market Size, By Product Type, 2017–2024 (Kiloton)
Table 63 UAE: Market Size, By Product Type, 2017–2024 (USD Million)
Table 64 Rest of Middle East & Africa: Concrete Admixtures Market Size, By Product Type, 2017–2024 (Kiloton)
Table 65 Rest of Middle East & Africa: Market Size, By Product Type, 2017–2024 (USD Million)
Table 66 Infrastructure Projects in Europe
Table 67 Europe: Concrete Admixtures Market Size, By Country, 2017–2024 (Kiloton)
Table 68 Europe: Market Size, By Country, 2017–2024 (USD Million)
Table 69 Europe: Market Size, By Product Type, 2017–2024 (Kiloton)
Table 70 Europe: Market Size, By Product Type, 2017–2024 (USD Million)
Table 71 Europe: Market Size, By End-Use Sector, 2017–2024 (Kiloton)
Table 72 Europe: Market Size, By End-Use Sector, 2017–2024 (USD Million)
Table 73 Turkey: Concrete Admixtures Market Size, By Product Type, 2017–2024 (Kiloton)
Table 74 Turkey: Market Size, By Product Type, 2017–2024 (USD Million)
Table 75 Italy: Concrete Admixtures Market Size, By Product Type, 2017–2024 (Kiloton)
Table 76 Italy: Market Size, By Product Type, 2017–2024 (USD Million)
Table 77 Poland: Concrete Admixtures Market Size, By Product Type, 2017–2024 (Kiloton)
Table 78 Poland: Market Size, By Product Type, 2017–2024 (USD Million)
Table 79 Spain: Concrete Admixtures Market Size, By Product Type, 2017–2024 (Kiloton)
Table 80 Spain: Market Size, By Product Type, 2017–2024 (USD Million)
Table 81 Germany: Concrete Admixtures Market Size, By Product Type, 2017–2024 (Kiloton)
Table 82 Germany: Market Size, By Product Type, 2017–2024 (USD Million)
Table 83 France: Concrete Admixtures Market Size, By Product Type, 2017–2024 (Kiloton)
Table 84 France: Market Size, By Product Type, 2017–2024 (USD Million)
Table 85 UK: Concrete Admixtures Market Size, By Product Type, 2017–2024 (Kiloton)
Table 86 UK: Market Size, By Product Type, 2017–2024 (USD Million)
Table 87 Rest of Europe: Concrete Admixtures Market Size, By Product Type, 2017–2024 (Kiloton)
Table 88 Rest of Europe: Market Size, By Product Type, 2017–2024 (USD Million)
Table 89 Infrastructure Projects in North America
Table 90 North America: Concrete Admixtures Market Size, By Country, 2017–2024 (Kiloton)
Table 91 North America: Market Size, By Country, 2017–2024 (USD Million)
Table 92 North America: Market Size, By Product Type, 2017–2024 (Kiloton)
Table 93 North America: Market Size, By Product Type, 2017–2024 (USD Million)
Table 94 North America: Market Size, By End-Use Sector, 2017–2024 (Kiloton)
Table 95 North America: Market Size, By End-Use Sector, 2017–2024 (USD Million)
Table 96 US: Concrete Admixtures Market Size, By Product Type, 2017–2024 (Kiloton)
Table 97 US: Market Size, By Product Type, 2017–2024 (USD Million)
Table 98 Mexico: Concrete Admixtures Market Size, By Product Type, 2017–2024 (Kiloton)
Table 99 Mexico: Market Size, By Product Type, 2017–2024 (USD Million)
Table 100 Canada: Concrete Admixtures Market Size, By Product Type, 2017–2024 (Kiloton)
Table 101 Canada: Market Size, By Product Type, 2017–2024 (USD Million)
Table 102 South America: Concrete Admixtures Market Size, By Country, 2017–2024 (Kiloton)
Table 103 South America: Market Size, By Country, 2017–2024 (USD Million)
Table 104 South America: Market Size, By Product Type, 2017–2024 (Kiloton)
Table 105 South America: Market Size, By Product Type, 2017–2024 (USD Million)
Table 106 South America: Market Size, By End-Use Sector, 2017–2024 (Kiloton)
Table 107 South America: Market Size, By End-Use Sector, 2017–2024 (USD Million)
Table 108 Brazil: Concrete Admixtures Market Size, By Product Type, 2017–2024 (Kiloton)
Table 109 Brazil: Market Size, By Product Type, 2017–2024 (USD Million)
Table 110 Argentina: Concrete Admixtures Market Size, By Product Type, 2017–2024 (Kiloton)
Table 111 Argentina: Market Size, By Product Type, 2017–2024 (USD Million)
Table 112 Rest of South America: Concrete Admixtures Market Size, By Product Type, 2017–2024 (Kiloton)
Table 113 Rest of South America: Market Size, By Product Type, 2017–2024 (USD Million)
Table 114 New Product Developments/Launches, 2018–2019*
Table 115 Mergers & Acquisitions, 2018–2019*
Table 116 Investments & Expansions, 2016–2019*
Table 117 Partnership & Collaboration, 2018–2019*


List of Figures (48 Figures)

Figure 1 Concrete Admixtures: Market Segmentation
Figure 2 Concrete Admixtures Market: Research Design
Figure 3 Market Size Estimation: Concrete Admixtures Market
Figure 4 Market, By Region
Figure 5 Market, By Application
Figure 6 Market Size Estimation: Bottom-Up Approach, By Product Type
Figure 7 Market Size Estimation: Top-Down Approach
Figure 8 Concrete Admixtures Market: Data Triangulation
Figure 9 Research Assumptions
Figure 10 Research Limitations
Figure 11 Air-Entraining Admixtures to Register the Highest CAGR in the Concrete Admixtures Market
Figure 12 Infrastructure to Register the Highest Growth in the Concrete Admixtures Market
Figure 13 APAC to Be the Fastest-Growing Concrete Admixtures Market
Figure 14 Concrete Admixtures Market to Register Robust Growth Between 2019 and 2024
Figure 15 Air-Entraining Admixtures to Grow at the Fastest Rate
Figure 16 Developing Countries to Grow Faster Than the Developed Countries
Figure 17 Infrastructure End-Use Sector Accounted for the Largest Share
Figure 18 India to Register the Highest CAGR in the Concrete Admixtures Market
Figure 19 Drivers, Restraints, Opportunities, and Challenges in the Concrete Admixtures Market
Figure 20 Concrete Admixtures Market: Porter’s Five Forces Analysis
Figure 21 Global Spending in Construction Industry, 2017–2025
Figure 22 Superplasticizers to Lead the Concrete Admixtures Market
Figure 23 Infrastructure Accounted for A Share in Concrete Admixtures Market, By End-Use Sector
Figure 24 Cement Demand of Major Countries in 2017
Figure 25 India to Register the Highest CAGR Between 2019 and 2024
Figure 26 Major Consumers of Cement, Globally, 2017
Figure 27 APAC: Concrete Admixtures Market Snapshot
Figure 28 India: Robust Demand and Supply Growth of Cement
Figure 29 Middle East & Africa: UAE to Be the Fastest-Growing Concrete Admixtures Market
Figure 30 The Middle East & Africa: Share in Construction Market, By Country, 2017
Figure 31 Europe: Turkey and Italy are Projected to Be the Fastest-Growing Markets
Figure 32 North America: Concrete Admixtures Market Snapshot
Figure 33 South America: Brazil to Be the Largest Concrete Admixtures Market
Figure 34 Investment and Expansion is the Key Growth Strategy Adopted in the Concrete Admixtures Market Between 2016 and 2019
Figure 35 Concrete Admixtures Market (Global): Competitive Leadership Mapping, 2018
Figure 36 Key Market Players in 2018
Figure 37 BASF SE: Company Snapshot
Figure 38 Functional Materials & Solutions Segment Sales, By Division
Figure 39 BASF SE: SWOT Analysis
Figure 40 SIKA AG: Company Snapshot
Figure 41 SIKA AG: SWOT Analysis
Figure 42 GCP Applied Technologies: Company Snapshot
Figure 43 Specialty Construction Chemicals Segment Sales, By Division
Figure 44 GCP Applied Technologies: SWOT Analysis
Figure 45 RPM International Inc.: Company Snapshot
Figure 46 RPM International Inc.: SWOT Analysis
Figure 47 Fosroc International Ltd.: SWOT Analysis
Figure 48 Mapei S.P.A: Company Snapshot

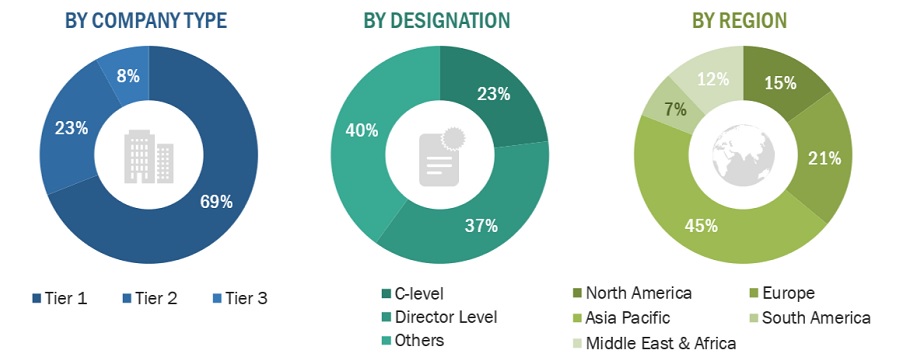
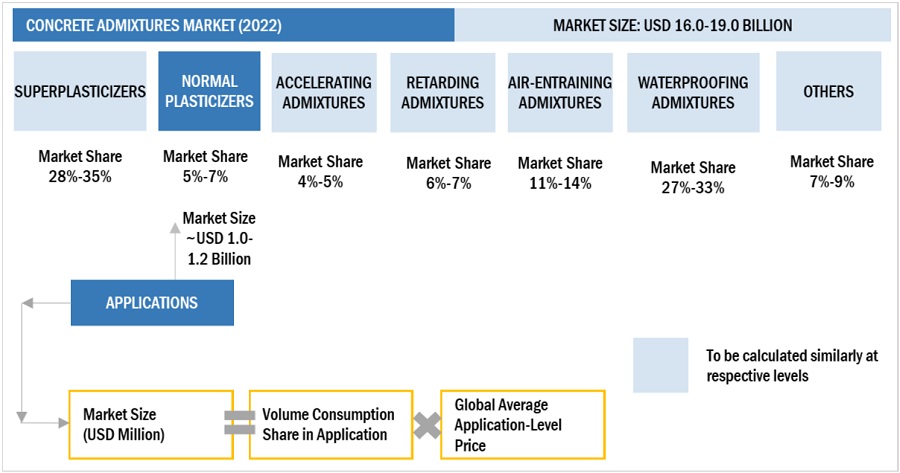
The study involved four major activities in estimating the current size of the concrete admixtures market. Exhaustive secondary research was done to collect information about the market, the peer market, and the parent market. The next step was to validate these findings, assumptions, and sizing with industry experts across the value chain through primary research. Both top-down and bottom-up approaches were employed to estimate the complete market size. After that, the market breakdown and data triangulation methods were used to estimate the size of the segments and subsegments of the overall market.

Secondary Research

This research report involved the use of extensive secondary sources, directories, and databases, such as Bloomberg, BusinessWeek, Factiva, ICIS, and OneSource, to identify and collect information useful for the technical, market-oriented, and commercial study of the concrete admixtures market. The secondary sources included annual reports, press releases & investor presentations of companies, white papers, certified publications, and articles from recognized authors, authenticated directories, and databases.

Primary Research

The concrete admixtures market comprises several stakeholders, such as manufacturers of concrete admixtures; raw material dealers & suppliers; end-use sectors of concrete admixtures, such as residential, non-residential and infrastructure; traders, distributors, and suppliers of concrete admixtures; regional manufacturers’ associations and general concrete admixture associations and agencies & research organizations. Various primary sources from both the supply and demand sides of the market were interviewed to obtain qualitative and quantitative information. Primary sources from the supply side include industry experts, such as chief executive officers (CEOs), vice presidents (VPs), marketing directors, technology and innovation directors, and related key executives from various key companies and organizations operating in the concrete admixtures market.

Concrete Admixtures Market

To know about the assumptions considered for the study, download the pdf brochure

Market Size Estimation

Both the top-down and bottom-up approaches were used to estimate and validate the total size of the concrete admixtures market. These methods were also used extensively to estimate the sizes of various sub-segments in the market. The research methodology used to estimate the market size includes the following steps:

  • The key players in the industry and markets were identified through extensive secondary research.
  • The industry’s supply chain and market size, in terms of value, were determined through primary and secondary research.
  • All percentage shares, splits, and breakdowns were determined using secondary sources and verified through primary sources.

Data Triangulation

After arriving at the overall concrete admixtures market size—using the estimation processes explained above—the market was split into several segments and subsegments. The data triangulation and market breakdown procedures were employed, wherever applicable, to complete the overall market engineering process and arrive at the exact statistics of each market segment and subsegment. The data was triangulated by studying various factors and trends from both the demand and supply sides.

Report Objectives

  • To analyze and forecast the global concrete admixtures market size, in terms of value and volume
  • To provide detailed information about the key factors (drivers, restraints, opportunities, and challenges) influencing the market growth
  • To define, describe, and forecast the market, by product type and end-use sector
  • To forecast the market size with respect to five regions, namely, Asia Pacific (APAC), the Middle East & Africa, Europe, North America, and South America
  • To strategically analyze the micro markets with respect to individual growth trends, prospects, and their contribution to the overall market
  • To analyze the opportunities in the market for stakeholders and provide a competitive landscape for market leaders
  • To analyze competitive developments, such as investments & expansions, new product developments, partnerships & agreements, and mergers & acquisitions, in the concrete admixtures market
  • To strategically profile the key players and comprehensively analyze their market shares and core competencies

Available Customizations

MarketsandMarkets offers customizations according to the specific needs of the companies with the given market data.

The following customization options are available for the report:

Regional Analysis:

  • Country-level analysis of the concrete admixtures market, by category

Company Information:

  • Detailed analysis and profiles of additional market players
Custom Market Research Services

We will customize the research for you, in case the report listed above does not meet with your exact requirements. Our custom research will comprehensively cover the business information you require to help you arrive at strategic and profitable business decisions.

Request Customization
Report Code
CH 2801
Published ON
Nov, 2019
Choose License Type
BUY NOW
  • SHARE
X
Request Customization
Speak to Analyst
Speak to Analyst
OR FACE-TO-FACE MEETING
PERSONALIZE THIS RESEARCH
  • Triangulate with your Own Data
  • Get Data as per your Format and Definition
  • Gain a Deeper Dive on a Specific Application, Geography, Customer or Competitor
  • Any level of Personalization
REQUEST A FREE CUSTOMIZATION
LET US HELP YOU!
  • What are the Known and Unknown Adjacencies Impacting the Concrete Admixtures Market
  • What will your New Revenue Sources be?
  • Who will be your Top Customer; what will make them switch?
  • Defend your Market Share or Win Competitors
  • Get a Scorecard for Target Partners
CUSTOMIZED WORKSHOP REQUEST
+1-888-600-6441
  • Call Us
  • +1-888-600-6441 (Corporate office hours)
  • +1-888-600-6441 (US/Can toll free)
  • +44-800-368-9399 (UK office hours)
CONNECT WITH US
ABOUT TRUST ONLINE
©2023 MarketsandMarkets Research Private Ltd. All rights reserved
DMCA.com Protection Status Website Feedback