Critical Power and Cooling Market Power Solution by Type (UPS, Genset) and End Use (Industrial, Commercial, IT & Telecom, Transportation), Cooling Solution by Type (Air Conditioning, Chiller, Cooling Tower, Liquid Cooling System) - Global Forecast to 2021


[166 Pages] The global critical power and cooling market is expected to grow from an estimated USD 16.87 Billion in 2016 to USD 25.80 Billion by 2021, at a CAGR of 8.88%, from 2016 to 2021. The factors driving the market include a rise in the number of data centers due to digitalization and cloud computing, increasing demand for improved cooling efficiency in data centers, the need to reduce anomalies in power supply, and regulations and initiatives by institutes and associations. High investment costs and environmental and health hazards are key restraints for the growth of the market.
Objectives of the study
- To define, describe, and forecast the global market on the basis of type, end-user, and region
- To provide detailed information regarding major factors influencing market growth (drivers, restraints, opportunities, and industry-specific challenges)
- To strategically analyze the market with respect to individual growth trends of manufacturers, their future expansions, and contribution to the market
- To forecast the growth of the market with respect to the main regions (Asia-Pacific, Europe, North America, Latin America, and the Middle East & Africa)
- To strategically profile key market players and comprehensively analyze their market shares and core competencies
- To analyze market opportunities for stakeholders and provide details of competitive developments, such as contracts & agreements, mergers & acquisitions, expansions, and new product or technology launches, in the global market
* Core competencies of the companies are captured in terms of their key developments, SWOT analyses, and the key strategies adopted by them to sustain their position in the market
The years considered for the study are as follows:
- Base Year: 2015
- Estimated Year: 2016
- Projected Year: 2021
- Forecast Period: From 2016 to 2021
For company profiles in the report, 2015 has been used as the base year.
Research Methodology
This research study involved the extensive use of secondary sources, directories, and databases (such as Hoover�s, Bloomberg, Businessweek, and Factiva) to identify and collect information useful for this technical, market-oriented, and commercial study of the critical power and cooling market. The points mentioned below explain the research methodology applied in this report.
- Analysis of all the operational and upcoming infrastructural projects across the world
- Analysis of country-wise industrial growth rate for the past five years
- Analysis of the market trends in various regions and countries supported by critical power and cooling equipment manufacturers.
- Overall market size values are finalized by triangulation with the supply-side data which includes product developments, supply chain, and annual deliveries of critical power and cooling solutions across the globe
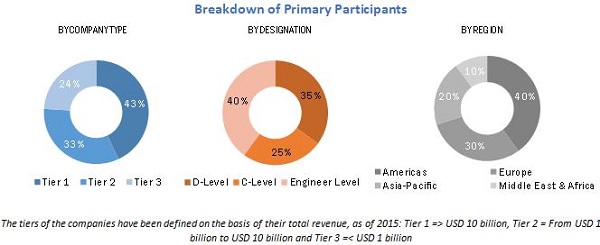
After arriving at the overall market size, the total market has been split into several segments and subsegments. The figure given below shows the breakdown of the primaries on the basis of company type, designation, and region.
To know about the assumptions considered for the study, download the pdf brochure
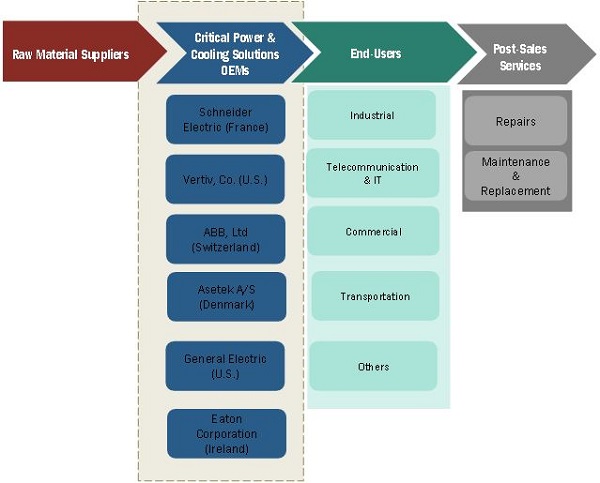
Market Ecosystem
Stakeholders
The stakeholders included in this report are as follows:
- Critical power device manufacturers, dealers, and suppliers
- Consulting companies in the energy and power sector
- Government utility providers
- Private utility providers
- Private customers
- Network operators
- Communication vendors
- Cooling solutions component manufacturers
- National and regional agencies
- Investment banks and private equity firms
- Raw material suppliers
- Government and research organizations
�The study answers several questions for the stakeholders, primarily which market segments to focus on in the next two to five years to prioritize efforts and investments.�
Scope of the report
Critical Power, by Type:
- UPS
- Generators
- Others*
Others includes converters, inverters, transfer switches, power transfer switching, breaker transfer pairs, generator paralleling breakers, and switch transfer pairs
Cooling Solutions, by Type
- Air Conditioning
- Chilling Units
- Cooling Towers
- Liquid Cooling Systems
- Others*
Others includes economizer systems, control systems, pumping units, humidifiers, and air coolers
Critical Power, by End-User
- Industrial
- Commercial
- IT and Telecommunication
- Government and Defense
- Transportation
Cooling Solutions, by End-User
- Industrial
- Commercial
- IT and Telecommunication
- Transportation
- Others*
Others includes government buildings and military applications
By Region
- North America
- Europe
- Asia-Pacific
- Middle East & Africa
- Latin America
Available Customizations
With the given market data, MarketsandMarkets offers customizations as per the client�s specific needs. The following customization options are available for the report:
- Detailed analysis and profiling of additional market players (up to five)
The critical power and cooling market is projected to grow at a CAGR of 8.88%, from 2016 to 2021, to reach USD 25.80 Billion by 2021. A rise in digitalization and cloud computing leading to an increase in demand for data centers, increasing demand for improved cooling efficiency in data centers, a need to reduce anomalies in power supply, and regulations and initiatives by institutes and associations are the major factors driving the market.
The report segments the critical power market, by type, into UPS, generators, and others (converters, inverters, transfer switches, power transfer switching, breaker transfer pairs, generator paralleling breakers, and switch transfer pairs). The cooling solutions market has been segmented, by type, into air conditioning, chilling units, cooling towers, liquid cooling systems, and others (economizer systems, control systems, pumping units, humidifiers, and air coolers).
The report segments the critical power market, by end-user, into industrial, commercial, IT and telecommunication, government and defense, and transportation. The end-users of the cooling solutions market include industrial, commercial, IT and telecommunication, transportation, and others (government buildings and military applications).
The commercial segment holds the largest market share of the critical power and cooling market, by end-user. The critical power market, by type, is dominated by the UPS segment, while the air conditioning segment leads the cooling market, by type.
The global banking and financial sector is expanding on a large scale with the advent of IT. However, unplanned downtime and IT failure may affect ongoing transactions. Installation of data centers with efficient and reliable power solutions can overcome such failures. This increases the demand for critical power and cooling in the BFSI sector.
Air conditioning units are widely used at data center facilities. They provide precision air conditioning and maintain the equipment at ideal operating temperatures. Thus, the increasing number of data centers is expected to boost the market, during the forecast period.
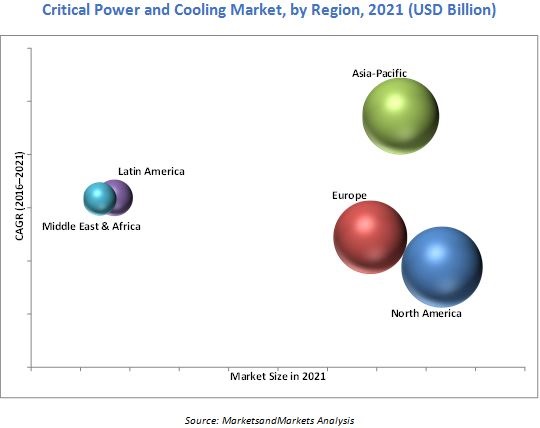
In this report, the critical power and cooling market has been segmented into the following regions, North America, Europe, Asia-Pacific, Latin America, and the Middle East & Africa. North America is currently the largest market for critical power and cooling, and the Asia-Pacific market is projected to grow at the highest CAGR, during the forecast period. The U.S. accounted for the majority share in North America in 2016. The increasing number of data centers and data processing power and increasing demand for information storage are factors driving the market in the U.S. and Canada. The figure given below shows the regional scenario of the market from 2016 to 2021.
High investment costs and environmental and health hazards are key restraints for the growth of the critical power & cooling market.
Some of the leading players in the critical power and cooling market include Schneider Electric (France), ABB, Ltd. (Switzerland), General Electric (U.S.), Eaton Corporation (Ireland), Delta Electronics, Inc. (Taiwan), Critical Power Xiamen Kehua Hengsheng, Co. (China), Socomec (France), Falcon Electric, Inc. (U.S.), Daikin Industries, Ltd. (Japan), STULZ GmbH (Germany), Asetek A/S (Denmark), Vertiv, Co. (U.S.), ICS Cool Energy (U.K.), Piller Group GmbH (Germany), Riello Elettronica Group (Italy), Cyber Power Systems (U.S.), AC Power Corp. (PREEN) (Taiwan), Connexa Energy (U.S.), Siemens AG (Germany), SPX Corporation (U.S.), Johnson Controls, Inc. (U.S.), Nortek Air Solutions, LLC (U.S.), Rittal GmbH & Co. KG (Germany), and Airedale International Air Conditioning, Ltd. (U.K.), among others. New product launches was the most common strategy adopted by the top players in the market, constituting more than one-third of the total development share. The other common strategies employed were contracts & agreements, partnerships and joint ventures, expansions, and mergers & acquisitions, respectively.
To speak to our analyst for a discussion on the above findings, click Speak to Analyst
 Exclusive indicates content/data unique to MarketsandMarkets and not available with any competitors.
Table of Contents
1 Introduction (Page No. - 15)
1.1 Objectives of the Study
1.2 Market Definition
1.3 Market Scope
1.3.1 Markets Covered
1.3.2 Countries Covered
1.3.3 Years Considered for the Study
1.4 Currency
1.5 Limitations
1.6 Stakeholders
2 Research Methodology (Page No. - 19)
2.1 Research Data
2.1.1 Secondary Data
2.1.1.1 Key Data From Secondary Sources
2.1.2 Primary Data
2.1.2.1 Key Data From Primary Sources
2.1.2.2 Key Industry Insights
2.1.2.3 Breakdown of Primaries
2.2 Market Size Estimation
2.3 Market Breakdown and Data Triangulation
2.4 Research Assumptions
2.4.1 Assumptions
3 Executive Summary (Page No. - 27)
3.1 Introduction
3.2 Current Scenario
3.3 Future Outlook
3.4 Conclusion
4 Premium Insights (Page No. - 34)
4.1 Attractive Market Opportunities in the Critical Power & Cooling Market
4.2 Market: Regional Growth Rate (2016�2021)
4.3 Market, By Region
4.4 Market, By Type
4.5 Market, By End-Use
5 Market Overview (Page No. - 38)
5.1 Introduction
5.2 Market Segmentation
5.2.1 By Type
5.2.2 By End-Use
5.2.3 By Region
5.3 Market Dynamics
5.3.1 Drivers
5.3.1.1 Improving Cooling Efficiency in Data Centers
5.3.1.2 Rise in the Number of Data Centers Due to Rise in Digitalization and Cloud Computing is Driving the Demand for Critical Power and Cooling
5.3.1.3 Anomalies in Power Supply
5.3.1.4 Regulations & Initiatives By Institutes
5.3.2 Restraints
5.3.2.1 Erratic Power Supply and Shortage of Electricity in Regions
5.3.2.2 High Investment Cost
5.3.3 Opportunities
5.3.3.1 Increasing Need for Power Generation Led By Industrial Growth in Asia-Pacific
5.3.3.2 Growing Requirement for Modular Data Center Cooling Approaches
5.3.4 Challenges
5.3.4.1 Environmental & Health Hazards
5.3.4.2 High Levels of Energy & Water Consumption By Cooling Equipment
5.3.5 Supply Chain
6 Market, By Type (Page No. - 49)
6.1 Critical Power Market, By Type
6.1.1 Uninterruptable Power Supply
6.1.2 Generators
6.1.3 Others
6.2 Cooling Market, By Type
6.2.1 Air Conditioning
6.2.2 Chilling Units
6.2.3 Cooling Towers
6.2.4 Liquid Cooling Systems
6.2.5 Others
7 Market, By End-Use (Page No. - 59)
7.1 Critical Power Market, By End-Use
7.1.1 Industrial
7.1.2 Commercial
7.1.3 IT & Telecommunication
7.1.4 Government & Defense
7.1.5 Transportation
7.2 Cooling Market, By Type
7.2.1 Industrial
7.2.2 Commercial
7.2.3 IT & Telecommunication
7.2.4 Transportation
7.2.5 Others
8 Market, By Region (Page No. - 69)
8.1 Introduction
8.2 North America
8.2.1 The U.S.
8.2.2 Canada
8.3 Europe
8.3.1 Germany
8.3.2 Russia
8.3.3 The U.K.
8.3.4 France
8.3.5 The Rest of Europe
8.4 Asia-Pacific
8.4.1 China
8.4.2 India
8.4.3 Japan
8.4.4 Australia
8.4.5 The Rest of Asia-Pacific
8.5 Middle East & Africa
8.5.1 Saudi Arabia
8.5.2 U.A.E.
8.5.3 Algeria
8.5.4 Kuwait
8.5.5 The Rest of Middle East & Africa
8.6 Latin America
8.6.1 Argentina
8.6.2 Brazil
8.6.3 Venezuela
8.6.4 Colombia
8.6.5 The Rest of Latin America
9 Competitive Landscape (Page No. - 99)
9.1 Overview
9.2 Market Ranking, for Critical Power, 2015
9.3 Market Ranking, for Cooling, 2015
9.4 Vendor Dive Matrix
9.5 Competitive Situation & Trends
10 Company Profiles (Page No. - 108)
(Overview, Products & Services, Strategies & Insights, Developments and MnM View)*
10.1 Schneider Electric
10.2 ABB
10.3 General Electric Company
10.4 Eaton Corporation
10.5 Delta Electronic, Inc.
10.6 Critical Power
10.7 Xiamen Kehua Hengsheng Co., Ltd.
10.8 Socomec
10.9 Falcon Electric, Inc.
10.10 Daikin Industries, Ltd.
10.11 Stulz GmbH
10.12 Asetek A/S
10.13 Vertiv Co.
10.14 ICS Cool Energy Limited
10.15 Piller Group GmbH
10.16 Riello Elettronica Group
10.17 Cyber Power Systems
10.18 Ac Power Corp. (Preen)
10.19 Connexa Energy
10.20 Siemens AG
10.21 SPX Corporation
10.22 Johnson Controls, Inc.
10.23 Nortek Air Solutions, LLC
10.24 Rittal GmbH & Co. Kg
10.25 Airedale International Air Conditioning, Ltd.
*Details on Overview, Products & Services, Strategies & Insights, Developments and MnM View Might Not Be Captured in Case of Unlisted Companies.
11 Appendix (Page No. - 156)
11.1 Insights of Industry Experts
11.2 Discussion Guide
11.3 Knowledge Store: Marketsandmarkets� Subscription Portal
11.4 Introducing RT: Real-Time Market Intelligence
11.5 Available Customizations
11.6 Related Reports
11.7 Author Details
List of Tables (60 Tables)
Table 1 Critical Power Market Size, By Type, 2014�2021 (USD Million)
Table 2 Uninterruptible Power Supply Market Size, By Region, 2014�2021 (USD Million)
Table 3 Generators Market Size, By Region, 2014�2021 (USD Million)
Table 4 Others Market Size, By Region, 2014�2021 (USD Million)
Table 5 Cooling Market Size, By Type, 2014�2021 (USD Million)
Table 6 Air Conditioning Market Size, By Region, 2014�2021 (USD Million)
Table 7 Chilling Units Market Size, By Region, 2014�2021 (USD Million)
Table 8 Cooling Towers Market Size, By Region, 2014�2021 (USD Million)
Table 9 Liquid Cooling Systems Market Size, By Region, 2014�2021 (USD Million)
Table 10 Others Market Size, By Region, 2014�2021 (USD Million)
Table 11 Critical Power Market Size, By End-Use, 2014�2021 (USD Million)
Table 12 Industrial Critical Power Market Size, By Region, 2014�2021 (USD Million)
Table 13 Commercial Critical Power Market Size, By Region, 2014�2021 (USD Million)
Table 14 IT & Telecommunication Critical Power Market Size, By Region, 2014�2021 (USD Million)
Table 15 Government & Defense Critical Power Market Size, By Region, 2014�2021 (USD Million)
Table 16 Transportation Critical Power Market Size, By Region, 2014�2021 (USD Million)
Table 17 Cooling Market Size, By End-Use, 2014�2021 (USD Million)
Table 18 Industrial Cooling Market Size, By Region, 2014�2021 (USD Million)
Table 19 Commercial Cooling Market Size, By Region, 2014�2021 (USD Million)
Table 20 IT & Telecommunication Cooling Market Size, By Region, 2014�2021 (USD Million)
Table 21 Transportation Cooling Market Size, By Region, 2014�2021 (USD Million)
Table 22 Others Cooling Market Size, By Region, 2014�2021 (USD Million)
Table 23 Critical Power & Cooling Market Size, By Region, 2014�2021 (USD Million)
Table 24 Critical Power Market Size, By Region, 2014�2021 (USD Million)
Table 25 Cooling Market Size, By Region, 2014�2021 (USD Million)
Table 26 North America: Critical Power & Cooling Market Size, By Country, 2014�2021 (USD Million)
Table 27 North America: Critical Power Market Size, By Country, 2014�2021 (USD Million)
Table 28 North America: Cooling Market Size, By Country, 2014�2021 (USD Million)
Table 29 North America: Critical Power Market Size, By Type, 2014�2021 (USD Million)
Table 30 North America: Cooling Market Size, By Type, 2014�2021 (USD Million)
Table 31 North America: Critical Power Market Size, By End-Use, 2014�2021 (USD Million)
Table 32 North America: Cooling Market Size, By End-Use, 2014�2021 (USD Million)
Table 33 Europe: Critical Power & Cooling Market Size, By Country, 2014�2021 (USD Million)
Table 34 Europe: Critical Power Market Size, By Country, 2014�2021 (USD Million)
Table 35 Europe: Cooling Market Size, By Country, 2014�2021 (USD Million)
Table 36 Europe: Critical Power Market Size, By Type, 2014�2021 (USD Million)
Table 37 Europe: Cooling Market Size, By Type, 2014�2021 (USD Million)
Table 38 Europe: Critical Power Market Size, By End-Use, 2014�2021 (USD Million)
Table 39 Europe: Cooling Market Size, By End-Use, 2014�2021 (USD Million)
Table 40 Asia-Pacific: Critical Power and Cooling Market Size, By Country, 2014�2021 (USD Million)
Table 41 Asia-Pacific: Critical Power Market Size, By Country, 2014�2021 (USD Million)
Table 42 Asia-Pacific: Cooling Market Size, By Country, 2014�2021 (USD Million)
Table 43 Asia-Pacific: Critical Power Market Size, By Type, 2014�2021 (USD Million)
Table 44 Asia-Pacific: Cooling Market Size, By Type, 2014�2021 (USD Million)
Table 45 Asia-Pacific: Critical Power Market Size, By End-Use, 2014�2021 (USD Million)
Table 46 Asia-Pacific: Cooling Market Size, By End-Use, 2014�2021 (USD Million)
Table 47 Middle East & Africa: Critical Power and Cooling Market Size, By Country, 2014�2021 (USD Million)
Table 48 Middle East & Africa: Critical Power Market Size, By Country, 2014�2021 (USD Million)
Table 49 Middle East & Africa: Cooling Market Size, By Country, 2014�2021 (USD Million)
Table 50 Middle East & Africa: Critical Power Market Size, By Type, 2014�2021 (USD Million)
Table 51 Middle East & Africa: Cooling Market Size, By Type, 2014�2021 (USD Million)
Table 52 Middle East & Africa: Critical Power Market Size, By End-Use, 2014�2021 (USD Million)
Table 53 Middle East & Africa: Cooling Market Size, By End-Use, 2014�2021 (USD Million)
Table 54 Latin America: Critical Power and Cooling Market Size, By Country, 2014�2021 (USD Million)
Table 55 Latin America: Critical Power Market Size, By Country, 2014�2021 (USD Million)
Table 56 Latin America: Cooling Market Size, By Country, 2014�2021 (USD Million)
Table 57 Latin America: Critical Power Market Size, By Type, 2014�2021 (USD Million)
Table 58 Latin America: Cooling Market Size, By Type, 2014�2021 (USD Million)
Table 59 Latin America: Critical Power Market Size, By End-Use, 2014�2021 (USD Million)
Table 60 Latin America: Cooling Market Size, By End-Use, 2014�2021 (USD Million)
List of Figures (43 Figures)
Figure 1 Critical Power and Cooling Market: Research Design
Figure 2 Breakdown of Primary Interviews: By Company Type, Designation, and Region
Figure 3 Market Size Estimation Methodology: Bottom-Up Approach
Figure 4 Market Size Estimation Methodology: Top-Down Approach
Figure 5 Data Triangulation Methodology
Figure 6 North America Accounted for the Largest Market Share of the Critical Power Market in 2015
Figure 7 North America Accounted for the Largest Market Share of the Cooling Market in 2015
Figure 8 North America is Expected to Dominate the Critical Power Market By 2021 USD Million
Figure 9 North America is Expected to Dominate the Cooling Market By 2021
Figure 10 The Ups Segment is Expected to Dominate the Critical Power Market, 2016�2021
Figure 11 The Air Conditioning Segment is Expected to Dominate the Cooling Market, 2016�2021
Figure 12 The Commercial Segment is Expected to Lead the Critical Power Market, 2016�2021
Figure 13 The Commercial Segment is Expected to Lead the Cooling Market, 2016�2021
Figure 14 Rise in Digitalization and Cloud Computing Drives the Critical Power and Cooling Market Durng the Forecast Period
Figure 15 The Asia-Pacific Market is Expected to Grow at the Highest CAGR During the Forecast Period
Figure 16 Asia-Pacific Region is Expected to Grow at the Fastest Rate During the Forecast Period
Figure 17 The Ups Segment is Expected to Dominate the Critical Power & Cooling Market By 2021
Figure 18 The Air Conditioning Segment is Expected to Dominate the Cooling Market By 2021
Figure 19 The Commercial Segment is Expected to Dominate the Critical Power & Cooling Market By 2021
Figure 20 Critical Power & Cooling Market: Market Segmentation
Figure 21 Critical Power & Cooling Market, By Type
Figure 22 Critical Power Market, By End-Use
Figure 23 Cooling Market, By End-Use
Figure 24 Critical Power & Cooling Market, By Region
Figure 25 Market Dynamics: Critical Power & Cooling Market
Figure 26 Electrification Rate vs Population in Africa
Figure 27 Urbanization Trend
Figure 28 Critical Power & Cooling Market: Supply Chain
Figure 29 The Ups Segment is Expected to Dominate the Market During the Forecast Period
Figure 30 The Air Conditioning Segment is Expected to Dominate the Market During the Forecast Period
Figure 31 Critical Power & Cooling Market, By Region, 2015
Figure 32 Regional Snapshot (2015): North America is the Largest Market for Critical Power and Cooling Market
Figure 33 Asia-Pacific: the Fastest Growing Critical Power & Cooling Market, 2016�2021
Figure 34 North America: Critical Power & Cooling Market Overview
Figure 35 Europe: Critical Power & Cooling Market Overview
Figure 36 Companies Adopted New Product & Technology Launches as the Key Growth Strategy, 2014�2017
Figure 37 Market Ranking, for Critical Power, 2015
Figure 38 Market Ranking, for Cooling, 2015
Figure 39 Critical Power & Cooling Market: Vendor Dive Matrix
Figure 40 Product Offering Comparison
Figure 41 Business Strategy Comparison
Figure 42 Market Evaluation Framework, 2014�2017
Figure 43 Battle for Market Share (2014�2017): Contracts & Agreements Was the Key Strategy


Growth opportunities and latent adjacency in Critical Power and Cooling Market