DC Power Supplies Market by Type(AC-DC, & DC-DC), Output Power(Up to 10 kW,10�100 kW, & 100-250 kW), Application(Aerospace, Defence & Government Services; Automotive; Energy; Wireless Communication & Infrastructure, Others), Region - Global Forecast to 2024


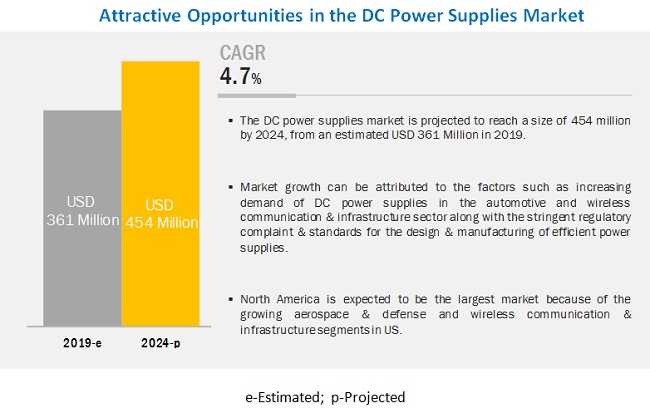
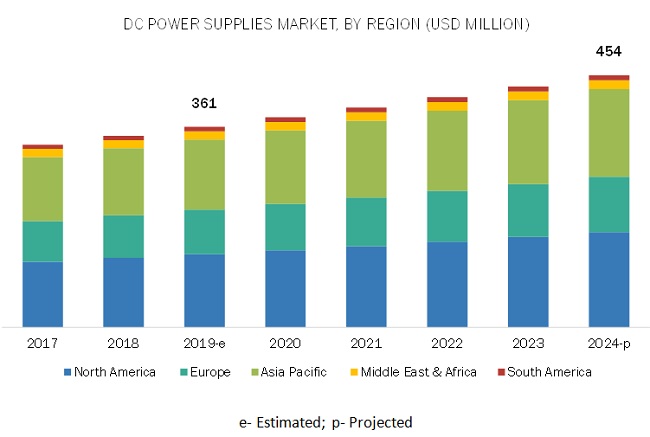
[146 Pages Report] The global DC power supplies market size was valued at $361 million in 2019 and to reach $454 million by 2024, growing at a compound annual growth rate (CAGR) of 4.7% from 2019 to 2024. The growth of the market is attributed to the growing wireless communication & infrastructure and aerospace & defense segment in countries such as US & Canada and growing demand for industrial automation and consumer electronics sector in countries such as India, China, and Japan.
The automotive segment is projected to be the largest DC power supplies market, by application, during the forecast period
The market has been segmented, by application, into aerospace, defense & government services, automotive, energy, wireless communication & infrastructure, and others. The automotive segment is estimated to be the largest DC power supply market during the forecast period.
Power battery testing, fuel cell testing, AC/DC charging station, DC-DC converter testing, on-board chargers & charging interface testing, and high power battery testing are some of the areas wherein automotive electronic testing is done using DC power supplies.
The AC-DC segment in DC power supplies industry is projected to be the fastest-growing market during the forecast period
The DC power supplies market has been segmented, by type, into AC-DC and DC-DC. The AC-DC segment is estimated to be the fastest-growing during the forecast period. The rise in demand for AC-DC power supplies for various testing & measurement applications of medical & industrial equipment is expected to drive this segment in the DC power supplies market.
The high output (100–250 kW) segment is projected to be the fastest-growing DC power supplies market, by output power, during the forecast period
The DC Power Supplies market has been categorized based on output-power such as low output (up to 10 kW), medium output (10–100 kW), and high output (100–250 kW). The high output (100–250 kW) segment is expected to be the fastest-growing market during the forecast period.
The high output power supplies are mainly the programmable ones primarily used to for automotive test equipment (ATE), semiconductor fabrications, aerospace & military, energy storage, and others. A few key features of these high output power supplies are consistent controls, broad voltage-current range, high frequency, and enhanced design. The requirement to test the products that undergo harsh, rugged and extensive environmental conditions for operational duties by military & avionics is expected to drive the growth for the high output power supplies in the DC power supplies market.
North America is projected to be the largest market during the forecast period
In this report, the DC power supplies market is segmented into five regions, namely, Asia Pacific, Europe, North America, South America, and the Middle East & Africa. North America is predicted to account for the largest DC power supply market share from 2019 to 2024.
Also, it is expected to be the fastest-growing market for DC power supplies during the forecast period. The growing wireless communication & infrastructure and aerospace & defense segment in countries such as the US & Canada is likely to boost the demand of DC power supplies market in the region.
Key Market Players
The major players in the DC power supplies market are Keysight Technologies (US), TDK Lambda (Japan), Chroma ATE (Taiwan), Good Will Instrument (Taiwan), Rohde & Schwarz (Germany), and B&K Precision (US), Tektronix (US), and MEAN WELL (Taiwan).
Keysight Technologies is one of the leading electronic measurement company. Keysight Technologies operates through 4 business segments, namely, communications solutions group, electronic industrial solutions group, services solutions group, and ixia solutions group. The company offers DC power supplies through its electric industrial solutions group business segment. Keysight Technologies offers a wide range of software-driven test and measurement equipment under its electronic industrial solutions group segment. The product range includes digital multimeters, function generators, waveform synthesizers, counters, data acquisition, audio analyzers, LCR Meters, thermal imaging, low-cost USB modular, precision source measurement units, ultra-high precision device current analyzers, test executive software platforms, and a variety of DC power supplies. The company actively focuses on both organic and inorganic strategies to increase its global market share. For instance, in May 2019, the company launched a new E36200 series of single and dual output power supplies. As a part of its inorganic strategy, in December 2015, Keysight Technologies won a contract to supply DC Power Supplies for the Electronic Engineering Teaching Lab of the University of Sheffield.
Scope of the Report
|
Report Metric |
Details |
|
Market size available for years |
2017–2024 |
|
Base year considered |
2018 |
|
Forecast period |
2019–2024 |
|
Forecast units |
Value (USD) |
|
Segments covered |
Type, Output Power, Application, and Region |
|
Geographies covered |
Asia Pacific, North America, Europe, South America, and the Middle East & Africa |
|
Companies covered |
AMETEK (US), Keysight Technologies (US), TDK Lambda (Japan), Chroma ATE (Taiwan), Good Will Instrument (Taiwan), Rohde & Schwarz (Germany), and B&K Precision (US), MEAN WELL (Taiwan), Tektronix (US), Matsusada Precision (Japan), Kikusui Electronics (Japan), and Itech Electronic |
This research report categorizes the DC power supplies market by type, output power, application, and region.
By Type
- AC-DC
- DC-DC
By Output power
- Low Output (Up to 10 kW)
- Medium Output (10–100 kW)
- High Output (100–250 kW)
By Application
- Aerospace, Defense, & Government Services
- Automotive
- Energy
- Wireless Communication & Infrastructure
- Others
By Region:
- Asia Pacific
- North America
- Europe
- South America
- Middle East & Africa
Key Questions Addressed by the Report
- What are the revolutionary technology trends that could be witnessed over the next five years?
- What will be the revenue pockets for the DC power supplies market in the next five years?
- Which of the type segments will have the maximum opportunity to grow during the forecast period?
- Which will be the leading regions with the largest market share by 2024?
- How are the companies implementing organic and inorganic strategies to gain increased DC power supplies market share?
Frequently Asked Questions (FAQ):
What are the revolutionary technology trends that could be witnessed over the next five years?
The increasing demand for DC power supplies in the IoT test applications is the growing trend that can be witnessed over the next five years. As the popularity of IoT is increasing day-by-day, a lot of devices can now be connected via the internet. Many DC power supply manufacturers are now providing power electronics test for the devices which are connected via the internet. Manufacturers provide power supply test solutions in various applications and fields, such as wireless communications, automobile devices, wearable devices, medical care, smart home, and many others which are connected usually through the internet.
What will be the revenue pockets for the DC power supplies market in the next five years?
Increasing usage of DC power supplies in medical & healthcare devices will be the revenue pockets over the next five years.
Which segment will have the maximum opportunity to grow during the forecast period?
The rising demand for DC power supplies in numerous industrial & medical equipment testing is expected to bring the maximum opportunity for the AC-DC segment, by type, in the DC power supplies market.
Which will be the leading regions with the largest market share by 2024?
North America is the leading region with the largest market share.
How are the companies implementing organic and inorganic strategies to gain increased DC power supplies market share?
As a part of the organic strategy, companies are adopting new product launches, and as a part of inorganic strategies companies are adopting contracts & agreements and mergers & acquisitions to increase their market share.
To speak to our analyst for a discussion on the above findings, click Speak to Analyst
 Exclusive indicates content/data unique to MarketsandMarkets and not available with any competitors.
Table of Contents
1 Introduction (Page No. - 17)
1.1 Objectives of the Study
1.2 Definition
1.2.1 DC Power Supplies Market, By Output Power: Inclusions & Exclusions
1.2.2 Market Terminology, By Application: Inclusions & Exclusions
1.3 Market Scope
1.3.1 Market Segmentation
1.3.2 Regional Scope
1.4 Years Considered for the Study
1.5 Currency
1.6 Limitations
1.7 Stakeholders
2 Research Methodology (Page No. - 21)
2.1 Research Data
2.1.1 Secondary Data
2.1.1.1 Key Data From Secondary Sources
2.1.1.1 Key Data From Primary Sources
2.1.1.2 Breakdown of Primaries
2.2 Scope
2.3 Market Size Estimation
2.3.1 Supply-Side Analysis
2.3.1.1 Assumptions
2.3.1.1.1 Key Primary Insights
2.3.1.2 Calculation
2.3.2 Demand Analysis
2.3.2.1 Key Parameters / Trends
2.3.3 Forecast
2.4 Market Breakdown and Data Triangulation
2.5 Some of the Insights of Industry Experts
3 Executive Summary (Page No. - 31)
4 Premium Insights (Page No. - 35)
4.1 Attractive Opportunities in the DC Power Supplies Market During the Forecast Period
4.2 Market, By Region
4.3 Market, By Type
4.4 Market, By Output Power
4.5 Market, By Application
5 Market Overview (Page No. - 38)
5.1 Introduction
5.2 Market Dynamics
5.2.1 Drivers
5.2.1.1 Increasing Demand for Energy-Efficient DC Power Supplies
5.2.1.2 Growing Demand for DC Power Supplies in IoT Test Applications
5.2.2 Restraints
5.2.2.1 Imposition of Regional/Country-Wise Regulatory Compliance and Safety Standards
5.2.3 Opportunities
5.2.3.1 Growing Usage of DC Power Supplies in Medical & Healthcare Devices
5.2.3.2 Increasing Number of Data Centers
5.2.4 Challenges
5.2.4.1 Grey Market Providing Low-Quality Products
5.2.4.2 Difficulty in Adapting to the Device’s System Interface
6 DC Power Supplies Market, By Type (Page No. - 42)
6.1 Introduction
6.2 AC-DC
6.2.1 The Rising Demand for DC Power Supplies in Industrial & Medical Equipment Testing is Expected to Drive the AC-DC Segment
6.3 DC-DC
6.3.1 The Growing Demand for Electronic Component Testing in Automotive and Aeronautics & Space Industries is Expected to Propel the DC-DC Segment
7 DC Power Supplies Market, By Output Power (Page No. - 46)
7.1 Introduction
7.2 Low Output (Up to 10 kW)
7.2.1 Growing Usage to DC Power Supplies to Test Low Power Automotive Components and Consumer Electronics is Expected to Boost Demand
7.3 Medium Output (10–100 kW)
7.3.1 The Increasing Demand for Medium Output Power Supplies in Automotive Electronics and Laboratory Instruments is Anticipated to Boost Demand
7.4 High Output (100–250 kW)
7.4.1 The Growing Demand for DC Power Supplies in Avionics & Military is Likely to Drive Demand
8 DC Power Supplies Market, By Application (Page No. - 51)
8.1 Introduction
8.2 Aerospace, Defense & Government Services
8.2.1 The Rising Demand for Reliable Power Supplies Suited to Extreme Environmental Conditions is Expected to Propel the Aerospace, Defense & Government Services Segment
8.3 Automotive
8.3.1 Rising Demand for Power Supplies Testing in Hybrid & Electric Vehicle Components is Expected to Drive the Market for DC Power Supplies
8.4 Energy
8.4.1 Increasing Usage of Power Supplies in Renewables is Likely to Boost the Market
8.5 Wireless Communication & Infrastructure
8.5.1 Huge Power Consumption in Data Centers and Increasing Demand for AC-DC and DC-DC Power Supplies in the Telecommunication Sector is Anticipated to Propel This Segment
8.6 Others
9 DC Power Supplies Market, By Region (Page No. - 58)
9.1 Introduction
9.2 North America
9.2.1.1 US
9.2.1.2 Expansion of Wireless Network and Advancements in Medical Equipment are Expected to Drive Market
9.2.2 Canada
9.2.2.1 Stringent Energy Efficiency Regulations and Standards for Power Electronic Products are Expected to Fuel Market
9.2.3 Mexico
9.2.3.1 Increasing Expenditure on Healthcare & Consumer Electronics is Expected to Fuel Market
9.3 Asia Pacific
9.3.1 India
9.3.1.1 Government Initiatives and Increased Manufacturing Activity in the Automation Sector are Expected to Fuel Market
9.3.2 Australia
9.3.2.1 Rising Demand for DC Power Supplies in Medical Laboratories is Expected to Propel Overall Market
9.3.3 Japan
9.3.3.1 Rising Demand for Testing Automation Gadgets & Devices in Street Lighting, and Industrial Applications is Expected to Fuel Market
9.3.4 South Korea
9.3.4.1 Increasing Production of Electronics By Large Local Manufacturers is Expected to Fuel Market
9.3.5 China
9.3.5.1 Widespread Use of Consumer Electronics and Stringent Rohs Compliance is Expected to Drive Market
9.3.6 Rest of Asia Pacific
9.4 Europe
9.4.1 Russia
9.4.1.1 Increasing Demand in Automotive Sector for Electrical Component Testing Using DC Power Supplies is Driving the Market
9.4.2 Spain
9.4.2.1 Rising Demand for Hybrid & Electric Vehicle Component Testing is Likely to Boost Market
9.4.3 France
9.4.3.1 Growing Demand in Aerospace & Defense Sector for DC Power Supplies to Test Electric Components is Likely to Boost Market
9.4.4 Germany
9.4.4.1 Increasing Investments in the Automobile Industry and Digitalization are Driving Market
9.4.5 UK
9.4.5.1 Increasing Investments in, and Expansion Of, Data Centers Driving Market
9.4.6 Italy
9.4.6.1 Wide Usage of DC Power Supplies in Industrial Machinery Testing and Increasing Investments in Advanced Manufacturing Technologies Driving Market
9.4.7 Rest of Europe
9.5 Middle East & Africa
9.5.1 Middle East
9.5.1.1 Growing Investments in the Healthcare Sector in UAE and Increasing Expenditure in the Telecom Sector in Saudi Arabia Likely to Drive the Market
9.5.2 Africa
9.5.2.1 Upgrades in Healthcare Infrastructure Expected to Boost Market
9.6 South America
9.6.1 Brazil
9.6.1.1 Stringent Regulations to Monitor Medical & Healthcare Devices Likely to Drive the Market
9.6.2 Argentina
9.6.2.1 Government Initiatives to Push Electric Vehicles and Increasing Investments in the Telecom Sector Likely to Drive the Market
9.6.3 Chile
9.6.3.1 Growing Investments in Communication Services & Infrastructure Likely to Drive the Market
10 Competitive Landscape (Page No. - 98)
10.1 Introduction
10.2 Market Share Analysis
10.3 Competitive Scenario
10.3.1 New Product Launches
10.3.2 Investments & Expansions
10.3.3 Contracts & Agreements
10.3.4 Partnerships & Collaborations
10.4 Competitive Leadership Mapping
10.4.1 Visionary Leaders
10.4.2 Innovators
10.4.3 Dynamic Differentiators
10.4.4 Emerging
11 Company Profiles (Page No. - 104)
(Business Overview, Products Offered, Recent Developments, SWOT Analysis, MnM View)*
11.1 Keysight Technologies
11.2 AMETEK
11.3 Chroma ATE
11.4 Good Will Instrument
11.5 B&K Precision
11.6 TDK Lambda
11.7 Mean Well
11.8 Artesyn Embedded Power
11.9 Acopian
11.10 Rohde & Schwarz
11.11 Itech Electronic
11.12 Tektronix
11.13 Matsusada Precision
11.14 Kikusui Electronics
11.15 Magna-Power
11.16 Regatron
11.17 AIM-TTI
11.18 Sophpower Electronics
11.19 Adaptive Power Systems
11.20 Zenone Elettronica
*Details on Business Overview, Products Offered, Recent Developments, SWOT Analysis, MnM View Might Not Be Captured in Case of Unlisted Companies.
12 Appendix (Page No. - 139)
12.1 Insights of Industry Experts
12.2 Discussion Guide
12.3 Knowledge Store: Marketsandmarkets’ Subscription Portal
12.4 Available Customizations
12.5 Related Reports
12.6 Author Details
List of Tables (103 Tables)
Table 1 DC Power Supplies Market: Players/Companies Connected
Table 2 Market: Industry / Country Analysis
Table 3 Market Snapshot
Table 4 Regulatory Compliance & Safety Standards
Table 5 Market Size, By Type, 2017–2024 (USD Thousand)
Table 6 AC-DC: Market, By Region, 2017–2024 (USD Thousand)
Table 7 DC-DC: Market, By Region, 2017–2024 (USD Thousand)
Table 8 Market Size, By Output Power, 2017–2024 (USD Thousand)
Table 9 Low Output (Up to 10 kW): Market Size, By Region, 2017–2024 (USD Thousand)
Table 10 Medium Output (10–100 kW): Market Size, By Region, 2017–2024 (USD Thousand)
Table 11 High Output (100–250 kW): Market Size, By Region, 2017–2024 (USD Thousand)
Table 12 Market Size, By Application, 2017–2024 (USD Thousand)
Table 13 Aerospace, Defense & Government Services: Market, By Region, 2017–2024 (USD Thousand)
Table 14 Automotive: Market, By Region, 2017–2024 (USD Thousand)
Table 15 Energy: Market, By Region, 2017–2024 (USD Thousand)
Table 16 Wireless Communication & Infrastructure: Market, By Region, 2017–2024 (USD Thousand)
Table 17 Others: Market, By Region, 2017–2024 (USD Thousand)
Table 18 Market Size, By Region, 2017–2024 (USD Thousand)
Table 19 North America: Market Size, By Type, 2017–2024 (USD Thousand)
Table 20 North America: Market Size, By Application, 2017–2024 (USD Thousand)
Table 21 North America: Market Size, By Output Power, 2017–2024 (USD Thousand)
Table 22 North America: Market Size, By Country, 2017–2024 (USD Thousand)
Table 23 US: Market Size, By Type, 2017–2024 (USD Thousand)
Table 24 US: Market Size, By Application, 2017–2024 (USD Thousand)
Table 25 US: Market Size, By Output Power, 2017–2024 (USD Thousand)
Table 26 Canada: Market Size, By Type, 2017–2024 (USD Thousand)
Table 27 Canada: Market Size, By Application, 2017–2024 (USD Thousand)
Table 28 Canada: Market Size, By Output Power, 2017–2024 (USD Thousand)
Table 29 Mexico: Market Size, By Type, 2017–2024 (USD Thousand)
Table 30 Mexico: Market Size, By Application, 2017–2024 (USD Thousand)
Table 31 Mexico: Market Size, By Output Power, 2017–2024 (USD Thousand)
Table 32 Asia Pacific: Market Size, By Type, 2017–2024 (USD Thousand)
Table 33 Asia Pacific: Market Size, By Application, 2017–2024 (USD Thousand)
Table 34 Asia Pacific: Market Size, By Output Power, 2017–2024 (USD Thousand)
Table 35 Asia Pacific: Market Size, By Country, 2017–2024 (USD Thousand)
Table 36 India: Market Size, By Type, 2017–2024 (USD Thousand)
Table 37 India: Market Size, By Application, 2017–2024 (USD Thousand)
Table 38 India: Market Size, By Output Power, 2017–2024 (USD Thousand)
Table 39 Australia: Market Size, By Type, 2017–2024 (USD Thousand)
Table 40 Australia: Market Size, By Application, 2017–2024 (USD Thousand)
Table 41 Australia: Market Size, By Output Power, 2017–2024 (USD Thousand)
Table 42 Japan: Market Size, By Type, 2017–2024 (USD Thousand)
Table 43 Japan: Market Size, By Application, 2017–2024 (USD Thousand)
Table 44 Japan: Market Size, By Output Power, 2017–2024 (USD Thousand)
Table 45 South Korea: Market Size, By Type, 2017–2024 (USD Thousand)
Table 46 South Korea: Market Size, By Application, 2017–2024 (USD Thousand)
Table 47 South Korea: Market Size, By Output Power, 2017–2024 (USD Thousand)
Table 48 China: Market Size, By Type, 2017–2024 (USD Thousand)
Table 49 China: Market Size, By Application, 2017–2024 (USD Thousand)
Table 50 China: Market Size, By Output Power, 2017–2024 (USD Thousand)
Table 51 Rest of Asia Pacific: Market Size, By Type, 2017–2024 (USD Thousand)
Table 52 Rest of Asia Pacific: Market Size, By Application, 2017–2024 (USD Thousand)
Table 53 Rest of Asia Pacific: Market Size, By Output Power, 2017–2024 (USD Thousand)
Table 54 Europe: Market Size, By Type, 2017–2024 (USD Thousand)
Table 55 Europe: Market Size, By Application, 2017–2024 (USD Thousand)
Table 56 Europe: Market Size, By Output Power, 2017–2024 (USD Thousand)
Table 57 Europe: Market Size, By Country, 2017–2024 (USD Thousand)
Table 58 Russia: Market Size, By Type, 2017–2024 (USD Thousand)
Table 59 Russia: Market Size, By Application, 2017–2024 (USD Thousand)
Table 60 Russia: Market Size, By Output Power, 2017–2024 (USD Thousand)
Table 61 Spain: Market Size, By Type, 2017–2024 (USD Thousand)
Table 62 Spain: Market Size, By Application, 2017–2024 (USD Thousand)
Table 63 Spain: Market Size, By Output Power, 2017–2024 (USD Thousand)
Table 64 France: Market Size, By Type, 2017–2024 (USD Thousand)
Table 65 France: Market Size, By Application, 2017–2024 (USD Thousand)
Table 66 France: Market Size, By Output Power, 2017–2024 (USD Thousand)
Table 67 Germany: Market Size, By Type, 2017–2024 (USD Thousand)
Table 68 Germany: Market Size, By Application, 2017–2024 (USD Thousand)
Table 69 Germany: Market Size, By Output Power, 2017–2024 (USD Thousand)
Table 70 UK: Market Size, By Type, 2017–2024 (USD Thousand)
Table 71 UK: Market Size, By Application, 2017–2024 (USD Thousand)
Table 72 UK: Market Size, By Output Power, 2017–2024 (USD Thousand)
Table 73 Italy: Market Size, By Type, 2017–2024 (USD Thousand)
Table 74 Italy: Market Size, By Application, 2017–2024 (USD Thousand)
Table 75 Italy: Market Size, By Output Power, 2017–2024 (USD Thousand)
Table 76 Rest of Europe: Market Size, By Type, 2017–2024 (USD Thousand)
Table 77 Rest of Europe: Market Size, By Application, 2017–2024 (USD Thousand)
Table 78 Rest of Europe: Market Size, By Output Power, 2017–2024 (USD Thousand)
Table 79 Middle East & Africa: Market Size, By Type, 2017–2024 (USD Thousand)
Table 80 Middle East & Africa: Market Size, By Application, 2017–2024 (USD Thousand)
Table 81 Middle East & Africa: Market Size, By Output Power, 2017–2024 (USD Thousand)
Table 82 Middle East & Africa: Market Size, By Sub Region, 2017–2024 (USD Thousand)
Table 83 Middle East: Market Size, By Type, 2017–2024 (USD Thousand)
Table 84 Middle East: Market Size, By Application, 2017–2024 (USD Thousand)
Table 85 Middle East: Market Size, By Output Power, 2017–2024 (USD Thousand)
Table 86 Africa: Market Size, By Type, 2017–2024 (USD Thousand)
Table 87 Africa: Market Size, By Application, 2017–2024 (USD Thousand)
Table 88 Africa: Market Size, By Output Power, 2017–2024 (USD Thousand)
Table 89 South America: Market Size, By Type, 2017–2024 (USD Thousand)
Table 90 South America: Market Size, By Application, 2017–2024 (USD Thousand)
Table 91 South America: Market Size, By Output Power, 2017–2024 (USD Thousand)
Table 92 South America: Market Size, By Country, 2017–2024 (USD Thousand)
Table 93 Brazil: Market Size, By Type, 2017–2024 (USD Thousand)
Table 94 Brazil: Market Size, By Application, 2017–2024 (USD Thousand)
Table 95 Brazil: Market Size, By Output Power, 2017–2024 (USD Thousand)
Table 96 Argentina: Market Size, By Type, 2017–2024 (USD Thousand)
Table 97 Argentina: Market Size, By Application, 2017–2024 (USD Thousand)
Table 98 Argentina: Market Size, By Output Power, 2017–2024 (USD Thousand)
Table 99 Chile: Market Size, By Type, 2017–2024 (USD Thousand)
Table 100 Chile: Market Size, By Application, 2017–2024 (USD Thousand)
Table 101 Chile: Market Size, By Output Power, 2017–2024 (USD Thousand)
Table 102 Market Share Analysis, 2018
Table 103 Developments of Key Players in the Market, January 2016–December 2019
List of Figures (34 Figures)
Figure 1 DC Power Supplies Market: Research Design
Figure 2 Research Methodology: Illustration of DC Power Supplies Company Revenue Estimation (2018)
Figure 3 Ranking of Key Players & Industry Concentration, 2018
Figure 4 Data Triangulation
Figure 5 North America Dominated the Market
Figure 6 AC-DC Segment is Expected to Lead Market During the Forecast Period
Figure 7 Low Output (Up to 10 kW) Segment is Expected to Lead the Market During the Forecast Period
Figure 8 Automotive Segment is Expected to Lead the Market During the Forecast Period
Figure 9 Rising Demand for DC Power Supplies in the Automotive and Wireless Communicaton & Infrastructure Sectors, and Stringent Regulations are Driving the Market, 2019–2024
Figure 10 The North American Market is Expected to Grow at the Highest CAGR During the Forecast Period
Figure 11 The AC-DC Segment Dominated the Market in 2018
Figure 12 The Low Output (Up to 10 kW) Segment Dominated the Market in 2018
Figure 13 The Automotive Segment Dominated the Market in 2018
Figure 14 DC Power Supplies Market: Drivers, Restraints, Opportunities, and Challenges
Figure 15 AC-DC Segment Accounted for the Largest Market Share in 2018
Figure 16 Low Output (Up to 10 kW) Segment Accounted for the Largest Market Share in 2018
Figure 17 Automotive Segment Accounted for the Largest Market Share in 2018
Figure 18 Regional Snapshot: North America Market is Expected to Grow at the Highest CAGR During the Forecast Period
Figure 19 DC Power Supplies Market Share (Value), By Region, 2018
Figure 20 North America: Market Snapshot
Figure 21 Asia Pacific: Market Snapshot
Figure 22 Key Developments in the Market Between January 2016–December 2019
Figure 23 DC Power Supplies Market Competitive Leadership Mapping
Figure 24 Keysight Technologies: Company Snapshot
Figure 25 Keysight Technologies: SWOT Analysis
Figure 26 AMETEK: Company Snapshot
Figure 27 AMETEK: SWOT Analysis
Figure 28 Chroma ATE: Company Snapshot
Figure 29 Chroma ATE: SWOT Analysis
Figure 30 Good Will Instrument: SWOT Analysis
Figure 31 TDK Lambda: Company Snapshot
Figure 32 TDK Lambda: SWOT Analysis
Figure 33 Mean Well: SWOT Analysis
Figure 34 Rohde & Schwarz: Company Snapshot
This study involved four major activities in estimating the current size of the DC power supplies market. Exhaustive secondary research was done to collect information on the market, the peer market, and the parent market. The next step was to validate these findings, assumptions, and market sizing with industry experts across the value chain through rigorous primary research. Both top-down and bottom-up approaches were used to estimate the total market size. The market breakdown and data triangulation techniques were employed to estimate the market size of the segments and the corresponding subsegments.
Secondary Research
This research study involved the use of extensive secondary sources, directories, and databases, such as UNCTAD data, industry publications, several newspaper articles, Statista Industry Journal, Factiva, and DC power supplies journal, to identify and collect information useful for a technical, market-oriented, and commercial study of the DC power supplies market. The other secondary sources included annual reports, press releases & investor presentations of companies, white papers, certified publications, articles by recognized authors, manufacturer associations, trade directories, and databases.
Primary Research
The DC power supplies market comprises several stakeholders such as government & research organizations, institutional investors, investors/shareholders, manufacturers’ associations, DC power supplies product manufacturers, and DC power supplies original equipment manufacturers (OEMs). The supply side is characterized by the increasing adoption of new product launches, contracts & agreements, and investments & expansions among leading players. Various primary sources from both the supply and demand sides of the market were interviewed to obtain qualitative and quantitative information. The breakdown of primary respondents is given below:
To know about the assumptions considered for the study, download the pdf brochure
Market Size Estimation
Both top-down and bottom-up approaches were used to estimate and validate the size of the global DC power supplies market and its dependent submarkets. These methods were also extensively used to determine the size of various subsegments in the market. The research methodology used to estimate the market size includes the following:
- The key players in the industry and market were identified through extensive secondary research, and their market shares in the respective regions were determined through both primary and secondary research.
- The industry’s supply chain and market size, in terms of value, were determined through primary and secondary research processes.
- All percentage shares split, and breakdowns were determined using secondary sources and verified through primary sources.
Data Triangulation
After arriving at the overall market size—using the market size estimation processes as explained above—the market was split into several segments and subsegments. To complete the entire market engineering process and arrive at the exact statistics of each market segment and subsegment, the data triangulation, and market breakdown procedures were employed, wherever applicable. The data was triangulated by studying various factors and trends from both the demand and supply sides in the DC power supplies market.
Report Objectives
- To define, describe, segment, and forecast the DC power supplies market by type, output power, application, and region
- To provide detailed information on the significant factors influencing the growth of the market (drivers, restraints, opportunities, and industry-specific challenges)
- To strategically analyze the market for individual growth trends, future expansions, and contribution of each segment to the market
- To analyze market opportunities for stakeholders and details of the competitive landscape for market leaders
- To forecast the growth of the market for the regions, namely, Asia Pacific, North America, Europe, South America, and the Middle East & Africa
- To profile and rank key players and comprehensively analyze their respective market shares
- To analyze competitive developments such as contracts & agreements, investments & expansions, new product launches, and mergers & acquisitions in the DC power supplies market
Available Customizations:
With the given market data, MarketsandMarkets offers customizations as per the client’s specific needs. The following customization options are available for this report:
Regional Analysis
- Further breakdown of region or country-specific analysis
Company Information
- Detailed analysis and profiling of additional market players (up to 5)


Growth opportunities and latent adjacency in DC Power Supplies Market