Digital Badges Market

Digital Badges Market by Offering (Platforms and Services), Type (Certification, Participation, Recognition, Achievement, Contribution), End User (Academic, Corporate, Government, Non-profit Organizations) and Region - Global Forecast to 2028

Report Code: TC 6508 Jul, 2023, by marketsandmarkets.com

Digital Badges Market Size, Key Insights & Analysis

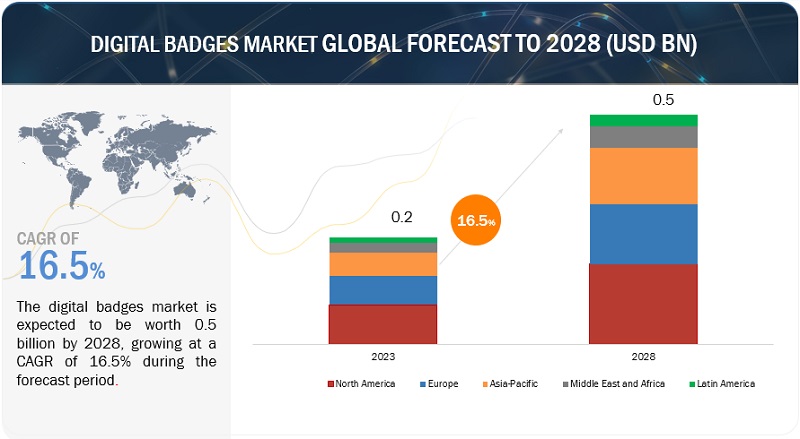
The size of the Digital Badges Market is projected to grow at a CAGR of 16.5% during the forecast period to reach USD 0.5 billion by 2028 from an estimated USD 0.2 billion in 2023. Using blockchain technology in the digital badge enhances security, prevents fraud, and builds trust among the issuers.
Digital Badges Market

To know about the assumptions considered for the study, Request for Free Sample Report
Digital Badges Market

To know about the assumptions considered for the study, download the pdf brochure

Digital Badges Market Dynamics

Driver: Increasing focus on employees’ professional development

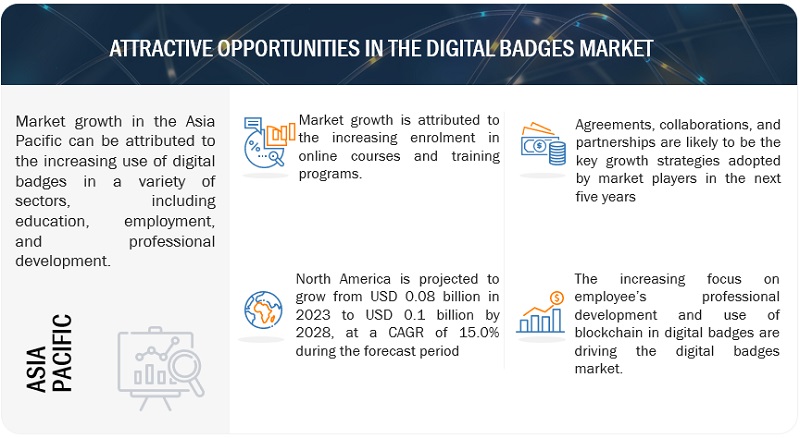
Businesses invest a lot of resources on the professional development of employees.  Professional development programs have been introduced by a number of large businesses, including IBM, SAP, SAS, and Oracle, to support the culture of ongoing learning and development. The visible recognition of staff skills through the digital badge system promotes professional development. Employees are encouraged to take part in professional development programs, and their completion of learning programs is acknowledged. Similar to this, IBM has introduced a number of courses and gives its staff members the chance to advance their education and demonstrate their expertise by earning digital badges.

Restraint: Lack of IT infrastructure in developing countries

For the market for digital badges to expand, a strong IT infrastructure is one of the key factors. Digital badge implementation in educational institutions is hampered by poor IT infrastructure. For example, due to a lack of suitable IT infrastructures and connectivity options, the adoption of digital badges in Africa continues to be raised.  There is virtually limited internet usage in nations like Nigeria, Kenya, and Uganda. An additional obstacle to the expansion of the digital badges market is the absence of proper roadmaps for utilizing digital technologies, such as eLearning, social learning, and adaptive learning in emerging nations.

Opportunity: Gamification in the education industry

Gaming-based learning is known as gamification. It is fundamentally a collection of course materials that functions like a game and is growing in popularity among students. It enables the application of game-design ideas to engage students in problem-solving. Gamification brings 3 major elements, i.e., mechanical components, personal aspects, and emotional components in the education industry. Additionally, it encourages reluctant and unmotivated students to participate in the learning process. Gamification provides students with a secure setting in which to overcome obstacles in practical settings. This idea is centered on providing learners with interactive experiences to encourage motivating learning. Many digital badge vendors are attempting to seize this market potential. They supply badging APIs that are combined with gamification tools in learning programs.

Challenge: Lack of digital badge equivalents

One of the key issues impeding the growth of digital badges is the lack of an equivalent. Badges awarded by an organization or region are rarely accepted by other institutions or nations.  Equivalence is one of the most important considerations when introducing digital badges in academic institutions like schools and colleges. Both validating and portable badges are required. Across a range of issuers and audiences, they must share the same instantly recognizable characteristics.  

Digital badges market Ecosystem

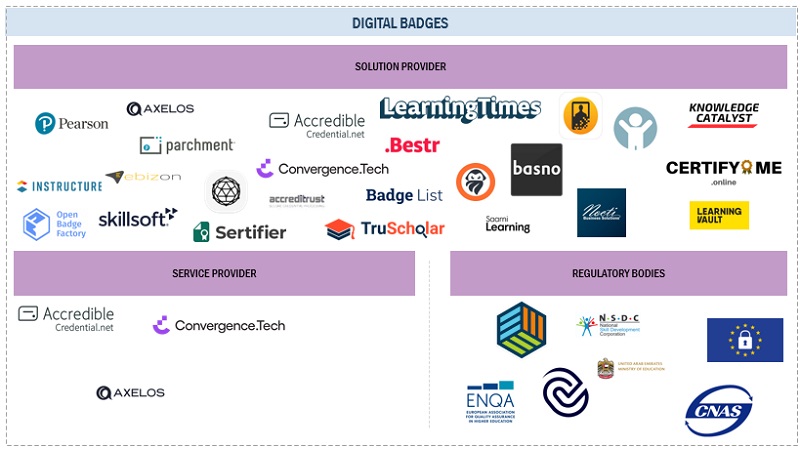
The digital badges market comprises solution providers, service providers, regulatory bodies, and end users working together to deliver digital badges solutions for skill enhancement and motivation.
Digital Badges Market

By offering, services segment holds the highest growth rate during the forecast period.

Market vendors provide digital badge services to help badge issuers set up an easy issuance process. Designing, development and support, training, and advising services are just a few of platform providers' many professional services. Designing services also involve graphic and program design. Service providers can aid in the process design for issuing badges. They may assist in defining the appropriate proof, establishing learner criteria, outlining the awarding process, and many other things. The platform interface and brand selection are both included in the visual design services. Services for development and support include assistance for development and maintenance problems and end-user support available around the clock. Training services aid in educating program managers about a company's digital credential program.

By end user, government is expected to register the fastest growth rate during the forecast period.

Digital Badges are slowly growing in Government organizations as it has significant benefits it implemented correctly can help efficiently operations within any kind of organization. Digital badges enable government agencies to validate and manage the skills and competencies of their employees. By awarding badges for specific training programs, certifications, or achievements, agencies can ensure that their workforce possesses the necessary expertise to fulfill their roles effectively. This promotes accountability and helps align employee skills with organizational objectives. Digital badges provide a standardized approach to skill recognition and competency assessment across government agencies. Badge programs can be designed based on established frameworks and industry standards, ensuring consistency in training and development efforts. Digital badges contribute to public transparency and trust in government services. By showcasing badges earned for compliance training, ethics, or specialized expertise, agencies can demonstrate their commitment to accountability and professionalism. Badges can be publicly displayed on government websites or profiles, providing transparency and instilling confidence in the public.

North America is expected to hold the largest market size during the forecast period.

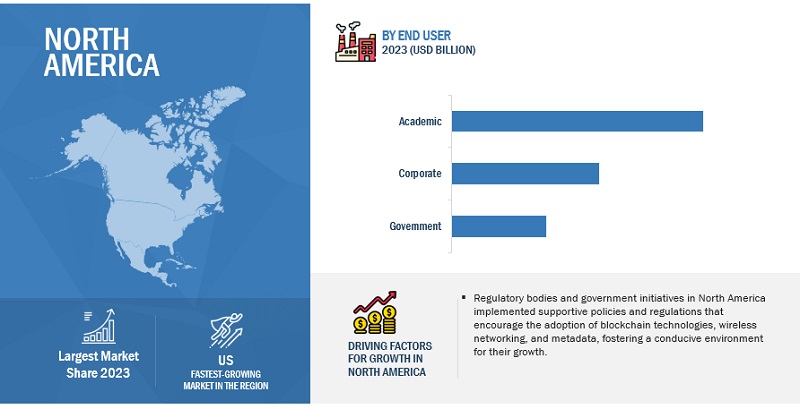
The adoption of digital badges in North America is growing rapidly. Being a fast technology adopting region, North America is expected to have the largest market share in the digital badges market. North America holds the highest degree of competitiveness, and it accounts for the presence of more than 40% of the total digital badges providers. The US and Canada are the major contributors in the North American region. The region has well established large number of prominent educational institutes with quality education provided by them. Technological advancements have led to a rise in the adoption of digital badges in educational and corporate sectors. Digital badges help entities in these setups document and verify specific skills, thereby focusing on an individual’s credentials. There are numerous factors driving this growth, including adoption of online learning, the growing recognition of the value of digital badges by employers, the development of open badge standards, and the increasing availability of digital badge platforms in the region. The US is a leading country in the region in terms of digital badge adoption. The Digital Badges market is expected to be dominated by North America, and this trend is expected to continue during the forecast period. The presence of firms that utilize the digital badge technology has also contributed to the growth of the market.
Digital Badges Market Size, and Share

Market Players:

The major players in the Digital badges market are Pearson (UK), Instructure (US), SkillSoft Corporation (US),  PeopleCert (UK), Accredible (US), Parchment (US), EbizON (India), Accreditrust Technologies (US), Badgecraft (Lithuania), Badge List (US), Bestr (Italy), Basno (US), Saarni Learning Oy (Finland), ForAllSystems (US), LearningTimes (US), Nocti Business Solutions (US), Knowledge Catalyst, Learning Vault, Hyperstack (US), TruScholar (India), CredSure.io (Germany), CertifyMe (US), Convergence.Tech (Canada), Open Badge Factory (Finland), Sertifier (US), Certopus (India), and Virtualbadge.io (Germany). These players have adopted various growth strategies, such as partnerships, agreements and collaborations, new product launches and enhancements, and acquisitions to expand their footprint in the Digital badges market.

Get online access to the report on the World's First Market Intelligence Cloud

  • Easy to Download Historical Data & Forecast Numbers
  • Company Analysis Dashboard for high growth potential opportunities
  • Research Analyst Access for customization & queries
  • Competitor Analysis with Interactive dashboard
  • Latest News, Updates & Trend analysis
Request Sample

Scope of the Report

Report Metrics

Details

Market size available for years

2017-2028

Base year considered

2022

Forecast period

2023–2028

Forecast units

Value (USD) Billion

Segments covered

Offering (Platform and Services), Type, End User, and Region

Region covered

North America, Europe, Asia Pacific, Middle East and Africa, and Latin America

Companies covered

Pearson (UK), Instructure (US), SkillSoft Corporation (US),  PeopleCert (UK), Accredible (US), Parchment (US), EbizON (India), Accreditrust Technologies (US), Badgecraft (Lithuania), Badge List (US), Bestr (Italy), Basno (US), Saarni Learning Oy (Finland), ForAllSystems (US), LearningTimes (US), Nocti Business Solutions (US), Knowledge Catalyst, Learning Vault, Hyperstack (US), TruScholar (India), CredSure.io (Germany), CertifyMe (US), Convergence.Tech (Canada), Open Badge Factory (Finland), Sertifier (US), Certopus (India), and Virtualbadge.io (Germany).

This research report categorizes the Digital badges market to forecast revenues and analyze trends in each of the following submarkets:

Based on Offering:
Based on Type:
  • Certification Badges
  • Recognition Badges
  • Participation Badges
  • Achievement Badges
  • Contribution Badges
Based on End User:
  • Academic
  • Corporate
  • Government
  • Non-profit Organizations
  • Other End Users
By Region:
  • North America
    • United States (US)
    • Canada
  • Europe
    • United Kingdom (UK)
    • Germany
    • Spain
    • Rest of Europe
  • Asia Pacific
    • China
    • Japan
    • India
    • Australia and New Zealand
    • South Korea
    • Rest of Asia Pacific
  • Middle East and Africa
    • Middle East
    • Africa
  • Latin America
    • Brazil
    • Mexico
    • Rest of Latin America

Recent Developments

  • In April 2023, Accredible partnered with Cengage Partners to offer Digital Badging and Micro-credentials and integrate it with Cengage Partners learning platform.
  • In November 2022, Credly by Pearson and NovoEd partnered Credly will integrates its services for NovoEd’s learning journey learning and development professional would issue digital badges to let learners track progress and celebrate their achievements.
  • In April 2022, Instructure acquired Concentric Sky the creator of Badgr a micro-credentialing platform, Instructure expands its offering in credential space through this acquisition.
  • In June 2021, PeopleCert acquired Axelos UK based provider of framework and certification strengthening its position in exam and certification delivery and management.

Frequently Asked Questions (FAQ):

To speak to our analyst for a discussion on the above findings, click Speak to Analyst

TABLE OF CONTENTS
 
1 INTRODUCTION (Page No. - 30)
    1.1 STUDY OBJECTIVES 
    1.2 MARKET DEFINITION 
    1.3 STUDY SCOPE 
           1.3.1 MARKET SEGMENTATION
                    FIGURE 1 DIGITAL BADGES MARKET SEGMENTATION
           1.3.2 REGIONS COVERED
           1.3.3 INCLUSIONS AND EXCLUSIONS
           1.3.4 YEARS CONSIDERED
    1.4 CURRENCY CONSIDERED 
           TABLE 1 USD EXCHANGE RATES, 2020–2022
    1.5 STAKEHOLDERS 
    1.6 RECESSION IMPACT 
    1.7 SUMMARY OF CHANGES 
 
2 RESEARCH METHODOLOGY (Page No. - 35)
    2.1 RESEARCH DATA 
           FIGURE 2 DIGITAL BADGES MARKET: RESEARCH DESIGN
           2.1.1 SECONDARY DATA
           2.1.2 PRIMARY DATA
                    2.1.2.1 Breakdown of primary profiles
                    2.1.2.2 Key industry insights
    2.2 MARKET SIZE ESTIMATION 
           FIGURE 3 APPROACHES USED FOR MARKET SIZE ESTIMATION
           FIGURE 4 APPROACH 1: SUPPLY-SIDE ANALYSIS OF REVENUE FROM PLATFORMS AND SERVICES
           2.2.1 BOTTOM-UP APPROACH
                    FIGURE 5 BOTTOM-UP APPROACH
                    FIGURE 6 APPROACH 1 (BOTTOM-UP, SUPPLY SIDE): COLLECTIVE REVENUE OF DIGITAL BADGES VENDORS
           2.2.2 TOP-DOWN APPROACH
                    FIGURE 7 TOP-DOWN APPROACH
           2.2.3 DIGITAL BADGES MARKET ESTIMATION: DEMAND-SIDE ANALYSIS
                    FIGURE 8 DEMAND-SIDE ANALYSIS
    2.3 DATA TRIANGULATION 
           FIGURE 9 DATA TRIANGULATION
    2.4 RESEARCH ASSUMPTIONS 
    2.5 LIMITATIONS 
    2.6 IMPLICATION OF RECESSION 
 
3 EXECUTIVE SUMMARY (Page No. - 44)
    FIGURE 10 DIGITAL BADGES MARKET GROWTH TREND, 2023–2028 (USD MILLION) 
    FIGURE 11 MARKET, BY REGION, 2023 
 
4 PREMIUM INSIGHTS (Page No. - 47)
    4.1 BRIEF OVERVIEW OF MARKET 
           FIGURE 12 INCREASE IN ENROLMENT IN ONLINE COURSES TO DRIVE MARKET GROWTH DURING FORECAST PERIOD
    4.2 LEADING SEGMENTS IN DIGITAL BADGES MARKET 
           FIGURE 13 LEADING SEGMENTS IN MARKET IN 2023
    4.3 MARKET, BY OFFERING 
           FIGURE 14 DIGITAL BADGE PLATFORMS TO DOMINATE OVER SERVICES MARKET IN 2023
    4.4 MARKET, BY SERVICE 
           FIGURE 15 MANAGED SERVICES TO WITNESS HIGHER GROWTH THAN PROFESSIONAL SERVICES MARKET
    4.5 MARKET, BY END USER 
           FIGURE 16 ACADEMIC END USERS TO LEAD MARKET IN 2023 AND 2028
 
5 MARKET OVERVIEW AND INDUSTRY TRENDS (Page No. - 49)
    5.1 INTRODUCTION 
    5.2 MARKET DYNAMICS 
           FIGURE 17 DIGITAL BADGES MARKET: DRIVERS, RESTRAINTS, OPPORTUNITIES, AND CHALLENGES
           5.2.1 DRIVERS
                    5.2.1.1 Growth in adoption of online education
                    5.2.1.2 Increase in focus on employees’ professional development
                    5.2.1.3 Use of blockchain for digital badges
           5.2.2 RESTRAINTS
                    5.2.2.1 Lack of IT infrastructure in emerging economies
           5.2.3 OPPORTUNITIES
                    5.2.3.1 Growth in emphasis on lifelong learning
                    5.2.3.2 Gamification of education industry
           5.2.4 CHALLENGES
                    5.2.4.1 Lack of digital badge equivalents
                    5.2.4.2 Budget constraints for educational institutions
    5.3 INDUSTRY TRENDS 
           5.3.1 OPEN BADGE INFRASTRUCTURE
                    FIGURE 18 OPEN BADGE INFRASTRUCTURE
           5.3.2 ECOSYSTEM ANALYSIS
                    FIGURE 19 DIGITAL BADGES MARKET: ECOSYSTEM
                    TABLE 2 MARKET: ECOSYSTEM
           5.3.3 CASE STUDY ANALYSIS
                    5.3.3.1 GMAC uses digital badges to increase visibility of admissions program
                    5.3.3.2 TruScholar modernizing WIRC of ICAI
                    5.3.3.3 JigsawMindz growing its visibility through digital badges
                    5.3.3.4 Hootsuite uses digital badges to recognize and reward learning
           5.3.4 VALUE CHAIN ANALYSIS
                    FIGURE 20 DIGITAL BADGES MARKET: VALUE CHAIN ANALYSIS
                    5.3.4.1 Government regulatory authorities
                    5.3.4.2 Digital badge solution providers
                    5.3.4.3 Service providers
           5.3.5 REGULATORY LANDSCAPE
                    5.3.5.1 Regulatory bodies, government agencies, and other organizations
                               TABLE 3 NORTH AMERICA: REGULATORY BODIES, GOVERNMENT AGENCIES, AND OTHER ORGANIZATIONS
                               TABLE 4 EUROPE: REGULATORY BODIES, GOVERNMENT AGENCIES, AND OTHER ORGANIZATIONS
                               TABLE 5 ASIA PACIFIC: LIST OF REGULATORY BODIES, GOVERNMENT AGENCIES, AND OTHER ORGANIZATIONS
                               TABLE 6 ROW: REGULATORY BODIES, GOVERNMENT AGENCIES, AND OTHER ORGANIZATIONS
                    5.3.5.2 North America
                               5.3.5.2.1 US
                               5.3.5.2.2 Canada
                    5.3.5.3 Europe
                    5.3.5.4 Asia Pacific
                               5.3.5.4.1 China
                               5.3.5.4.2 India
                    5.3.5.5 Middle East & Africa
                               5.3.5.5.1 UAE
                    5.3.5.6 Latin America
                               5.3.5.6.1 Brazil
           5.3.6 KEY CONFERENCES & EVENTS
                    TABLE 7 DETAILED LIST OF CONFERENCES & EVENTS, 2023–2024
           5.3.7 PRICING ANALYSIS
                    5.3.7.1 Average selling price of key players
                               TABLE 8 AVERAGE SELLING PRICE RANGES OF SUBSCRIPTION-BASED DIGITAL BADGE SERVICES
                    5.3.7.2 Average selling price trend
           5.3.8 PORTER’S FIVE FORCE MODEL
                    TABLE 9 IMPACT OF EACH PORTER’S FORCE ON DIGITAL BADGES MARKET
                    5.3.8.1 Threat from new entrants
                    5.3.8.2 Threat from substitutes
                    5.3.8.3 Bargaining power of buyers
                    5.3.8.4 Bargaining power of suppliers
                    5.3.8.5 Intensity of competitive rivalry
           5.3.9 TECHNOLOGY ANALYSIS
                    5.3.9.1 Blockchain
                    5.3.9.2 Metadata
                    5.3.9.3 Big data
           5.3.10 PATENT ANALYSIS
                    5.3.10.1 Methodology
                    5.3.10.2 Document types
                               TABLE 10 PATENTS FILED, 2021–2023
                    5.3.10.3 Innovation and patent applications
                               FIGURE 21 NUMBER OF PATENTS GRANTED ANNUALLY, 2021–2023
                               TABLE 11 PATENTS GRANTED IN DIGITAL BADGES MARKET, 2021–2023
           5.3.11 TRENDS AND DISRUPTIONS IMPACTING BUYERS/CLIENTS
 
6 DIGITAL BADGES MARKET, BY OFFERING (Page No. - 67)
    6.1 INTRODUCTION 
           FIGURE 22 DIGITAL BADGE SERVICES TO GROW AT HIGHEST CAGR DURING FORECAST PERIOD
           6.1.1 OFFERING: MARKET DRIVERS
                    TABLE 12 MARKET, BY OFFERING, 2017–2022 (USD MILLION)
                    TABLE 13 MARKET, BY OFFERING, 2023–2028 (USD MILLION)
    6.2 PLATFORMS 
           6.2.1 SHOWCASING EXPERTISE WITH DIGITAL CREDENTIALS
                    TABLE 14 PLATFORMS: MARKET, BY REGION, 2017–2022 (USD MILLION)
                    TABLE 15 PLATFORMS: MARKET, BY REGION, 2023–2028 (USD MILLION)
    6.3 SERVICES 
           TABLE 16 SERVICES: DIGITAL BADGES MARKET, BY REGION, 2017–2022 (USD MILLION)
           TABLE 17 SERVICES: MARKET, BY REGION, 2023–2028 (USD MILLION)
           TABLE 18 SERVICES: MARKET, BY TYPE, 2017–2022 (USD MILLION)
           TABLE 19 SERVICES: DIGITAL BADGES MARKET, BY TYPE, 2023–2028 (USD MILLION)
           FIGURE 23 MANAGED SERVICES SEGMENT TO GROW AT HIGHEST CAGR DURING FORECAST PERIOD
           6.3.1 PROFESSIONAL SERVICES
                    6.3.1.1 Gaining competitive edge in digital badges through professional services
                               TABLE 20 PROFESSIONAL SERVICES: MARKET, BY REGION, 2017–2022 (USD MILLION)
                               TABLE 21 PROFESSIONAL SERVICES: MARKET, BY REGION, 2023–2028 (USD MILLION)
           6.3.2 MANAGED SERVICES
                    6.3.2.1 Managing digital badges through expert guidance while saving time and cost
                               TABLE 22 MANAGED SERVICES: MARKET, BY REGION, 2017–2022 (USD MILLION)
                               TABLE 23 MANAGED SERVICES: MARKET, BY REGION, 2023–2028 (USD MILLION)
 
7 DIGITAL BADGES MARKET, BY END USER (Page No. - 75)
    7.1 INTRODUCTION 
           FIGURE 24 GOVERNMENT SEGMENT TO GROW AT HIGHER CAGR DURING FORECAST PERIOD
           7.1.1 END USER: MARKET DRIVERS
                    TABLE 24 MARKET, BY END USER, 2017–2022 (USD MILLION)
                    TABLE 25 MARKET, BY END USER, 2023–2028 (USD MILLION)
    7.2 ACADEMIC 
           7.2.1 NURTURING MOTIVATION AND PERSONALIZED LEARNING
                    TABLE 26 ACADEMIC: DIGITAL BADGES MARKET, BY REGION, 2017–2022 (USD MILLION)
                    TABLE 27 ACADEMIC: MARKET, BY REGION, 2023–2028 (USD MILLION)
                    TABLE 28 ACADEMIC: MARKET, BY TYPE, 2017–2022 (USD MILLION)
                    TABLE 29 ACADEMIC: MARKET, BY TYPE, 2023–2028 (USD MILLION)
           7.2.2 K-12
                    7.2.2.1 Ensuring future-ready school and students
                               TABLE 30 K-12: DIGITAL BADGES MARKET, BY REGION, 2017–2022 (USD MILLION)
                               TABLE 31 K-12: MARKET, BY REGION, 2023–2028 (USD MILLION)
           7.2.3 HIGHER EDUCATION
                    7.2.3.1 Complementary and supplementary credentials to traditional transcripts
                               TABLE 32 HIGHER EDUCATION: MARKET, BY REGION, 2017–2022 (USD MILLION)
                               TABLE 33 HIGHER EDUCATION: MARKET, BY REGION, 2023–2028 (USD MILLION)
    7.3 CORPORATE 
           7.3.1 TANGIBLE REWARDS TO FOSTER EMPLOYEE ENGAGEMENT
                    TABLE 34 CORPORATE: DIGITAL BADGES MARKET, BY REGION, 2017–2022 (USD MILLION)
                    TABLE 35 CORPORATE: MARKET, BY REGION, 2023–2028 (USD MILLION)
                    TABLE 36 CORPORATE: MARKET, BY TYPE, 2017–2022 (USD MILLION)
                    TABLE 37 CORPORATE: MARKET, BY TYPE, 2023–2028 (USD MILLION)
           7.3.2 SMES
                    7.3.2.1 Demand to keep track of employee competencies
                               TABLE 38 SMES: DIGITAL BADGES MARKET, BY REGION, 2017–2022 (USD MILLION)
                               TABLE 39 SMES: MARKET, BY REGION, 2023–2028 (USD MILLION)
           7.3.3 LARGE ENTERPRISES
                    7.3.3.1 Standardization by aligning badge programs with desired skill frameworks to ensure consistency in training efforts
                               TABLE 40 LARGE ENTERPRISES: MARKET, BY REGION, 2017–2022 (USD MILLION)
                               TABLE 41 LARGE ENTERPRISES: MARKET, BY REGION, 2023–2028 (USD MILLION)
    7.4 GOVERNMENT 
           7.4.1 STANDARDIZING EMPLOYEE SKILLS ACROSS ESTABLISHED FRAMEWORKS TO MEET ORGANIZATIONAL OBJECTIVES AND BUILD PUBLIC TRUST
                    TABLE 42 GOVERNMENT: MARKET, BY REGION, 2017–2022 (USD MILLION)
                    TABLE 43 GOVERNMENT: MARKET, BY REGION, 2023–2028 (USD MILLION)
    7.5 NON-PROFIT ORGANIZATIONS 
           7.5.1 DIGITAL NON-PROFIT CREDENTIALS SHOWCASING EXPERTISE IN SOCIAL GOOD
                    TABLE 44 NON-PROFIT ORGANIZATIONS: MARKET, BY REGION, 2017–2022 (USD MILLION)
                    TABLE 45 NON-PROFIT ORGANIZATIONS: MARKET, BY REGION, 2023–2028 (USD MILLION)
    7.6 OTHER END USERS 
           TABLE 46 OTHER END USERS: MARKET, BY REGION, 2017–2022 (USD MILLION)
           TABLE 47 OTHER END USERS: MARKET, BY REGION, 2023–2028 (USD MILLION)
 
8 DIGITAL BADGES MARKET, BY TYPE (Page No. - 88)
    8.1 INTRODUCTION 
           FIGURE 25 PARTICIPATION BADGE TO REGISTER HIGHER CAGR DURING FORECAST PERIOD
           8.1.1 TYPE: DIGITAL BADGES MARKET DRIVERS
                    TABLE 48 MARKET, BY TYPE, 2017–2022 (USD MILLION)
                    TABLE 49 MARKET, BY TYPE, 2023–2028 (USD MILLION)
    8.2 CERTIFICATION BADGES 
           8.2.1 RELIABLE MEANS OF EVALUATING CANDIDATES’ QUALIFICATIONS FOR EMPLOYERS
                    TABLE 50 CERTIFICATION BADGES: MARKET, BY REGION, 2017–2022 (USD MILLION)
                    TABLE 51 CERTIFICATION BADGES: MARKET, BY REGION, 2023–2028 (USD MILLION)
    8.3 RECOGNITION BADGES 
           8.3.1 ENHANCING STAKEHOLDER ENGAGEMENT
                    TABLE 52 RECOGNITION BADGES: DIGITAL BADGES MARKET, BY REGION, 2017–2022 (USD MILLION)
                    TABLE 53 RECOGNITION BADGES: MARKET, BY REGION, 2023–2028 (USD MILLION)
    8.4 PARTICIPATION BADGES 
           8.4.1 MOTIVATING PARTICIPATION AND EXPANDING NETWORKS
                    TABLE 54 PARTICIPATION BADGES: MARKET, BY REGION, 2017–2022 (USD MILLION)
                    TABLE 55 PARTICIPATION BADGES: MARKET, BY REGION, 2023–2028 (USD MILLION)
    8.5 ACHIEVEMENT BADGES 
           8.5.1 SHOWCASING ACCOMPLISHMENTS TO BUILD CREDIBILITY
                    TABLE 56 ACHIEVEMENT BADGES: MARKET, BY REGION, 2017–2022 (USD MILLION)
                    TABLE 57 ACHIEVEMENT BADGES: MARKET, BY REGION, 2023–2028 (USD MILLION)
    8.6 CONTRIBUTION BADGES 
           8.6.1 RECOGNIZING CONTRIBUTIONS THAT MADE DIFFERENCE
                    TABLE 58 CONTRIBUTION BADGES: MARKET, BY REGION, 2017–2022 (USD MILLION)
                    TABLE 59 CONTRIBUTION BADGES: MARKET, BY REGION, 2023–2028 (USD MILLION)
 
9 DIGITAL BADGES MARKET, BY REGION (Page No. - 96)
    9.1 INTRODUCTION 
           TABLE 60 MARKET, BY REGION, 2017–2022 (USD MILLION)
           TABLE 61 MARKET, BY REGION, 2023–2028 (USD MILLION)
    9.2 NORTH AMERICA 
           9.2.1 NORTH AMERICA: RECESSION IMPACT
           9.2.2 NORTH AMERICA: DIGITAL BADGES MARKET DRIVERS
                    FIGURE 26 NORTH AMERICA: MARKET SNAPSHOT
                    TABLE 62 NORTH AMERICA: DIGITAL BADGES MARKET, BY OFFERING, 2017–2022 (USD MILLION)
                    TABLE 63 NORTH AMERICA: MARKET, BY OFFERING, 2023–2028 (USD MILLION)
                    TABLE 64 NORTH AMERICA: MARKET, BY SERVICE, 2017–2022 (USD MILLION)
                    TABLE 65 NORTH AMERICA: MARKET, BY SERVICE, 2023–2028 (USD MILLION)
                    TABLE 66 NORTH AMERICA: MARKET, BY TYPE, 2017–2022 (USD MILLION)
                    TABLE 67 NORTH AMERICA: DIGITAL BADGES MARKET, BY TYPE, 2023–2028 (USD MILLION)
                    TABLE 68 NORTH AMERICA: MARKET, BY END USER, 2017–2022 (USD MILLION)
                    TABLE 69 NORTH AMERICA: MARKET, BY END USER, 2023–2028 (USD MILLION)
                    TABLE 70 NORTH AMERICA: MARKET, BY ACADEMIC END USER, 2017–2022 (USD MILLION)
                    TABLE 71 NORTH AMERICA: MARKET, BY ACADEMIC END USER, 2023–2028 (USD MILLION)
                    TABLE 72 NORTH AMERICA: MARKET, BY CORPORATE END USER, 2017–2022 (USD MILLION)
                    TABLE 73 NORTH AMERICA: MARKET, BY CORPORATE END USER, 2023–2028 (USD MILLION)
                    TABLE 74 NORTH AMERICA: MARKET, BY COUNTRY, 2017–2022 (USD MILLION)
                    TABLE 75 NORTH AMERICA: MARKET, BY COUNTRY, 2023–2028 (USD MILLION)
           9.2.3 US
                    9.2.3.1 Adopted by big tech corporations to track employee skills and competencies
                               TABLE 76 US: DIGITAL BADGES MARKET, BY OFFERING, 2017–2022 (USD MILLION)
                               TABLE 77 US: MARKET, BY OFFERING, 2023–2028 (USD MILLION)
                               TABLE 78 US: MARKET, BY SERVICE, 2017–2022 (USD MILLION)
                               TABLE 79 US: MARKET, BY SERVICE, 2023–2028 (USD MILLION)
                               TABLE 80 US: MARKET, BY TYPE, 2017–2022 (USD MILLION)
                               TABLE 81 US: MARKET, BY TYPE, 2023–2028 (USD MILLION)
                               TABLE 82 US: MARKET, BY END USER, 2017–2022 (USD MILLION)
                               TABLE 83 US: MARKET, BY END USER, 2023–2028 (USD MILLION)
           9.2.4 CANADA
                    9.2.4.1 Increase in implementation of digital badges by national professional associations
                               TABLE 84 CANADA: DIGITAL BADGES MARKET, BY OFFERING, 2017–2022 (USD MILLION)
                               TABLE 85 CANADA: MARKET, BY OFFERING, 2023–2028 (USD MILLION)
                               TABLE 86 CANADA: MARKET, BY SERVICE, 2017–2022 (USD MILLION)
                               TABLE 87 CANADA: MARKET, BY SERVICE, 2023–2028 (USD MILLION)
                               TABLE 88 CANADA: MARKET, BY TYPE, 2017–2022 (USD MILLION)
                               TABLE 89 CANADA: MARKET, BY TYPE, 2023–2028 (USD MILLION)
                               TABLE 90 CANADA: MARKET, BY END USER, 2017–2022 (USD MILLION)
                               TABLE 91 CANADA: MARKET, BY END USER, 2023–2028 (USD MILLION)
    9.3 EUROPE 
           9.3.1 EUROPE: RECESSION IMPACT
           9.3.2 EUROPE: MARKET DRIVERS
                    TABLE 92 EUROPE: DIGITAL BADGES MARKET, BY OFFERING, 2017–2022 (USD MILLION)
                    TABLE 93 EUROPE: MARKET, BY OFFERING, 2023–2028 (USD MILLION)
                    TABLE 94 EUROPE: MARKET, BY SERVICE, 2017–2022 (USD MILLION)
                    TABLE 95 EUROPE: MARKET, BY SERVICE, 2023–2028 (USD MILLION)
                    TABLE 96 EUROPE: MARKET, BY TYPE, 2017–2022 (USD MILLION)
                    TABLE 97 EUROPE: MARKET, BY TYPE, 2023–2028 (USD MILLION)
                    TABLE 98 EUROPE: MARKET, BY END USER, 2017–2022 (USD MILLION)
                    TABLE 99 EUROPE: MARKET, BY END USER, 2023–2028 (USD MILLION)
                    TABLE 100 EUROPE: MARKET, BY ACADEMIC END USER, 2017–2022 (USD MILLION)
                    TABLE 101 EUROPE: MARKET, BY ACADEMIC END USER, 2023–2028 (USD MILLION)
                    TABLE 102 EUROPE: MARKET, BY CORPORATE END USER, 2017–2022 (USD MILLION)
                    TABLE 103 EUROPE: MARKET, BY CORPORATE END USER, 2023–2028 (USD MILLION)
                    TABLE 104 EUROPE: MARKET, BY COUNTRY, 2017–2022 (USD MILLION)
                    TABLE 105 EUROPE: MARKET, BY COUNTRY, 2023–2028 (USD MILLION)
           9.3.3 UK
                    9.3.3.1 Growth in interest in education, employment, and skills development sector
                               TABLE 106 UK: DIGITAL BADGES MARKET, BY OFFERING, 2017–2022 (USD MILLION)
                               TABLE 107 UK: MARKET, BY OFFERING, 2023–2028 (USD MILLION)
                               TABLE 108 UK: MARKET, BY SERVICE, 2017–2022 (USD MILLION)
                               TABLE 109 UK: MARKET, BY SERVICE, 2023–2028 (USD MILLION)
                               TABLE 110 UK: MARKET, BY TYPE, 2017–2022 (USD MILLION)
                               TABLE 111 UK: MARKET, BY TYPE, 2023–2028 (USD MILLION)
                               TABLE 112 UK: MARKET, BY END USER, 2017–2022 (USD MILLION)
                               TABLE 113 UK: MARKET, BY END USER, 2023–2028 (USD MILLION)
           9.3.4 GERMANY
                    9.3.4.1 Increase in government initiatives
           9.3.5 SPAIN
                    9.3.5.1 Rise in popularity of digital badges in education sector
           9.3.6 REST OF EUROPE
    9.4 ASIA PACIFIC 
           9.4.1 ASIA PACIFIC: RECESSION IMPACT
           9.4.2 ASIA PACIFIC: MARKET DRIVERS
                    FIGURE 27 ASIA PACIFIC: DIGITAL BADGES MARKET SNAPSHOT
                    TABLE 114 ASIA PACIFIC: MARKET, BY OFFERING, 2017–2022 (USD MILLION)
                    TABLE 115 ASIA PACIFIC: MARKET, BY OFFERING, 2023–2028 (USD MILLION)
                    TABLE 116 ASIA PACIFIC: MARKET, BY SERVICE, 2017–2022 (USD MILLION)
                    TABLE 117 ASIA PACIFIC: MARKET, BY SERVICE, 2023–2028 (USD MILLION)
                    TABLE 118 ASIA PACIFIC: MARKET, BY TYPE, 2017–2022 (USD MILLION)
                    TABLE 119 ASIA PACIFIC: MARKET, BY TYPE, 2023–2028 (USD MILLION)
                    TABLE 120 ASIA PACIFIC: MARKET, BY END USER, 2017–2022 (USD MILLION)
                    TABLE 121 ASIA PACIFIC: MARKET, BY END USER, 2023–2028 (USD MILLION)
                    TABLE 122 ASIA PACIFIC: MARKET, BY ACADEMIC END USER, 2017–2022 (USD MILLION)
                    TABLE 123 ASIA PACIFIC: MARKET, BY ACADEMIC END USER, 2023–2028 (USD MILLION)
                    TABLE 124 ASIA PACIFIC: MARKET, BY CORPORATE END USER, 2017–2022 (USD MILLION)
                    TABLE 125 ASIA PACIFIC: MARKET, BY CORPORATE END USER, 2023–2028 (USD MILLION)
                    TABLE 126 ASIA PACIFIC: MARKET, BY COUNTRY, 2017–2022 (USD MILLION)
                    TABLE 127 ASIA PACIFIC: MARKET, BY COUNTRY, 2023–2028 (USD MILLION)
           9.4.3 CHINA
                    9.4.3.1 Rise in number of people using mobile devices
                               TABLE 128 CHINA: DIGITAL BADGES MARKET, BY OFFERING, 2017–2022 (USD MILLION)
                               TABLE 129 CHINA: MARKET, BY OFFERING, 2023–2028 (USD MILLION)
                               TABLE 130 CHINA: MARKET, BY SERVICE, 2017–2022 (USD MILLION)
                               TABLE 131 CHINA: MARKET, BY SERVICE, 2023–2028 (USD MILLION)
                               TABLE 132 CHINA: MARKET, BY TYPE, 2017–2022 (USD MILLION)
                               TABLE 133 CHINA: MARKET, BY TYPE, 2023–2028 (USD MILLION)
                               TABLE 134 CHINA: MARKET, BY END USER, 2017–2022 (USD MILLION)
                               TABLE 135 CHINA: MARKET, BY END USER, 2023–2028 (USD MILLION)
           9.4.4 JAPAN
                    9.4.4.1 Greater interest in lifelong learning and educational reforms
           9.4.5 INDIA
                    9.4.5.1 Increase in value for micro-credentials and upskilling
           9.4.6 AUSTRALIA & NEW ZEALAND
                    9.4.6.1 Rise in adoption of digital badge solutions in Australia & New Zealand
           9.4.7 SOUTH KOREA
                    9.4.7.1 Well-developed eLearning infrastructure
           9.4.8 REST OF ASIA PACIFIC
    9.5 MIDDLE EAST & AFRICA 
           9.5.1 MIDDLE EAST & AFRICA: RECESSION IMPACT
           9.5.2 MIDDLE EAST & AFRICA: MARKET DRIVERS
                    TABLE 136 MIDDLE EAST & AFRICA: DIGITAL BADGES MARKET, BY OFFERING, 2017–2022 (USD MILLION)
                    TABLE 137 MIDDLE EAST & AFRICA: MARKET, BY OFFERING, 2023–2028 (USD MILLION)
                    TABLE 138 MIDDLE EAST & AFRICA: MARKET, BY SERVICE, 2017–2022 (USD MILLION)
                    TABLE 139 MIDDLE EAST & AFRICA: MARKET, BY SERVICE, 2023–2028 (USD MILLION)
                    TABLE 140 MIDDLE EAST & AFRICA: MARKET, BY TYPE, 2017–2022 (USD MILLION)
                    TABLE 141 MIDDLE EAST & AFRICA: MARKET, BY TYPE, 2023–2028 (USD MILLION)
                    TABLE 142 MIDDLE EAST & AFRICA: MARKET, BY END USER, 2017–2022 (USD MILLION)
                    TABLE 143 MIDDLE EAST & AFRICA: MARKET, BY END USER, 2023–2028 (USD MILLION)
                    TABLE 144 MIDDLE EAST & AFRICA: MARKET, BY ACADEMIC END USER, 2017–2022 (USD MILLION)
                    TABLE 145 MIDDLE EAST & AFRICA: MARKET, BY ACADEMIC END USER, 2023–2028 (USD MILLION)
                    TABLE 146 MIDDLE EAST & AFRICA: MARKET, BY CORPORATE END USER, 2017–2022 (USD MILLION)
                    TABLE 147 MIDDLE EAST & AFRICA: MARKET, BY CORPORATE END USER, 2023–2028 (USD MILLION)
                    TABLE 148 MIDDLE EAST & AFRICA: MARKET, BY REGION, 2017–2022 (USD MILLION)
                    TABLE 149 MIDDLE EAST & AFRICA: MARKET, BY REGION, 2023–2028 (USD MILLION)
           9.5.3 MIDDLE EAST
                    9.5.3.1 Increase in popularity of online training and government initiatives
                               TABLE 150 MIDDLE EAST: DIGITAL BADGES MARKET, BY OFFERING, 2017–2022 (USD MILLION)
                               TABLE 151 MIDDLE EAST: MARKET, BY OFFERING, 2023–2028 (USD MILLION)
                               TABLE 152 MIDDLE EAST: MARKET, BY SERVICE, 2017–2022 (USD MILLION)
                               TABLE 153 MIDDLE EAST: MARKET, BY SERVICE, 2023–2028 (USD MILLION)
                               TABLE 154 MIDDLE EAST: MARKET, BY TYPE, 2017–2022 (USD MILLION)
                               TABLE 155 MIDDLE EAST: MARKET, BY TYPE, 2023–2028 (USD MILLION)
                               TABLE 156 MIDDLE EAST: MARKET, BY END USER, 2017–2022 (USD MILLION)
                               TABLE 157 MIDDLE EAST: MARKET, BY END USER, 2023–2028 (USD MILLION)
           9.5.4 AFRICA
                    9.5.4.1 NGO initiatives and pilot badge programs
    9.6 LATIN AMERICA 
           9.6.1 LATIN AMERICA: RECESSION IMPACT
           9.6.2 LATIN AMERICA: MARKET DRIVERS
                    TABLE 158 LATIN AMERICA: DIGITAL BADGES MARKET, BY OFFERING, 2017–2022 (USD MILLION)
                    TABLE 159 LATIN AMERICA: MARKET, BY OFFERING, 2023–2028 (USD MILLION)
                    TABLE 160 LATIN AMERICA: MARKET, BY SERVICE, 2017–2022 (USD MILLION)
                    TABLE 161 LATIN AMERICA: MARKET, BY SERVICE, 2023–2028 (USD MILLION)
                    TABLE 162 LATIN AMERICA: MARKET, BY TYPE, 2017–2022 (USD MILLION)
                    TABLE 163 LATIN AMERICA: MARKET, BY TYPE, 2023–2028 (USD MILLION)
                    TABLE 164 LATIN AMERICA: MARKET, BY END USER, 2017–2022 (USD MILLION)
                    TABLE 165 LATIN AMERICA: MARKET, BY END USER, 2023–2028 (USD MILLION)
                    TABLE 166 LATIN AMERICA: MARKET, BY ACADEMIC END USER, 2017–2022 (USD MILLION)
                    TABLE 167 LATIN AMERICA: MARKET, BY ACADEMIC END USER, 2023–2028 (USD MILLION)
                    TABLE 168 LATIN AMERICA: MARKET, BY CORPORATE END USER, 2017–2022 (USD MILLION)
                    TABLE 169 LATIN AMERICA: MARKET, BY CORPORATE END USER, 2023–2028 (USD MILLION)
                    TABLE 170 LATIN AMERICA: MARKET, BY COUNTRY, 2017–2022 (USD MILLION)
                    TABLE 171 LATIN AMERICA: MARKET, BY COUNTRY, 2023–2028 (USD MILLION)
           9.6.3 BRAZIL
                    9.6.3.1 Rise in digital badges projects and initiatives
                               TABLE 172 BRAZIL: DIGITAL BADGES MARKET, BY OFFERING, 2017–2022 (USD MILLION)
                               TABLE 173 BRAZIL: MARKET, BY OFFERING, 2023–2028 (USD MILLION)
                               TABLE 174 BRAZIL: MARKET, BY SERVICE, 2017–2022 (USD MILLION)
                               TABLE 175 BRAZIL: MARKET, BY SERVICE, 2023–2028 (USD MILLION)
                               TABLE 176 BRAZIL: MARKET, BY TYPE, 2017–2022 (USD MILLION)
                               TABLE 177 BRAZIL: MARKET, BY TYPE, 2023–2028 (USD MILLION)
                               TABLE 178 BRAZIL: MARKET, BY END USER, 2017–2022 (USD MILLION)
                               TABLE 179 BRAZIL: MARKET, BY END USER, 2023–2028 (USD MILLION)
           9.6.4 MEXICO
                    9.6.4.1 Potential for learning and development through NGO initiatives
           9.6.5 REST OF LATIN AMERICA
 
10 COMPETITIVE LANDSCAPE (Page No. - 141)
     10.1 INTRODUCTION 
     10.2 STRATEGIES ADOPTED BY KEY PLAYERS 
               TABLE 180 OVERVIEW OF STRATEGIES ADOPTED BY KEY PLAYERS
     10.3 HISTORICAL REVENUE ANALYSIS 
               FIGURE 28 HISTORICAL REVENUE ANALYSIS OF KEY PLAYERS, 2020–2022 (USD MILLION)
     10.4 MARKET SHARE ANALYSIS OF KEY PLAYERS 
               TABLE 181 DIGITAL BADGES MARKET: DEGREE OF COMPETITION
     10.5 COMPETITIVE BENCHMARKING 
               TABLE 182 COMPETITIVE BENCHMARKING OF KEY PLAYERS
     10.6 COMPANY EVALUATION MATRIX 
             10.6.1 COMPANY EVALUATION MATRIX METHODOLOGY
                       FIGURE 29 EVALUATION QUADRANT MATRIX FOR KEY PLAYERS: CRITERIA WEIGHTAGE
             10.6.2 STARS
             10.6.3 EMERGING LEADERS
             10.6.4 PERVASIVE PLAYERS
             10.6.5 PARTICIPANTS
                       FIGURE 30 EVALUATION QUADRANT MATRIX FOR KEY PLAYERS, 2023
     10.7 COMPETITIVE SCENARIO 
             10.7.1 DEALS
                       TABLE 183 DEALS, 2020–2023
 
11 COMPANY PROFILES (Page No. - 149)
(Business overview, Products/Solutions/Services offered, Recent Developments, MNM view)*
     11.1 PEARSON 
               TABLE 184 PEARSON: BUSINESS OVERVIEW
               FIGURE 31 PEARSON: COMPANY SNAPSHOT
               TABLE 185 PEARSON: PRODUCTS/SOLUTIONS/SERVICES OFFERED
               TABLE 186 PEARSON: DEALS
     11.2 INSTRUCTURE 
               TABLE 187 INSTRCUTURE: BUSINESS OVERVIEW
               TABLE 188 INSTRCUTURE: PRODUCTS/SOLUTIONS/SERVICES OFFERED
               TABLE 189 INSTRUCTURE: DEALS
     11.3 SKILLSOFT 
               TABLE 190 SKILLSOFT: BUSINESS OVERVIEW
               FIGURE 32 SKILLSOFT: COMPANY SNAPSHOT
               TABLE 191 SKILLSOFT: PRODUCTS/SOLUTIONS/SERVICES OFFERED
     11.4 PEOPLECERT 
               TABLE 192 PEOPLECERT: BUSINESS OVERVIEW
               FIGURE 33 PEOPLECERT: COMPANY SNAPSHOT
               TABLE 193 PEOPLECERT: PRODUCTS/SOLUTIONS/SERVICES OFFERED
               TABLE 194 PEOPLECERT: DEALS
     11.5 ACCREDIBLE 
               TABLE 195 ACCREDIBLE: BUSINESS OVERVIEW
               TABLE 196 ACCREDIBLE: PRODUCTS/SOLUTIONS/SERVICES OFFERED
               TABLE 197 ACCREDIBLE: DEALS
     11.6 PARCHMENT 
               TABLE 198 PARCHMENT: BUSINESS OVERVIEW
               TABLE 199 PARCHMENT: PRODUCTS/SOLUTIONS/SERVICES OFFERED
               TABLE 200 PARCHMENT: DEALS
     11.7 EBIZON 
               TABLE 201 EBIZON: BUSINESS OVERVIEW
               TABLE 202 EBIZON: PRODUCTS/SOLUTIONS/SERVICES OFFERED
     11.8 ACCREDITRUST TECHNOLOGIES 
     11.9 BADGE LIST 
     11.1 BADGECRAFT 
     11.11 BESTR 
     11.12 BASNO 
     11.13 SAARNI LEARNING OY 
     11.14 FORALL SYSTEMS 
     11.15 LEARNINGTIMES 
     11.16 NOCTI BUSINESS SOLUTIONS 
     11.17 KNOWLEDGE CATALYST 
     11.18 LEARNING VAULT 
     11.19 HYPERSTACK 
     11.2 TRUSCHOLAR 
     11.21 CERTIFYME 
     11.22 CONVERGENCE.TECH 
     11.23 OPEN BADGE FACTORY 
     11.24 SERTIFIER 
     11.25 CREDSURE 
     11.26 VIRTUALBADGE.IO 
     11.27 CERTOPUS 
*Details on Business overview, Products/Solutions/Services offered, Recent Developments, MNM view might not be captured in case of unlisted companies.
 
12 ADJACENT/RELATED MARKETS (Page No. - 175)
     12.1 INTRODUCTION 
     12.2 LEARNING MANAGEMENT SYSTEM MARKET 
             12.2.1 MARKET DEFINITION
             12.2.2 MARKET OVERVIEW
             12.2.3 LEARNING MANAGEMENT SYSTEM MARKET, BY COMPONENT
                       TABLE 203 LEARNING MANAGEMENT SYSTEM MARKET, BY COMPONENT, 2017–2021 (USD MILLION)
                       TABLE 204 LEARNING MANAGEMENT SYSTEM MARKET, BY COMPONENT, 2022–2027 (USD MILLION)
             12.2.4 LEARNING MANAGEMENT SYSTEM MARKET, BY DELIVERY MODE
                       TABLE 205 LEARNING MANAGEMENT SYSTEM MARKET, BY DELIVERY MODE, 2017–2021 (USD MILLION)
                       TABLE 206 LEARNING MANAGEMENT SYSTEM MARKET, BY DELIVERY MODE, 2022–2027 (USD MILLION)
             12.2.5 LEARNING MANAGEMENT SYSTEM MARKET, BY USER TYPE
                       TABLE 207 LEARNING MANAGEMENT SYSTEM MARKET, BY USER TYPE, 2017–2021 (USD MILLION)
                       TABLE 208 LEARNING MANAGEMENT SYSTEM MARKET, BY USER TYPE, 2022–2027 (USD MILLION)
             12.2.6 LEARNING MANAGEMENT SYSTEM MARKET, BY DEPLOYMENT TYPE
                       TABLE 209 LEARNING MANAGEMENT SYSTEM MARKET, BY DEPLOYMENT TYPE, 2017–2021 (USD MILLION)
                       TABLE 210 LEARNING MANAGEMENT SYSTEM MARKET, BY DEPLOYMENT TYPE, 2022–2027 (USD MILLION)
             12.2.7 LEARNING MANAGEMENT SYSTEM MARKET, BY REGION
                       TABLE 211 LEARNING MANAGEMENT SYSTEM MARKET, BY REGION, 2017–2021 (USD MILLION)
                       TABLE 212 LEARNING MANAGEMENT SYSTEM MARKET, BY REGION, 2022–2027 (USD MILLION)
     12.3 SMART LEARNING MARKET 
             12.3.1 MARKET DEFINITION
             12.3.2 MARKET OVERVIEW
             12.3.3 SMART LEARNING MARKET, BY COMPONENT
                       TABLE 213 SMART LEARNING MARKET, BY COMPONENT, 2017–2020 (USD MILLION)
                       TABLE 214 SMART LEARNING MARKET, BY COMPONENT, 2021–2026 (USD MILLION)
                       TABLE 215 SMART LEARNING MARKET, BY HARDWARE, 2017–2020 (USD MILLION)
                       TABLE 216 SMART LEARNING MARKET, BY HARDWARE, 2021–2026 (USD MILLION)
                       TABLE 217 SMART LEARNING MARKET, BY SOFTWARE, 2017–2020 (USD MILLION)
                       TABLE 218 SMART LEARNING MARKET, BY SOFTWARE, 2021–2026 (USD MILLION)
             12.3.4 SMART LEARNING MARKET, BY SERVICE
                       TABLE 219 SMART LEARNING MARKET, BY SERVICE, 2017–2020 (USD MILLION)
                       TABLE 220 SMART LEARNING MARKET, BY SERVICE, 2021–2026 (USD MILLION)
             12.3.5 SMART LEARNING MARKET, BY LEARNING TYPE
                       TABLE 221 SMART LEARNING MARKET, BY LEARNING TYPE, 2017–2020 (USD MILLION)
                       TABLE 222 SMART LEARNING MARKET, BY LEARNING TYPE, 2021–2026 (USD MILLION)
             12.3.6 SMART LEARNING MARKET, BY END USER
                       TABLE 223 SMART LEARNING MARKET, BY END USER, 2017–2020 (USD MILLION)
                       TABLE 224 SMART LEARNING MARKET, BY END USER, 2021–2026 (USD MILLION)
             12.3.7 SMART LEARNING MARKET, BY REGION
                       TABLE 225 SMART LEARNING MARKET, BY REGION, 2017–2020 (USD MILLION)
                       TABLE 226 SMART LEARNING MARKET, BY REGION, 2021–2026 (USD MILLION)
 
13 APPENDIX (Page No. - 186)
     13.1 DISCUSSION GUIDE 
     13.2 KNOWLEDGESTORE: MARKETSANDMARKETS’ SUBSCRIPTION PORTAL 
     13.3 CUSTOMIZATION OPTIONS 
     13.4 RELATED REPORTS 
     13.5 AUTHOR DETAILS 

The digital badge market is an attractive market for the providers of digital badge platforms and services, as corporates and academic institutions across the world are bringing gamification into their learning content. Moreover, the rapid increase in the enrolment of online courses and MOOCs provides growth opportunities for the digital badge market worldwide.

Secondary Research

In the secondary research process, various secondary sources were referred to for identifying and collecting information for the study. The secondary sources included annual reports, press releases, investor presentations of companies, white papers, certified publications, and articles from recognized associations and government publishing sources. Several journals, such as the Institute of Electrical and Electronics Engineers (IEEE), ScienceDirect, ResearchGate, Academic Journals, Scientific.Net, and various telecom and Digital badges associations/forums, Wi-Fi Alliance, and 3GPP were also referred. Secondary research was used to obtain key information about industry insights, the market’s monetary chain, the overall pool of key players, market classification, and in-depth segmentation according to industry trends, regional markets, and key developments.

Primary Research

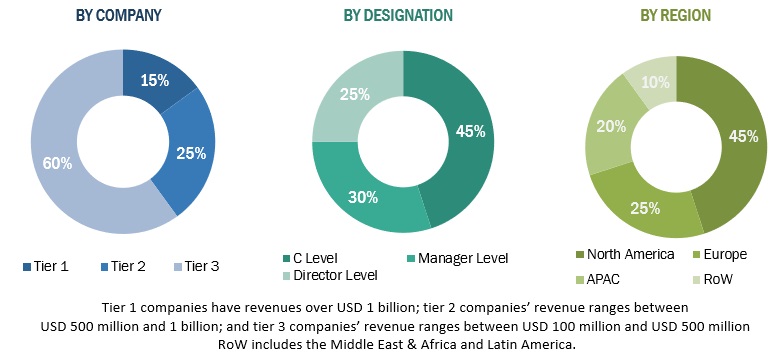
In the primary research process, various primary sources from both supply and demand sides were interviewed to obtain qualitative and quantitative information for the report. The primary sources from the supply side included industry experts, such as Chief Executive Officers (CEOs), Chief Technology Officers (CTOs), Chief Operating Officers (COOs), Vice Presidents (VPs), marketing directors, technology and innovation directors, and related key executives from various key companies and organizations operating in the Digital badges market. The primary sources from the demand side included Digital badges end users, network administrators/consultants/specialists, Chief Information Officers (CIOs), and subject-matter experts from enterprises and government associations.

After the complete market engineering process (including calculations for market statistics, market breakdown, market size estimations, market forecast, and data triangulation), extensive primary research was conducted to gather information and verify and validate the critical numbers arrived at. Primary research was also conducted to identify and validate the segmentation types; industry trends; key players; the competitive landscape of the market; and key market dynamics, such as drivers, restraints, opportunities, challenges, industry trends, and key strategies.

In the complete market engineering process, both top-down and bottom-up approaches and several data triangulation methods were used to perform the market estimation and forecast for the overall market segments and subsegments listed in this report. Extensive qualitative and quantitative analysis was performed on the complete market engineering process to list the key information/insights throughout the report.

The breakup of Primary Research:
Digital Badges Market Size, and Share

To know about the assumptions considered for the study, download the pdf brochure

Market Size Estimation

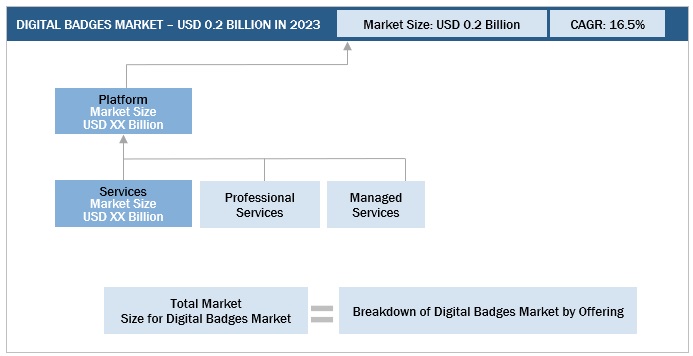
Multiple approaches were adopted to estimate and forecast the size of the digital badges market. The first approach involves estimating market size by summing up the revenue generated by companies through the sale of digital badges offerings, such as platform and services.

Both top-down and bottom-up approaches were used to estimate and validate the total size of the Digital badges market. These methods were extensively used to estimate the size of various segments in the market. The research methodology used to estimate the market size includes the following:

  • Key players in the market have been identified through extensive secondary research.
  • In terms of value, the industry’s supply chain and market size have been determined through primary and secondary research processes.
  • All percentage shares, splits, and breakups have been determined using secondary sources and verified through primary sources.

Digital badges Market Size: Bottom-Up Approach
Digital Badges Market Size, and Share

To know about the assumptions considered for the study, Request for Free Sample Report

Digital badges Market Size: Top-Down Approach

Digital Badges Market Size, and Share

Data Triangulation

After arriving at the overall market size, the Digital badges market was divided into several segments and subsegments. A data triangulation procedure was used to complete the overall market engineering process and arrive at the exact statistics for all segments and subsegments, wherever applicable. The data was triangulated by studying various factors and trends from the demand and supply sides. Along with data triangulation and market breakdown, the market size was validated by the top-down and bottom-up approaches.

Market Definition

Digital badges market can be defined as a set of platforms and services that are used to issue badges to the learners. A digital badge is a type of digital credential that represents the accomplishments of certain skills. It includes online images offered by issuers and displayed by professionals and learners to showcase their expertise in a certain subject, skill, or task.

According to Sertifier, digital badges are digital representations of skills, accomplishments, or competencies that an individual has acquired. They are designed to be easily shared and verified, and often include metadata that provides information about the issuer, recipient, and criteria for earning the badge. Digital badges are a visual way to recognize and validate an individual’s accomplishments, skills, or knowledge in a particular area.

Key Stakeholders

  • Digital badge platform providers
  • IT service providers
  • Badge issuers
  • Digital badge displayers
  • Digital badge designers
  • Cloud service providers
  • Consultants/consultancies/advisory firms
  • Training and education service providers

Report Objectives

  • To determine and forecast the global digital badges market by offering, end-user, and region from 2017 to 2023 and analyze various macroeconomic and microeconomic factors that affect the market growth
  • To forecast the size of the market segments with respect to 4 main regions, namely, North America, Europe, Asia Pacific, Middle east and Africa, and Latin America
  • To analyze each submarket with respect to individual growth trends, prospects, and contributions to the overall market
  • To provide detailed information regarding the major factors influencing the growth of the market (drivers, restraints, opportunities, and challenges)
  • To profile the key market players; provide comparative analysis on the basis of business overviews, regional presence, product offerings, business strategies, and key financials; and illustrate the competitive landscape of the market
  • To track and analyze competitive developments, such as mergers and acquisitions, product developments, partnerships and collaborations, and Research and Development (R&D) activities in the digital badges market
  • Track and analyze competitive developments in the market, such as mergers and acquisitions, product developments, partnerships and collaborations, and Research and Development (R&D) activities.

Available Customizations

With the given market data, MarketsandMarkets offers customizations as per the company’s specific needs. The following customization options are available for the report:

Geographic Analysis

  • Further breakup of the Asia Pacific market into countries contributing 75% to the regional market size
  • Further breakup of the North American market into countries contributing 75% to the regional market size
  • Further breakup of the Latin American market into countries contributing 75% to the regional market size
  • Further breakup of the Middle East and Africa market into countries contributing 75% to the regional market size
  • Further breakup of the European market into countries contributing 75% to the regional market size

Company Information

  • Detailed analysis and profiling of additional market players (up to 5)
Custom Market Research Services

We will customize the research for you, in case the report listed above does not meet with your exact requirements. Our custom research will comprehensively cover the business information you require to help you arrive at strategic and profitable business decisions.

Request Customization
Report Code
TC 6508
Published ON
Jul, 2023
Choose License Type
BUY NOW
  • SHARE
X
Request Customization
Speak to Analyst
Speak to Analyst
OR FACE-TO-FACE MEETING
PERSONALIZE THIS RESEARCH
  • Triangulate with your Own Data
  • Get Data as per your Format and Definition
  • Gain a Deeper Dive on a Specific Application, Geography, Customer or Competitor
  • Any level of Personalization
REQUEST A FREE CUSTOMIZATION
LET US HELP YOU!
  • What are the Known and Unknown Adjacencies Impacting the Digital Badges Market
  • What will your New Revenue Sources be?
  • Who will be your Top Customer; what will make them switch?
  • Defend your Market Share or Win Competitors
  • Get a Scorecard for Target Partners
CUSTOMIZED WORKSHOP REQUEST
+1-888-600-6441
  • Call Us
  • +1-888-600-6441 (Corporate office hours)
  • +1-888-600-6441 (US/Can toll free)
  • +44-800-368-9399 (UK office hours)
CONNECT WITH US
ABOUT TRUST ONLINE
©2024 MarketsandMarkets Research Private Ltd. All rights reserved
DMCA.com Protection Status Website Feedback