DIY Home Automation Market by Offerings (Hardware and Managed Services), by Technology, and by Geography (The Americas, Europe, APAC, and RoW) - Global Forecast to 2025


DIY Home Automation Market Summary
The DIY Home Automation Market is gaining strong momentum as consumers increasingly adopt connected devices that can be installed, configured, and managed without professional assistance. The market is estimated at US$ 18.0 Billion - US$ 22.0 Billion in 2025 and is projected to reach US$ 55.0 Billion - US$ 68.0 Billion by 2035 at a CAGR of 11.5% - 12.5% from 2025 to 2035. Rising consumer interest in smart homes, declining connected-device costs, improved wireless connectivity, energy-efficiency requirements, home security concerns, and the growing availability of user-friendly platforms are driving market expansion. AI-powered assistants, IoT ecosystems, edge computing, Matter-enabled interoperability, and automated energy management are further transforming DIY home automation from simple remote control into intelligent, context-aware home management.
Key Market Trends & Insights
North America is expected to remain the leading regional market, supported by high smart-home penetration, strong consumer purchasing power, widespread broadband connectivity, and early adoption of connected security, lighting, thermostats, and entertainment products.
Asia Pacific is projected to be the fastest-growing region, driven by expanding urbanization, smartphone adoption, affordable smart devices, improving connectivity, and increasing interest in energy-efficient residential technologies.
Smart security products represent a dominant product segment, with DIY consumers increasingly installing smart cameras, video doorbells, smart locks, motion sensors, and connected alarms without requiring professional installers.
The market is moving toward interoperable ecosystems. Matter and other standardized connectivity approaches are helping consumers connect devices from different manufacturers, reducing compatibility barriers that historically limited DIY adoption.
AI is becoming a major differentiator. AI-enabled cameras can identify people, vehicles, packages, and unusual activity, while intelligent assistants can learn routines and automate lighting, climate control, entertainment, and security functions.
Energy management is another emerging opportunity. Smart plugs, thermostats, energy monitors, connected appliances, and automated lighting systems can help households understand and reduce electricity consumption.
Market Size & Forecast
-
Base year market size: US$ 18.0 Billion - US$ 22.0 Billion in 2025
-
Forecast market value: US$ 55.0 Billion - US$ 68.0 Billion by 2035
-
CAGR: 11.5% - 12.5% from 2025 to 2035
-
Growth factors: Increasing smart-home adoption, affordable IoT devices, AI-powered automation, energy-efficiency requirements, home security demand, wireless connectivity, voice assistants, and interoperable platforms will support market growth.
The DIY model is particularly attractive because consumers can begin with a single device and gradually expand their smart-home ecosystem. This modular purchasing behavior reduces the upfront investment associated with comprehensive professionally installed systems and creates recurring opportunities for manufacturers.
AI-Powered Military Transformation: The Future of Smart Combat and Defense Top 10 Key Takeaway
-
The DIY Home Automation Market is projected to grow from US$ 18.0 Billion - US$ 22.0 Billion in 2025 to US$ 55.0 Billion - US$ 68.0 Billion by 2035.
-
The market is expected to expand at a 11.5% - 12.5% CAGR from 2025 to 2035.
-
North America is expected to remain the leading regional market.
-
Asia Pacific is projected to record the fastest growth.
-
Smart security is one of the strongest DIY home automation product categories.
-
AI is improving camera intelligence, voice control, personalization, and predictive automation.
-
Matter and interoperability standards are reducing ecosystem compatibility barriers.
-
Energy management is emerging as an important household automation application.
-
Smartphone apps and wireless technologies are simplifying installation and device management.
-
Lower device costs and modular purchasing models will accelerate mainstream DIY adoption.
Product Insights
Smart security products are expected to represent a leading segment of the DIY Home Automation Market. Smart cameras, video doorbells, smart locks, motion sensors, alarm systems, and window or door sensors provide clear consumer value by improving visibility and control over residential security. Wireless installation makes these products particularly suitable for DIY users who want to avoid extensive wiring or professional installation fees.
Smart lighting is another important category. Connected bulbs, switches, dimmers, LED strips, and occupancy sensors allow consumers to automate lighting schedules, control brightness, and manage devices through smartphones or voice assistants. As LED lighting becomes increasingly energy efficient, smart controls can provide additional opportunities for reducing electricity consumption.
Smart thermostats and climate-control devices are also gaining traction because they combine comfort with energy management. These products can adjust temperature according to schedules, occupancy, weather conditions, and user preferences.
Emerging categories include smart blinds, connected appliances, robotic cleaning devices, smart irrigation systems, home energy-management devices, water-leak sensors, air-quality monitors, and connected entertainment systems.
AI is changing the product landscape by allowing devices to move beyond simple commands. AI-enabled cameras can distinguish meaningful events from routine movement, while intelligent home systems can learn household behavior and recommend or execute automations. This shift from connected devices to context-aware devices is expected to strengthen consumer engagement.
Technology / Component Insights
The technology foundation of DIY home automation includes IoT connectivity, Wi-Fi, Bluetooth, Zigbee, Z-Wave, Thread, Matter, cloud platforms, edge computing, sensors, mobile applications, voice interfaces, and AI software.
Wireless communication is essential because DIY consumers typically prefer products that can be installed without complex wiring. Wi-Fi remains widely used for cameras, appliances, and high-bandwidth devices, while lower-power technologies such as Thread, Zigbee, and Bluetooth support sensors and smaller connected devices.
The growing adoption of Matter is strategically important because interoperability has historically been a challenge in smart-home ecosystems. Standardized communication can make it easier for consumers to combine products from different manufacturers and control them through compatible platforms.
AI and machine learning are becoming increasingly important at both the device and platform levels. AI can analyze camera feeds, detect unusual behavior, optimize energy use, understand voice commands, and personalize automation routines.
Edge computing can process selected information locally, reducing latency and potentially improving privacy. Cloud platforms remain important for remote access, data synchronization, software updates, and advanced analytics.
IoT sensors provide the data required for automation. Temperature, humidity, motion, occupancy, light, air quality, and energy sensors allow smart-home systems to respond to real-world conditions.
Future innovations are expected to include AI agents for home management, predictive energy optimization, privacy-focused edge AI, ambient sensing, advanced voice interfaces, automated device discovery, and deeper integration between smart homes and distributed energy resources.
Application Insights
Home security and surveillance represents a major application segment because consumers increasingly want continuous visibility and remote control over their properties. Smart cameras and doorbells can send alerts to smartphones, while AI-based systems can identify relevant events and reduce unnecessary notifications.
Energy and climate management is another rapidly developing application. Smart thermostats, connected HVAC equipment, smart plugs, energy monitors, and automated lighting can help households reduce energy consumption while maintaining comfort.
Lighting and entertainment automation remain highly accessible entry points into DIY smart homes. Consumers can start with a few connected bulbs or smart speakers and subsequently add switches, sensors, televisions, speakers, and other devices.
Healthcare and aging-in-place applications represent longer-term opportunities. Connected sensors can potentially monitor environmental conditions, movement patterns, medication reminders, and emergency events while enabling family members to receive alerts.
The future opportunity lies in integrated automation rather than isolated products. A smart-home system could, for example, detect that occupants have left the property, automatically adjust the thermostat, switch off selected lights, lock doors, activate security monitoring, and optimize energy consumption.
Regional Insights
North America is expected to maintain its leadership because of mature smart-home adoption, high internet penetration, strong consumer awareness, established technology ecosystems, and widespread availability of DIY products. The US represents a particularly important market for smart security, connected lighting, voice assistants, smart thermostats, and home entertainment.
Europe is supported by energy-efficiency objectives, smart-building development, consumer interest in sustainability, and increasing adoption of connected security and energy-management technologies. Rising energy costs have also increased interest in smart thermostats, connected appliances, and energy monitoring.
Asia Pacific is projected to be the fastest-growing region through 2035. China, Japan, South Korea, India, and Southeast Asian economies are experiencing rapid urbanization, expanding digital infrastructure, increasing smartphone usage, and growing consumer interest in connected living.
-
North America remains the largest and most mature DIY smart-home market.
-
Europe is benefiting from energy-efficiency and sustainability priorities.
-
Asia Pacific is projected to achieve the fastest growth.
-
Smart security and energy management are important regional opportunities.
-
Affordable connected devices are supporting adoption in emerging economies.
Country Specific Market Trends
Within Asia Pacific, China is projected to grow at approximately 14.0% - 15.5% CAGR, supported by smart-device manufacturing, urbanization, connected appliance adoption, 5G connectivity, and expanding smart-home ecosystems. Japan is expected to grow at approximately 10.5% - 12.0% CAGR, supported by aging-in-place technologies, robotics, energy efficiency, smart appliances, and advanced residential automation.
In North America, the United States is projected to expand at approximately 11.0% - 12.0% CAGR, supported by established smart-home ecosystems, high adoption of connected security products, voice assistants, smart thermostats, and consumer electronics. Canada could register approximately 10.0% - 11.5% CAGR, driven by connected security, energy management, smart appliances, and residential digitalization. Mexico is expected to achieve approximately 12.0% - 13.5% CAGR, supported by increasing smartphone penetration, affordable connected devices, urban housing development, and growing consumer awareness.
In Europe, Germany is projected to grow at approximately 10.0% - 11.5% CAGR, supported by energy management, smart-building initiatives, connected security, and automation. France is expected to expand at approximately 10.0% - 11.0% CAGR, supported by smart lighting, security, energy efficiency, and digital residential infrastructure.
-
China is expected to be a major Asia Pacific growth engine.
-
Japan has strong opportunities in aging-in-place and smart appliances.
-
The US remains the largest mature DIY home automation market.
-
Mexico offers high growth potential as affordable smart devices become widespread.
-
Germany and France are benefiting from residential energy-management trends.
Key Company Insights
The competitive landscape includes major technology and smart-home companies such as Google, Amazon, Apple, Samsung, Xiaomi, Schneider Electric, Resideo Technologies, ADT, Signify, and Bosch. Companies are competing through device ecosystems, AI capabilities, interoperability, security features, application platforms, and integration with voice assistants.
Google and Amazon continue to emphasize AI-enabled assistants and connected-device ecosystems, while Apple focuses strongly on privacy, ecosystem integration, and seamless device control. Samsung and Xiaomi are expanding smart-home ecosystems across appliances, smartphones, displays, sensors, and connected consumer electronics.
Companies such as Schneider Electric and Resideo are emphasizing energy management, climate control, electrical systems, and connected residential infrastructure. Signify is strengthening the connected-lighting ecosystem, while Bosch is integrating smart-home capabilities with appliances, security, and building technologies.
AI adoption is increasingly becoming a competitive requirement. Manufacturers are integrating intelligent image recognition, predictive automation, natural-language interfaces, personalized routines, and energy optimization into their platforms.
-
Companies are building broader interoperable device ecosystems.
-
AI is becoming a key differentiator in smart-home platforms.
-
Energy management is gaining strategic importance.
-
Privacy and cybersecurity are becoming important purchasing factors.
-
Device simplicity and DIY installation remain central competitive advantages.
Recent Developments
The market is seeing continued expansion of Matter-compatible smart-home products, allowing consumers to combine devices from different manufacturers and reduce ecosystem fragmentation. This development is particularly important for DIY consumers who may purchase products over several years.
AI-powered smart cameras and security systems are also advancing rapidly, with improved capabilities for person detection, package recognition, activity classification, and intelligent alerts. These features can reduce notification overload while providing more useful security information.
Another important trend is the integration of smart-home automation with energy-management systems. Connected thermostats, solar systems, batteries, smart plugs, and appliances can increasingly work together to optimize household electricity consumption.
Market Segmentation
The DIY Home Automation Market can be segmented by product, technology/component, application, and region. By product, the market includes smart security systems, smart lighting, smart thermostats, smart speakers, smart locks, smart cameras, smart appliances, smart plugs, sensors, smart entertainment systems, and energy-management devices. Smart security and connected lighting represent major entry points for consumers.
By technology/component, the market includes Wi-Fi, Bluetooth, Zigbee, Z-Wave, Thread, Matter, cellular connectivity, sensors, cloud platforms, edge computing, AI software, voice assistants, mobile applications, and automation controllers. Wireless connectivity and AI-enabled software are becoming increasingly important as consumers seek easy installation and intelligent operation.
By application, the market covers security and surveillance, lighting control, HVAC and climate management, energy management, entertainment, smart appliances, healthcare and aging in place, access control, and other residential applications. Security remains a major adoption driver, while energy management and AI-powered automation provide significant future opportunities.
By region, the market includes North America, Europe, Asia Pacific, Latin America, and the Middle East & Africa. North America is expected to maintain its leadership, while Asia Pacific is projected to experience the fastest growth through 2035.
-
Smart security represents a major product segment.
-
Wi-Fi, Thread, Matter, and other wireless technologies support DIY adoption.
-
AI-powered automation is increasing product intelligence.
-
Energy management represents a major future opportunity.
-
Asia Pacific is expected to be the fastest-growing region.
Conclusion
The DIY Home Automation Market is moving from basic connected-device control toward intelligent, interoperable, and increasingly autonomous residential ecosystems. The market is projected to grow from US$ 18.0 Billion - US$ 22.0 Billion in 2025 to US$ 55.0 Billion - US$ 68.0 Billion by 2035 at a CAGR of 11.5% - 12.5% from 2025 to 2035.
AI will play a central role in this transition. Rather than requiring users to manually program every device, AI-powered platforms can understand natural-language commands, learn household routines, detect anomalies, optimize energy consumption, and coordinate multiple devices automatically.
IoT connectivity will remain the foundation of this ecosystem, while Matter, Thread, edge computing, cloud services, and improved cybersecurity will help create more reliable connected environments. The integration of smart homes with solar power, batteries, electric vehicles, and smart grids could further expand the market's strategic importance.
Through 2035, companies that deliver affordable, interoperable, secure, easy-to-install, and AI-enabled products are expected to gain a competitive advantage. For consumers, the value proposition will increasingly extend beyond convenience to include security, energy efficiency, personalization, accessibility, and predictive home management.
FAQs
1. What is the projected market size of the DIY Home Automation Market?
The DIY Home Automation Market is estimated at US$ 18.0 Billion - US$ 22.0 Billion in 2025 and is projected to reach US$ 55.0 Billion - US$ 68.0 Billion by 2035.
2. What is the expected growth rate of the DIY Home Automation Market?
The market is expected to grow at approximately 11.5% - 12.5% CAGR from 2025 to 2035, driven by connected devices, AI, IoT, smart security, energy management, and wireless technologies.
3. What are the key drivers of the DIY Home Automation Market?
Key drivers include falling smart-device costs, consumer demand for convenience and security, AI-powered automation, IoT connectivity, energy-efficiency requirements, Matter interoperability, and growing smartphone adoption.
4. Which region is expected to lead the DIY Home Automation Market?
North America is expected to remain the leading regional market, while Asia Pacific is projected to be the fastest-growing region through 2035.
5. Who are the key companies in the DIY Home Automation Market?
Major companies include Google, Amazon, Apple, Samsung, Xiaomi, Schneider Electric, Resideo Technologies, ADT, Signify, and Bosch.
 Exclusive indicates content/data unique to MarketsandMarkets and not available with any competitors.
Table of Contents
1 Introduction (Page No. - 16)
1.1 Study Objectives
1.2 Market Definition
1.3 Study Scope
1.3.1 Markets Covered
1.3.2 Years Considered for the Study
1.4 Currency & Pricing
1.5 Limitations
1.6 Stakeholders
2 Research Methodology (Page No. - 19)
2.1 Research Data
2.1.1 Secondary Data
2.1.1.1 Key Data From Secondary Sources
2.1.2 Primary Data
2.1.2.1 Key Data From Primary Sources
2.1.2.2 Key Industry Insights
2.1.2.3 Breakdown of Primaries Interviews
2.2 Demand-Side Analysis for DIY Home Automation Market
2.2.1 Demand-Side Analysis
2.2.1.1 Growing Demand From Real Estate Industry
2.2.1.2 Increased Demand for Security and Access Control Products Due to Increasing Crime Rate
2.2.1.3 Renters Would Be More Willing to Opt for DIY Rather Than Expensive Professionally Installed Home Automation System
2.3 Market Size Estimation
2.3.1 Bottom-Up Approach
2.3.2 Top-Down Approach
2.4 Market Breakdown and Data Triangulation
2.5 Research Assumptions
2.5.1 Assumptions
3 Executive Summary (Page No. - 30)
4 Premium Insights (Page No. - 35)
4.1 Attractive Market Opportunities in DIY Home Automation Market
4.2 Security & Access Control Market, By Geography
4.3 Market in the Asia-Pacific Region
4.4 Europe Market, By Hardware
4.5 Life Cycle Analysis, By Geography
5 Market Overview (Page No. - 40)
5.1 Introduction
5.2 Market Segmentation
5.2.1 Market, By Offering
5.2.2 Market, By Technology
5.2.3 Market, By Geography
5.3 Market Evolution
5.4 Market Dynamics
5.4.1 Drivers
5.4.1.1 DIY Systems are Cheaper in Cost Than the Professionally Installed Home Automation Systems
5.4.1.2 Increasing Desire of the Consumer for Convenience, Connectivity, Safety, and Security
5.4.1.3 Demand for Energy-Efficient and Green Product Solutions
5.4.1.4 Continuous Technology Advancement in Sensors, Communication, and Analytics
5.4.2 Restraints
5.4.2.1 Lack of Awareness for DIY Home Automation Systems
5.4.2.2 Lack of Standard Guidelines for Manufacturers to Drag Sales for DIY Home Automation Products
5.4.3 Opportunities
5.4.3.1 Strong Initiatives From Government to Promote Green Building, Smart Cities, and Green Cities
5.4.3.2 Multiple Communication Protocol Compatibility for Redundancy
5.4.3.3 Unlimited Opportunities in Connecting Different Types of Endpoints
5.4.4 Challenges
5.4.4.1 Linking Disparate Systems, Limited Functionality, and Lack of Open Standards
5.4.5 Burning Issue
5.4.5.1 Limited Exposure to Technologies and Lack of Expertise
5.4.6 Winning Imperative
5.4.6.1 Affordable, Reliable, and User-Friendly Products and Software DIY Home Automation Products
6 Industry Trends (Page No. - 53)
6.1 Introduction
6.2 Value Chain Analysis
6.3 Industry Trends
6.4 Porter’s Five Forces Analysis
6.4.1 Intensity of Competitive Rivalry
6.4.2 Threat of Substitutes
6.4.3 Bargaining Power of Buyers
6.4.4 Bargaining Power of Suppliers
6.4.5 Threat of New Entrants
7 DIY Home Automation Market, By Offering (Page No. - 64)
7.1 Introduction
7.2 Hardware
7.2.1 Smart Hub
7.2.2 Security & Access Control
7.2.2.1 Door Locks
7.2.2.2 Smoke & Carbon Monoxide Detectors
7.2.2.3 Security Cameras
7.2.2.4 Door/Window and Motion Sensors
7.2.2.5 Others
7.2.3 Lighting Control
7.2.4 Entertainment Control
7.2.5 Climate Control
7.2.6 Others
7.3 Managed Services
8 DIY Home Automation Market, By Technology (Page No. - 95)
8.1 Introduction
8.1.1 Network Technologies
8.1.1.1 GSM/HSPA Networks
8.1.1.2 CDMA Networks
8.1.1.3 Lte Networks
8.1.2 Wireless Technologies
8.1.2.1 Zigbee
8.1.2.2 Z-Wave
8.1.2.3 Wi-Fi
8.1.2.4 X10
8.1.2.5 Bluetooth
8.1.2.6 Insteon
8.1.2.7 Enocean
8.1.3 Other Protocols and Standards
8.1.3.1 Digital Addressable Lighting Interface (DALI)
8.1.3.2 National Electrical Manufactures Association (NEMA)
8.1.3.3 Lonworks
8.1.3.4 KNX
8.1.3.5 Home Pna Alliance
8.1.3.6 Cebus
8.1.3.7 Upb
9 DIY Home Automation Market, By Geography (Page No. - 103)
9.1 Introduction
9.2 Americas
9.2.1 North America
9.2.1.1 U.S.
9.2.1.2 Canada
9.2.1.3 Mexico
9.2.2 South America
9.2.2.1 Brazil
9.2.2.2 Argentina
9.3 Europe
9.3.1 Germany
9.3.2 U.K.
9.3.3 France
9.3.4 Italy
9.4 APAC
9.4.1 Australia
9.4.2 China
9.4.3 Japan
9.4.4 South Korea
9.5 RoW
9.5.1 Middle East
9.5.2 Africa
10 Competitive Landscape (Page No. - 134)
10.1 Overview
10.2 Market Ranking for DIY Home Automation Market, 2014
10.3 Competitive Scenario
10.4 Recent Developments
10.4.1 New Product Launches
10.4.2 Agreements, Partnerships, Collaborations, and Joint Ventures
10.4.3 Expansions
10.4.4 Mergers & Acquistions
11 Company Profiles (Page No. - 143)
(Company at A Glance, Recent Financials, Products & Services, Strategies & Insights, & Recent Developments)*
11.1 Introduction
11.2 Icontrol Networks, Inc.
11.3 Nortek, Inc.
11.4 Smartlabs, Inc
11.5 Nest Labs, Inc.
11.6 Ismartalarm
11.7 Belkin International, Inc.
11.8 Ingersoll-Rand PLC.
11.9 Lowe's Iris
11.10 Vera Control Ltd.
11.11 Smartthings, Inc.
11.12 Wink
*Details on Company at A Glance, Recent Financials, Products & Services, Strategies & Insights, & Recent Developments Might Not Be Captured in Case of Unlisted Companies.
12 Appendix (Page No. - 172)
12.1 Insights of Industry Experts
12.2 Discussion Guide
12.3 Introducing RT: Real-Time Market Intelligence
12.4 Available Customizations
12.5 Related Reports
List of Tables (81 Tables)
Table 1 Cheap DIY Home Automation Systems and Desire of the Consumer for Convenience and Security Propels the Growth of Market
Table 2 Lack of Standard Guidelines and Awareness for DIY Home Automation Products Acts as A Hinderance to the Market
Table 3 Initiatives From Government to Promote Green Building & Green Cities to Provide A Huge Opportunity for the Market
Table 4 Limited Functionality and Lack of Open Standards—The Major Challenge for the Market
Table 5 The Porter’s Five Forces Analysis: High Degree of Competition is Likely to Have A Maximum Impact on the Overall Market,2014
Table 6 Market Size, By Offerings, 2013–2020 (USD Million)
Table 7 Market Size, By Hardware, 2013–2020 (USD Million)
Table 8 Market for Smart Hubs, By Region, 2013–2020 (USD Million)
Table 9 North America: Market for Smart Hubs, By Country, 2013–2020 (USD Million)
Table 10 South America: Market for Smart Hubs, By Geography, 2013–2020 (USD Million)
Table 11 Europe: : Market for Smart Hubs, By Geography, 2013–2020 (USD Million)
Table 12 APAC: Market for Smart Hubs, By Geography, 2013–2020 (USD Million)
Table 13 RoW: Market for Smart Hubs, By Region, 2013–2020 (USD Million)
Table 14 Market for Security & Access Control, By Product, 2013–2020 (USD Million)
Table 15 Market for Security & Access Control, By Products, 2013–2020 (Million Units)
Table 16 Market for Security & Access Control, By Region, 2013–2020 (USD Million)
Table 17 North America: Market for Security and Access Control, By Country, 2013–2020 (USD Million)
Table 18 South America: Market for Security and Access Control, By Geography, 2013–2020 (USD Million)
Table 19 Europe: Market for Security and Access Control, By Geography, 2013–2020 (USD Million)
Table 20 APAC: Market for Security and Access Control, By Geography, 2013–2020 (USD Million)
Table 21 RoW: Market for Security and Access Control, By Region, 2013–2020 (USD Million)
Table 22 Market for Lighting Control, By Region, 2013–2020 (USD Million)
Table 23 North America: Market for Lighting Control, By Country, 2013–2020 (USD Million)
Table 24 South America: Market for Lighting Control, By Geography, 2013–2020 (USD Million)
Table 25 Europe: Market for Lighting Control, By Geography, 2013–2020 (USD Million)
Table 26 APAC: Market for Lighting Control, By Geography, 2013–2020 (USD Million)
Table 27 RoW: Market for Lighting Control, By Region, 2013–2020 (USD Million)
Table 28 Market for Entertainment Control, By Region, 2013–2020 (USD Million)
Table 29 North America: Market for Entertainment Control, By Country, 2013–2020 (USD Million)
Table 30 South America: Market for Entertainment Control, By Geography, 2013–2020 (USD Million)
Table 31 Europe: Market for Entertainment Control, By Geography, 2013–2020 (USD Million)
Table 32 APAC: Market for Entertainment Control, By Geography, 2013–2020 (USD Million)
Table 33 RoW: Market for Entertainment Control, By Region, 2013–2020 (USD Million)
Table 34 Market for Climate Control, By Region, 2013–2020 (USD Million)
Table 35 North America: Market for Climate Control, By Country, 2013–2020 (USD Million)
Table 36 South America: Market for Climate Control, By Geography, 2013–2020 (USD Million)
Table 37 Europe: Market for Climate Control, Bygeography, 2013–2020 (USD Million)
Table 38 APAC: Market for Climate Control, By Geography, 2013–2020 (USD Million)
Table 39 RoW: Market for Climate Control, By Region, 2013–2020 (USD Million)
Table 40 Market for Others, By Region, 2013–2020 (USD Million)
Table 41 North America: Market for Others, By Country, 2013–2020 (USD Million)
Table 42 South America: Market for Others, By Geography, 2013-2020 (USD Million)
Table 43 Europe: Market for Others, By Geography, 2013–2020 (USD Million)
Table 44 APAC: Market for Others, By Geography, 2013-2020 (USD Million)
Table 45 RoW: Market for Others, By Region, 2013–2020 (USD Million)
Table 46 Market Size, By Region, 2013–2020 (USD Million)
Table 47 Americas: Market Size, By Region, 2013–2020 (USD Million)
Table 48 Americas: Market Size, By Hardware, 2013–2020 (USD Million)
Table 49 North America: Market Size, By Country, 2013–2020 (USD Million)
Table 50 North America: Market Size, By Hardware, 2013–2020 (USD Million)
Table 51 U.S.: Market Size, By Hardware, 2013–2020 (USD Million)
Table 52 Canada: Market Size, By Hardware, 2013–2020 (USD Million)
Table 53 Mexico: Market Size, By Hardware, 2013–2020 (USD Million)
Table 54 South America: DIY Home Automation Market Size, By Geography, 2013–2020 (USD Million)
Table 55 South America: Market Size, By Hardware, 2013–2020 (USD Million)
Table 56 Brazil: Market Size, By Hardware, 2013–2020 (USD Million)
Table 57 Argentina: Market Size, By Hardware, 2013–2020 (USD Million)
Table 58 Rest of South America: Market Size, By Hardware, 2013–2020 (USD Million)
Table 59 Europe: Market Size, By Geography, 2013–2020 (USD Million)
Table 60 Europe: Market Size, By Hardware, 2013–2020 (USD Million)
Table 61 Germany: Market Size, By Hardware, 2013–2020 (USD Million)
Table 62 U.K.: Market Size, By Hardware, 2013–2020 (USD Million)
Table 63 France: Market Size, By Hardware, 2013–2020 (USD Million)
Table 64 Italy: Market Size, By Hardware, 2013–2020 (USD Million)
Table 65 Rest of Europe: Market Size, By Hardware, 2013–2020 (USD Million)
Table 66 APAC: Market Size, By Geography, 2013–2020 (USD Million)
Table 67 APAC: Market Size, By Hardware, 2013–2020 (USD Million)
Table 68 Australia: Market Size, By Hardware, 2013–2020 (USD Million)
Table 69 China: Market Size, By Hardware, 2013–2020 (USD Million)
Table 70 Japan Market Size, By Hardware, 2013–2020 (USD Million)
Table 71 South Korea: Market Size, By Hardware, 2013–2020 (USD Million)
Table 72 Rest of APAC: Market Size, By Hardware, 2013–2020 (USD Million)
Table 73 RoW: Market Size, By Region, 2013–2020 (USD Million)
Table 74 RoW: Market Size, By Hardware, 2013–2020 (USD Million)
Table 75 Middle East: Market Size, By Hardware, 2013–2020 (USD Million)
Table 76 Africa: Market Size, By Hardware, 2013–2020 (USD Million)
Table 77 Market Ranking of the Top 5 Players in Market, 2014
Table 78 New Product Launches, 2013–2015
Table 79 Agreements, Partnerships, Collaborations and Joint Ventures, 2013 - 2015
Table 80 Expansions, 2013 – 2015
Table 81 Merger & Acquisitions, 2013 – 2015
List of Figures (71 Figures)
Figure 1 Research Design
Figure 2 Estimated Size of Real Estate, 2011 Vs. 2021(USD Trillion)
Figure 3 Growing Crime Rates in Developed Countries (2012-2013)
Figure 4 U.S. Households- Renters & Owners Data, 2014
Figure 5 Market Size Estimation Methodology: Bottom-Up Approach
Figure 6 Market Size Estimation Methodology: Top-Down Approach
Figure 7 Assumptions for the Research Study
Figure 8 Security & Access Control Products Expected to Hold the Maximum Value in the Market (2015-2020)
Figure 9 Geographic Analysis of APAC DIY Home Automation Market
Figure 10 Americas Expected to Dominate the Lighting Control Market for DIY Home Automation in 2020
Figure 11 Global Market, By Geography, 2014
Figure 12 Increasing Need for Safety & Security Products Expected to Drive the Market
Figure 13 Americas Expected to Grow at the Highest Rate During the Forecast Period
Figure 14 Security & Access Control Product Expected to Capture the Largest Share in Asia-Pacific Market
Figure 15 Security & Access Control Expected to Grow at the Highest Growth Rate During the Forecast Period
Figure 16 Market Currently in the Growth Stage in APAC and Europe Region
Figure 17 DIY Home Automation Market: By Geography
Figure 18 Evolution of the Market
Figure 19 Cost Effectiveness of DIY Home Automation System Acts as A Major Driving Factor for the Market
Figure 20 Number of Installed Smart Home Systems in North America From 2013 to 2015 (Million Units)
Figure 21 Global Penetration of the Energy-Efficient Lighting Product Market From 2013 to 2020
Figure 22 Value Chain Analysis (2014): Major Value Added During the Distribution Phase
Figure 23 Key Industry Trends in the Market
Figure 24 Life Cycle of Market, By Product, 2014
Figure 25 The Porter’s Five Forces Analysis (2014):
Figure 26 Market: Porter’s Five Forces Analysis, 2014
Figure 27 Intensity of Competitive Rivalry: Competition in the Market Due to the High Industry Growth Rate
Figure 28 Threat of Substitutes to Be Low Due to the Low Cost of the DIY Home Automation Systems
Figure 29 Bargaining Power of Buyers Will Be Medium as the Number of Buyer and Adoption Rate is High
Figure 30 Bargaining Power of Suppliers: Product Differentiation in Market to Drive the Market for Suppliers During the Forecast Period
Figure 31 Threat of New Entrants: With Innovative Product Developments New Entrants are Likely to Enter This Market
Figure 32 Segmentation of the Market: By Offerings
Figure 33 Segmentation of the Market: By Hardware
Figure 34 Security & Access Control Product Expected to Dominate the Market During the Forecast Period
Figure 35 Asia-Pacific Expected to Grow at A Faster Rate for the Smart Hub Market During the Forecast Period
Figure 36 North America DIY Market for Smart Hubs Snapshot, By Country: 2014
Figure 37 Door Locks Market Expected to Grow at A Faster Rate for the Security & Access Control Product Market During the Forecast Period
Figure 38 North America Expected to Hold the Largest Market Share for the Security & Access Control Market During the Forecast Period
Figure 39 North America DIY Market for Security & Access Control Product Market Snapshot, By Country: 2014
Figure 40 APAC Expected to Grow at the Highest Growth Rate for the Lighting Control Market During the Forecast Period
Figure 41 North America Market for Lighting Control Products Snapshot, By Country: 2014
Figure 42 Americas Expected to Hold the Largest Market Size of the Entertainment Control Market During the Forecast Period
Figure 43 North American Market for Entertainment Control Snapshot, By Country: 2014
Figure 44 RoW Expected to Grow at the Fastest Rate for the Climate Control Market During the Forecast Period
Figure 45 North America DIY Market for Climate Control Snapshot, By Country, 2014
Figure 46 Americas Expected to Dominate the Other Smart Products Market During the Forecast Period
Figure 47 Segmentation of the Market: By Technology
Figure 48 Network Technologies
Figure 49 Wireless Technologies
Figure 50 DIY Home Automation Market, By Geography
Figure 51 Geographic Snapshot- Japan Estimated to Register the Highest Growth Rate During the Forecast Period
Figure 52 The U.S. Estimated to Dominate the Market Between 2015 and 2020
Figure 53 The North American Market Snapshot: Market Expected to Be Driven By Increasing Need of Convenience, Safety, and Security
Figure 54 Segmentation: North America
Figure 55 Segmentation: South America
Figure 56 Europe Market Snapshot: Market Expected to Be Driven By the Increasing Demand From the People Living of the Rented Homes
Figure 57 Segmentation: Europe
Figure 58 Asia-Pacific Market Snapshot: Market Expected to Be Driven By the High Growth of Real Estate Industry and Changing Lifestyle of the People
Figure 59 Segmentation: Asia-Pacific
Figure 60 RoW Market Snapshot: Market Expected to Be Driven By the Changing Lifestyle of the People Towards Luxurious Products
Figure 61 Segmentation: Rest of the World
Figure 62 Key Growth Strategies Adopted By Top Companies Between 2013 and 2015
Figure 63 Market Evaluation Framework-New Product Launches Fueled Growth and Innovation in 2013 and 2015
Figure 64 Battle for Market Share: New Product Launch Was the Key Strategy
Figure 65 Icontrol Networks, Inc.: SWOT Analysis
Figure 66 Nortek, Inc.: Company Snapshot
Figure 67 Nortek, Inc.: SWOT Analysis
Figure 68 Smartlabs, Inc.: SWOT Analysis
Figure 69 Nest Labs, Inc.: SWOT Analysis
Figure 70 Ismartalarm: SWOT Analysis
Figure 71 Ingersoll-Rand PLC.: Company Snapshot
This research study involved the extensive usage of secondary sources to identify and collect information useful for this technical, market-oriented, and commercial study of the DIY home automation market. The primary sources are mainly several industry experts from core and related industries and preferred suppliers, manufacturers, distributors, service providers, reimbursement providers, technology developers, alliances, standards and certification organizations from companies, and organizations related to all the segments of this industry’s value chain. In-depth interviews were conducted with various primary respondents that include key industry participants, subject matter experts (SMEs), C-level executives of key market players, and industry consultants among other experts to obtain and verify critical qualitative and quantitative information as well as to assess future prospects.
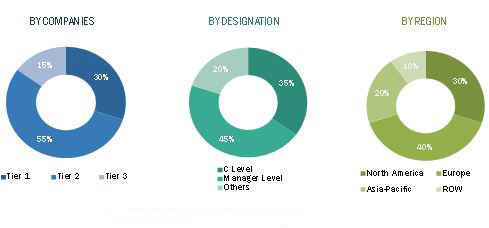
To know about the assumptions considered for the study, download the pdf brochure
The industry ecosystem of the DIY home automation market includes raw material and manufacturing equipment suppliers, electronic design automation (EDA) and design tool vendors, integrated device manufacturers (IDMs), Market players, DIY home automation intellectual property players, DIY home automation technology platform developers, DIY home automation semiconductor device manufacturers, DIY home automation end-point manufacturers, DIY home automation product manufacturers (ODMs), DIY home automation original equipment manufacturers (OEMs), ODM and OEM technology solution providers, assembly, testing, distributors, and end-user segment.
The target audience for the report is as follows:
- Companies in the DIY home automation and technology market
- Home automation apps and software designing companies
- Electronics and semi-conductor companies
- Investment community interested in DIY home automation technology market
- Research institutes and organizations
- Homeowners
- Designers/consultants (HVAC, security, and fire & safety)
- Market research and consulting firms
- Government and financial institutions
- Component manufacturers (sensors & controls)
Scope of the Report:
- On the basis of types of offerings
The global DIY home automation market by offerings is categorized into hardware and managed services. The hardware category is further segmented into various products such as smart hubs, security & access control, lighting control entertainment control, climate control, and other appliances.
- On the basis of technology
The global DIY home automation market by technology is categorized into various technologies such as network technologies, wireless technologies, and other protocols & standards.
- On the basis of geography
Geographical analysis covers Americas, Europe, Asia-Pacific, and the RoW.
Available Customizations
With the given market data, MarketsandMarkets offers customizations as per the Company’s specific needs. The following customization options are available for the report:
Geographic Analysis
- Further breakdown of the North American DIY home automation market into countries such as U.S., Canada, Mexico, and Rest of North America
- Comprehensive coverage of regulations followed in each region (Americas, APAC, and Europe)
Company Information
- Detailed analysis and profiling of additional market players (Up to 5).













Growth opportunities and latent adjacency in DIY Home Automation Market
I'm a student at master degree and I'm requested to prepare research about smart homes market share in Egypt. Could you help me with the research methodology for the same?
The main objectives of my research is about of domestic or home automation market, which represent an opportunity for this market in Mexico. Does the scope include IoT or any other latest trends in the market?
DIY Security in United States - Self-Installed and Professionally Installed (like Front point, Live Watch, Protect America). Can you provide me with the estimates for smart homes in US?