Document Management Systems Market by Offering (Solutions, Services), Deployment Mode (On-Premise, Cloud-Based, and Hybrid), Organization (Small & Medium-Sized Enterprise, Large Enterprise), Application, and Geography - Global Forecast to 2032


 Exclusive indicates content/data unique to MarketsandMarkets and not available with any competitors.
Table of Contents
1 Introduction (Page No. - 15)
1.1 Objectives of the Study
1.2 Market Definition
1.3 Study Scope
1.3.1 Markets Covered
1.3.2 Geographical Scope
1.3.3 Years Considered for the Study
1.4 Currency
1.5 Limitations
1.6 Stakeholders
2 Research Methodology (Page No. - 18)
2.1 Research Data
2.1.1 Secondary Data
2.1.1.1 Major Secondary Sources
2.1.1.2 Secondary Sources
2.1.2 Primary Data
2.1.2.1 Breakdown of Primaries
2.1.2.2 Key Data From Primary Sources
2.1.2.3 Key Industry Insights
2.2 Market Size Estimation
2.2.1 Bottom-Up Approach
2.2.2 Top-Down Approach
2.3 Market Breakdown and Data Triangulation
2.4 Research Assumptions
3 Executive Summary (Page No. - 28)
4 Premium Insights (Page No. - 32)
4.1 Market: Overview
4.2 North America: Market By Deployment Mode
4.3 APAC: Market, By Application
4.4 APAC: Market, By Organization
4.5 Market, By Country/Region
5 Market Overview (Page No. - 36)
5.1 Introduction
5.2 Market Dynamics
5.2.1 Drivers
5.2.1.1 Increasing Need to Streamline Business Operations
5.2.1.2 Benefits of Digitalizing Content Across Enterprises
5.2.1.3 Increasing Need to Adhere to Compliance Requirements
5.2.1.4 Increasing Adoption of Cloud-Based Services and Cloud Computing
5.2.2 Restraints
5.2.2.1 High Implementation Costs
5.2.3 Opportunities
5.2.3.1 Integration With Client and Employee Portals
5.2.3.2 Initiatives From Organizations to Reduce Paper Wastage
5.2.4 Challenges
5.2.4.1 Data Migration From Legacy Systems to Cloud-Based Content Management
5.3 Value Chain Analysis
6 Document Management Systems Market, By Offering (Page No. - 42)
6.1 Introduction
6.2 Solutions
6.3 Services
6.3.1 Implementation Services
6.3.2 Training and Education
6.3.3 Support and Maintenance
7 Market, By Deployment Mode (Page No. - 45)
7.1 Introduction
7.2 On-Premise
7.3 Cloud-Based
7.4 Hybrid
8 Market, By Organization (Page No. - 51)
8.1 Introduction
8.2 Small and Medium-Sized Enterprises
8.3 Large Enterprises
9 Market, By Application (Page No. - 55)
9.1 Introduction
9.2 Banking, Financial Services, and Insurance (BFSI)
9.3 Government
9.4 Education
9.5 Healthcare
9.6 Corporate
9.7 Industrial Manufacturing
9.8 Retail
9.9 Other Applications
10 Geographic Analysis (Page No. - 81)
10.1 Introduction
10.2 North America
10.2.1 US
10.2.2 Canada
10.2.3 Mexico
10.3 Europe
10.3.1 UK
10.3.2 Germany
10.3.3 France
10.3.4 Rest of Europe
10.4 APAC
10.4.1 China
10.4.2 Japan
10.4.3 South Korea
10.4.4 Australia
10.4.5 Rest of APAC
10.5 RoW
10.5.1 Middle East and Africa
10.5.2 South America
11 Competitive Landscape (Page No. - 100)
11.1 Overview
11.2 Market Ranking
11.3 Competitive Scenario
11.3.1 New Product Launches
11.3.2 Partnerships/Agreements/Collaborations
11.3.3 Acquisitions
11.3.4 Expansions
12 Company Profiles (Page No. - 104)
(Business Overview, Products & Software Offered, Strength of Product Portfolio, Business Strategy Excellence, Recent Developments, and Key Relationships)*
12.1 Opentext
12.2 Xerox
12.3 IBM
12.4 Canon
12.5 Hyland
12.6 Oracle
12.7 Ricoh Company
12.8 M-Files
12.9 Efilecabinet
12.10 Newgen Software
12.11 Alfresco
12.12 Springcm
12.13 Key Innovators and Start-Ups
12.13.1 Maxxvault
12.13.2 Box
12.13.3 Docuware
12.13.4 Docstar
12.13.5 Sapphire Systems
12.14 Other Important Players
12.14.1 Everteam
12.14.2 Laserfiche
12.14.3 Fabricated Software
12.14.4 Office Gemini
12.14.5 Open Document Management System
12.14.6 Mastercontrol
12.14.7 Lucion Technologies
12.14.8 Ideagen
12.14.9 LSSP
12.14.10 Docpoint Solutions
12.14.11 Blue Project Software
12.14.12 Ademero
12.14.13 Zoho
*Details on Business Overview, Products & Software Offered, Strength of Product Portfolio, Business Strategy Excellence, Recent Developments, and Key Relationships Might Not Be Captured in Case of Unlisted Companies.
13 Appendix (Page No. - 150)
13.1 Insights of Industry Experts
13.2 Discussion Guide
13.3 Knowledge Store: Marketsandmarkets’ Subscription Portal
13.4 Introducing RT: Real-Time Market Intelligence
13.5 Available Customizations
13.6 Related Reports
13.7 Author Details
List of Tables (82 Tables)
Table 1 Market, By Offering, 2014–2023 (USD Billion)
Table 2 Market, By Deployment Mode, 2014–2023 (USD Billion)
Table 3 On-Premise Document Management Systems Market, By Application, 2014–2023 (USD Million)
Table 4 On-Premise Market, By Region, 2014–2023 (USD Million)
Table 5 Cloud-Based Document Management Systems Market, By Application, 2014–2023 (USD Million)
Table 6 Cloud-Based Market, By Region, 2014–2023 (USD Million)
Table 7 Hybrid Document Management Systems Market, By Application, 2014–2023 (USD Million)
Table 8 Hybrid Market, By Region, 2014–2023 (USD Million)
Table 9 Market, By Organization, 2014–2023 (USD Billion)
Table 10 Market for Small and Medium-Sized Enterprises, By Region, 2015–2023 (USD Million)
Table 11 Market for Large Enterprises, By Region, 2014–2023 (USD Million)
Table 12 Market, By Application, 2014–2023 (USD Billion)
Table 13 Market for Banking, Financial Services, and Insurance, By Deployment Mode, 2014–2023 (USD Million)
Table 14 Market for Banking, Financial Services, and Insurance, By Region, 2014–2023 (USD Million)
Table 15 North America: Market for Banking, Financial Services, and Insurance, By Country, 2014–2023 (USD Million)
Table 16 Europe: Market for Banking, Financial Services, and Insurance, By Country, 2014–2023 (USD Million)
Table 17 APAC: Market for Banking, Financial Services, and Insurance, By Country, 2014–2023 (USD Million)
Table 18 RoW: Market for Banking, Financial Services, and Insurance, By Region, 2014–2023 (USD Million)
Table 19 Market for Government Applications, By Deployment Mode, 2014–2023 (USD Million)
Table 20 Market for Government Applications, By Region, 2014–2023 (USD Million)
Table 21 North America: Market for Government Applications, By Country, 2014–2023 (USD Million)
Table 22 Europe: Market for Government Applications, By Country, 2014–2023 (USD Million)
Table 23 APAC: Market for Government Applications, By Country, 2014–2023 (USD Million)
Table 24 RoW: Market for Government Applications, By Region, 2014–2023 (USD Million)
Table 25 Market for Education, By Deployment Mode, 2014–2023 (USD Million)
Table 26 Market for Education, By Region, 2014–2023 (USD Million)
Table 27 North America: Market for Education, By Country, 2014–2023 (USD Million)
Table 28 Europe: Market for Education, By Country, 2014–2023 (USD Million)
Table 29 APAC: Market for Education, By Country, 2014–2023 (USD Million)
Table 30 RoW: Market for Education, By Region, 2014–2023 (USD Million)
Table 31 Market for Healthcare, By Deployment Mode, 2014–2023 (USD Million)
Table 32 Market for Healthcare, By Region, 2014–2023 (USD Million)
Table 33 North America: Market for Healthcare, By Country, 2014–2023 (USD Million)
Table 34 Europe: Market for Healthcare, By Country, 2014–2023 (USD Million)
Table 35 APAC: Market for Healthcare, By Country, 2014–2023 (USD Million)
Table 36 RoW: Market for Healthcare, By Region, 2014–2023 (USD Million)
Table 37 Market for Corporate Applications, By Deployment Mode, 2014–2023 (USD Million)
Table 38 Market for Corporate Applications, By Region, 2014–2023 (USD Million)
Table 39 North America: Market for Corporate Applications, By Country, 2014–2023 (USD Million)
Table 40 Europe: Market for Corporate Applications, By Country, 2014–2023 (USD Million)
Table 41 APAC: Market for Corporate Applications, By Country, 2014–2023 (USD Million)
Table 42 RoW: Market for Corporate Applications, By Region, 2014–2023 (USD Million)
Table 43 Market for Industrial Manufacturing, By Deployment Mode, 2014–2023 (USD Million)
Table 44 Market for Industrial Manufacturing, By Region, 2014–2023 (USD Million)
Table 45 North America: Market for Industrial Manufacturing, By Country, 2014–2023 (USD Million)
Table 46 Europe: Market for Industrial Manufacturing, By Country, 2014–2023 (USD Million)
Table 47 APAC: Market for Industrial Manufacturing, By Country, 2014–2023 (USD Million)
Table 48 RoW: Market for Industrial Manufacturing, By Region, 2014–2023 (USD Million)
Table 49 Market for Retail, By Deployment Mode, 2014–2023 (USD Million)
Table 50 Market for Retail, By Region, 2014–2023 (USD Million)
Table 51 North America: Market for Retail, By Country, 2014–2023 (USD Million)
Table 52 Europe: Market for Retail, By Country, 2014–2023 (USD Million)
Table 53 APAC: Market for Retail, By Country, 2014–2023 (USD Million)
Table 54 RoW: Market for Retail, By Region, 2014–2023 (USD Million)
Table 55 Market for Other Applications, By Deployment Mode, 2014–2023 (USD Million)
Table 56 Market for Other Applications, By Region, 2014–2023 (USD Million)
Table 57 North America: Market for Other Applications, By Country, 2014–2023 (USD Million)
Table 58 Europe: Market for Other Applications, By Country, 2014–2023 (USD Million)
Table 59 APAC: Market for Other Applications, By Country, 2014–2023 (USD Million)
Table 60 RoW: Market for Other Applications, By Region, 2014–2023 (USD Million)
Table 61 Market, By Region, 2014–2023 (USD Billion)
Table 62 North America: Market, By Application, 2014–2023 (USD Million)
Table 63 North America: Market, By Organization, 2014–2023 (USD Billion)
Table 64 North America: Market, By Deployment Mode, 2014–2023 (USD Billion)
Table 65 North America: Market, By Country, 2014–2023 (USD Million)
Table 66 Europe: Market for Europe, By Application, 2014–2023 (USD Million)
Table 67 Europe: Market for Europe, By Organization, 2014–2023 (USD Million)
Table 68 Europe: Market for Europe, By Deployment Mode, 2014–2023 (USD Million)
Table 69 Europe: Market, By Country, 2014–2023 (USD Million)
Table 70 APAC: Market, By Application, 2014–2023 (USD Million)
Table 71 APAC: Market, By Organization, 2014–2023 (USD Million)
Table 72 APAC: Market, By Deployment Mode, 2014–2023 (USD Million)
Table 73 APAC: Market, By Country, 2014–2023 (USD Million)
Table 74 RoW: Market, By Application, 2014–2023 (USD Million)
Table 75 RoW: Market, By Organization, 2014–2023 (USD Billion)
Table 76 RoW: Market, By Deployment Mode, 2014–2023 (USD Billion)
Table 77 RoW: Market, By Region, 2015–2023 (USD Billion)
Table 78 Market Ranking of the Top 5 Players in the Market, 2016
Table 79 New Product Launches, By Company (2014–2017)
Table 80 Partnerships/Agreements/Collaborations/Contracts, By Company (2014–2017)
Table 81 Acquisitions, By Company (2014–2017)
Table 82 Expansions, By Company (2014–2017)
List of Figures (31 Figures)
Figure 1 Market: Research Design
Figure 2 Market Size Estimation Methodology: Bottom-Up Approach
Figure 3 Market Size Estimation Methodology: Top-Down Approach
Figure 4 Data Triangulation
Figure 5 Solutions to Dominate the Market During the Forecast Period
Figure 6 Government Applications to Register Highest Growth in the Market Between 2017 and 2023
Figure 7 Small and Medium-Sized Enterprises to Grow at the Highest Rate Between 2017 and 2023
Figure 8 Cloud-Based Deployment Mode to Dominate the Market During the Forecast Period
Figure 9 Efforts to Streamline Business Processes and Growing Initiatives to Digitalize Content Across Enterprises to Drive the Market During the Forecast Period
Figure 10 Hybrid Mode of Deployment Segment to Grow at the Highest CAGR in the North American Market During the Forecast Period
Figure 11 BFSI Applications to Dominate the Market in APAC in 2017
Figure 12 Small and Medium-Sized Enterprises Estimated to Grow at the Highest CAGR Between 2017 and 2023
Figure 13 Australia to Register the Highest Growth Rate During the Forecast Period
Figure 14 Market: Drivers, Restraints, Opportunities, & Challenges
Figure 15 Value Chain Analysis: Major Value Added During the Software Development and Integration Stages
Figure 16 Cloud-Based Market for Government Applications to Grow at the Highest CAGR During the Forecast Period
Figure 17 Australia is Expected to Grow at the Highest CAGR in the Market for Education
Figure 18 Cloud-Based Document Management Systems to Grow at the Highest Rate in the Market for Corporate Applications
Figure 19 Middle East and Africa to Grow at the Highest CAGR in the Market for Industrial Manufacturing
Figure 20 Geographic Snapshot: Market in APAC to Grow at the Highest CAGR During the Forecast Period
Figure 21 Market in Australia to Grow at the Highest CAGR Between 2017 and 2023
Figure 22 Snapshot: Market in North America
Figure 23 Snapshot: Market in Europe
Figure 24 APAC: Market Snapshot
Figure 25 Key Developments By Leading Players in the Market, 2014-2017
Figure 26 Opentext: Company Snapshot
Figure 27 Xerox: Company Snapshot
Figure 28 IBM: Company Snapshot
Figure 29 Canon: Company Snapshot
Figure 30 Oracle: Company Snapshot
Figure 31 Ricoh Company: Company Snapshot
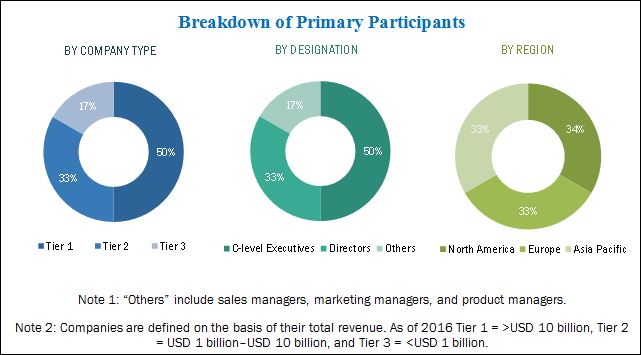
Research Methodology:
This research study incorporates the use of secondary sources, directories, and databases, such as D & B Hoovers, Bloomberg Businessweek, Factiva, and OneSource, to identify and collect information useful for the extensive technical, market-oriented, and commercial study of the document management systems market. Primary sources mainly comprise several experts from core and related industries, along with preferred suppliers, manufacturers, distributors, service providers, technology developers, alliances, and standards and certification organizations related to various parts of this industry’s value chain. In-depth interviews with various primary respondents, including key industry participants, subject matter experts (SMEs), C-level executives of key companies, and consultants have been conducted to obtain and verify critical qualitative and quantitative information as well as assess prospects. The breakdown of the profiles of primaries has been depicted in the following figure:
To know about the assumptions considered for the study, download the pdf brochure
This report provides valuable insights into the ecosystem of the document management systems market. The major players in this market include OpenText Corporation (Canada), Xerox Corporation (US), Canon Inc. (Japan), Ricoh Company Ltd. (Japan), IBM Corporation (US), eFileCabinet Inc. (US), SpringCM (US), Oracle Corporation (US), Alfresco Software Inc. (UK), and Hyland Software Inc. (US).
Please visit 360Quadrants to see the vendor listing of Landing Page Builders
Scope of the Report:
|
Report Metric |
Details |
|
Base year |
2016 |
|
Forecast period |
2017–2023 |
|
Units |
Value (USD) |
|
Segments covered |
Type, End User, Offerings, and Region |
|
Geographic regions covered |
North America, APAC, Europe, and RoW |
|
Companies covered |
OpenText Corporation (Canada), Xerox Corporation (US), Canon Inc. (Japan), Ricoh Company Ltd. (Japan), IBM Corporation (US), eFileCabinet Inc. (US), SpringCM (US), Oracle Corporation (US), Alfresco Software Inc. (UK), and Hyland Software Inc. (US). |
Key Target Audience:
- IT service providers
- Cloud service providers
- Printer suppliers
- Original equipment manufacturers (OEMs)
- System integrators and third-party vendors
- Software solution providers
- Government bodies
- Technology investors
- Enterprise data center professionals
- Research institutes and organizations
- Market research and consulting firms
Scope of the Report:
The research report segments the market into the following subsegments:
Market, by Offering
- Solutions
- Services
Market, by Deployment Mode
- On-premise
- Cloud-based
- Hybrid
Market, by Organization
- Small and Medium-sized enterprises (SMEs)
- Large Enterprises
Market, by Application
- BFSI
- Government
- Education
- Healthcare
- Corporate
- Industrial Manufacturing
- Retail
- Other Applications
Available Customizations:
With the given market data, MarketsandMarkets offers customizations according to the company’s specific needs. The following customization options are available for the report.
-
Company Information
- Detailed analysis and profiling of additional market players (up to 5)


Growth opportunities and latent adjacency in Document Management Systems Market