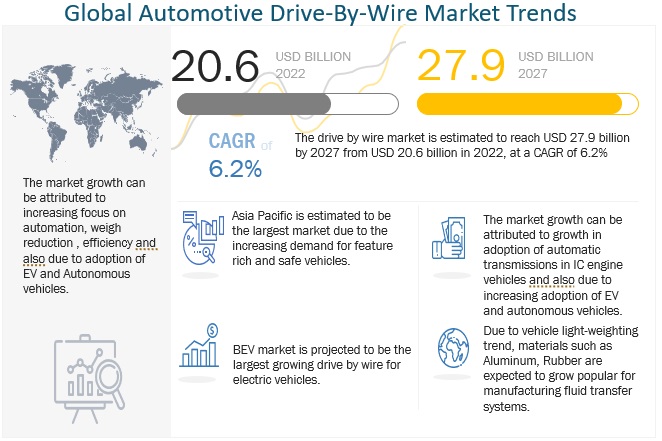
[215 Pages Report] The drive by wire market is projected to reach USD 31.9 billion by 2025 from an estimated USD 24.0 billion in 2020 at a CAGR of 5.9% during the forecast period. Increasing demand for electrification due to stringent emission norms, growing demand for premium and luxury vehicles, and light-weighting of vehicles are expected to be the major factors driving the drive by wire market in coming years. As mechanical linkages are replaced by electronics/sensors and control modules, the overall weight of the vehicle is reduced. Also, developments in electronic components like sensors, actuators, and control modules are expected to create future opportunities. However, despite advanced technicalities, there are chances of software or component failure, leading to serious injuries, or in a few cases, accidental death. Additionally, high costs associated with these electrified components is likely to restrict its public acceptance.
To know about the assumptions considered for the study, Request for Free Sample Report
Due to COVID-19, most of the countries followed a complete lockdown of more than two months, which, in turn, has impacted vehicle production in 2020. Manufacturing units around the world was shut down, thereby sales of vehicles dropped, thus impacting production on a global scale. Although some OEMs have resumed production, the drive by wire market may witness significant decline in 2020. Though the COVID-19 pandemic disrupted the ICE vehicle production in 2020, the market shown strong recovery interms of vehicle production and sales in 2021. Also, considering this recovery in the global automotive industry, various collaborations/supply contracts have taken place, thereby indicating a positive sign for the drive by wire market. For instance, in April 2020, Infineon Technologies AG announced the closing of the acquisition of Cypress Semiconductor Corporation.
Drive by wires can help free up space in a vehicle, which was earlier occupied by mechanical components, leading to freedom of design as well as benefits such as lower noise and vibration levels inside a vehicles cabin. For example, removal of the steering column can provide a manufacturer the freedom to position the driver seat conveniently anywhere in the vehicle as compared to the conventional front corner position and can also increase the interior space to accommodate more passengers without altering the length of the vehicle. The Nissan Murano concept car showcased the advantage of drive by wire by incorporating a third row of seats in an otherwise five-seat model.
Several drive by wire technologies were used in the concept car, which enabled Nissan to extend the wheelbase of the car, which, in turn, increased the cabin space by 110 mm. Drive by wires makes use of several sensors to manage and control the vehicle response with regard to drivers inputs. This makes it easier to integrate these systems with ADAS, as the sensors and actuators required for ADAS technologies are already present in drive by wires. Hence, with the ease of integration, technology adoption is expected to increase and positively impact the drive by wire market.
The major factor restraining the growth of the drive by wire market is the associated high cost. This has resulted in low acceptance of the system from manufacturers. Drive by wires makes use of a multitude of complex electronic components such as sensors and actuators to perform actions that were earlier performed by mechanical components. All this is strictly controlled by the use of several control units that process the inputs from different sensors and provide output signals to the actuator. Along with high cost, limited public acceptance or slow adoption is also somehow impacting the drive by wire market. One of the causes for slow adoption of drive by wire is the general disbelief associated with software coding and reliability of electrical components used in these systems. This has resulted in a negative impact on the purchase decision by buyers. Thus, the high cost of the technology/systems and failure of components are anticipated to adversely affect market growth.
Connected cars have a variety of sensors that sense the environment around the vehicle and exchange the signals with entities outside the vehicle by interacting through a cellular network. Behind the whole process of communication with external entities, a huge amount of data is generated that is useful to implement machine learning algorithms in the computer system of the vehicle. This is how OEMs and automotive Tier I suppliers, along with non-automotive players, are going to make autonomous vehicles possible. Hence, connected cars are just an initial stage for the beginning of an era of autonomous vehicles. Major automobile manufacturers have already announced their expected year2020by which they are going to release their autonomous vehicles.
The electric vehicle signifies the introduction of advanced technologies along with electric components. There are several risks associated with this technology, such as thermal runaway of battery bank and fire, which need to be cautiously assessed. Numerous safety aspects need to be considered regarding vehicle electrification, including electric system safety, functional system safety, battery charging safety, and vehicle maintenance, operation, and training. The current challenges that hinder the popularity of drive by wire are the limitation of overheating and electronic failure of components. Additionally, it is essential to examine the vehicle behavior as these systems often fail, making them inefficient when compared to mechanical components. Thus, auto manufacturers need to ensure that customers get systems that operate efficiently in varied conditions to effectively promote the use of drive by wire.
To know about the assumptions considered for the study, download the pdf brochure
There is a growing trend of using drive by wire systems in BEVs. BEVs use high voltage batteries, so it would be easy to accommodate the additional voltage form drive by wire systems. Additionally, a drive by wire system enhances the driving performance of BEVs and consumes less electrical energy from the battery, and as a result, the driving range of BEVs is enhanced further. Applications such as throttle-by-wire are widely used in BEVs, which controls the motor by sensing the accelerator pedal and sending commands to power inverter modules. Brake-by-wire and steer-by-wire are also gaining popularity but it still is a niche technology. For instance, the Audi e-tron is the first fully electric vehicle to include brake-by-wire technology. Thus, considering the aforementioned factors, the BEV drive by wire market is expected to grow significantly in the coming years.
The drive by wire application finds its usage in most of the mid-size and luxury car segments. The increasing production of mid-size and luxury class vehicles will drive the global passenger car drive by wire market in the coming years. Also, increased demand for enhanced safety and luxury with better operational accuracy is expected to propel the passenger car drive by wire market. Also, as stringent emission norms are being implemented globally, automakers are compelled to adopt drive by wire in their vehicles.
Every drive by wire application uses one or more actuators. For instance, brake-by-wire application has usage of four actuators dedicated to each wheel. Electrically actuated brakes are compatible with technologies such as anti-lock braking system (ABS) and stability control because electric actuators can be controlled accurately with the brake system ECU. In throttle-by-wire, the pedal connecting the gas pedal and the throttle valve is replaced by an electronic system consisting of a series of sensors and actuators. Various types of actuators, such as steering actuator, feedback actuator, pinion actuator, motor controlling throttle valve position actuator, and Servomotor/pump actuator, are used in drive-by-wire applications. The increasing number of vehicles with drive by wire applications is expected to drive the market for actuators globally.
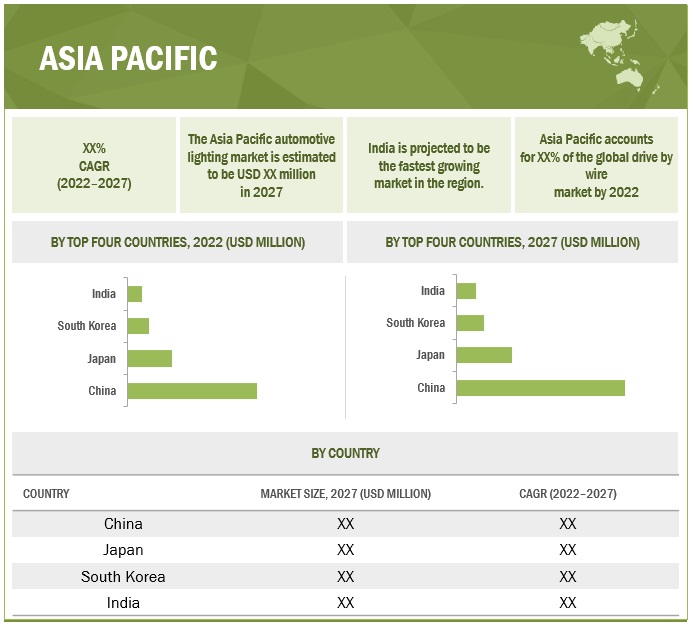
Asia Pacific has emerged as a hub for automotive production in recent years due to changing consumer preferences, increasing disposable income of the middle-class population, and cost advantages for OEMs due to availability of cheap labor and raw materials. OEMs such as Daimler, Volvo, BMW, Volkswagen, and Scania have manufacturing units in these countries. As China is a major market for automobiles in Asia Pacific, growing popularity of premium and luxury vehicles is expected to boost the Asia Pacific drive by wire market. . Also, with implementation of stringent emission norms in Asia Pacific, the drive by wire market is expected to get a boost. However, the cost-sensitive nature of the region and public preference for conventional vehicles may be a hindrance to this market growth.
The drive by wire market is dominated by globally established players such as Bosch (Germany), Continental (Germany), ZF(Germany), Infineon Technologies (Germany), Nexteer Automotive (US). These companies are key players in the drive by wire and adhere to strategies such as new product developments and strategic expansions through collaborations, partnerships, and mergers & acquisitions to gain traction in the growing demand of drive by wire.
What is the current size of the drive by wire market?
The drive by wire market is estimated to be USD 24.0 billion in 2020 and is projected to reach USD 31.9 billion by 2025 at a CAGR of 5.9%.
Who are the top key players in the drive by wire market?
Bosch (Germany), Continental (Germany), ZF (Germany), Infineon (Germany), Nexteer (US), CTS (US) are top key players in the drive by wire market. Moreover, these companies develop new products as per market demands and have effective supply chain strategies. Such advantages give these companies an edge over other companies that are component providers.
What is the COVID-19 impact on the drive by wire market?
The lockdowns, shutdown of manufacturing facilities, and closing of international borders for exports of automotive components have impacted the drive by wire market significantly in the first half of 2020. However, normalcy returning globally in the automotive supply chain due to lockdown relaxations has resulted in recovering automotive production and sales (but not with the same growth as pre-COVID). Also, recent safety-related developments such as the N95-certified Intelligent Air Purification System could prove to be a key consideration for buying vehicles. Taking all these factors into consideration, 2020 is expected to witness a decline in the drive by wire market growth and will rebound by early 2021.
What are the trends in the drive by wire market?
The technologies such as throttle-by-wire, brake-by-wire, and steer-by-wire will show tremendous growth because of its benefits related to vehicle performance and weight reduction. Additionally, growing inclination toward electric and hybrid and autonomous vehicles will boost the drive by wire market.
What is the future of the drive by wire market?
Since using drive by drive helps enhance the fuel economy of the vehicle, implementation of stringent emission standards is expected to force automakers in deploying drive by wire in their models. Also, additional benefits, such as vehicle weight reduction, enhanced safety and comfort, high operational accuracy, and reduced mechanical losses, are expected to further drive its adoption rate. Electric vehicles and autonomous vehicles are also going to play an important role in boosting drive by wire market. .
To speak to our analyst for a discussion on the above findings, click Speak to Analyst
TABLE OF CONTENTS
1 INTRODUCTION (Page No. - 21)
1.1 OBJECTIVES OF STUDY
1.2 MARKET DEFINITION
TABLE 1 MARKET DEFINITIONS
1.3 INCLUSIONS & EXCLUSIONS
1.4 MARKET SCOPE
1.4.1 MARKETS COVERED
FIGURE 1 DRIVE BY WIRE MARKET SEGMENTATION
1.5 STAKEHOLDERS
1.6 SUMMARY OF CHANGES
2 RESEARCH METHODOLOGY (Page No. - 26)
2.1 RESEARCH DATA
FIGURE 2 RESEARCH DESIGN
FIGURE 3 RESEARCH METHODOLOGY MODEL
2.1.1 SECONDARY DATA
2.1.1.1 List of key secondary sources
2.1.1.2 Key data from secondary sources
2.1.2 PRIMARY DATA
FIGURE 4 BREAKDOWN OF PRIMARY INTERVIEWS: BY STAKEHOLDER, DESIGNATION, & REGION
2.1.2.1 List of primary participants
2.2 MARKET ESTIMATION METHODOLOGY
FIGURE 5 RESEARCH METHODOLOGY: HYPOTHESIS BUILDING
2.2.1 BOTTOM-UP APPROACH
FIGURE 6 DRIVE BY WIRE MARKET SIZE: BOTTOM-UP APPROACH (ON-HIGHWAY VEHICLE, APPLICATION, AND REGION)
FIGURE 7 DRIVE BY WIRE MARKET SIZE: BOTTOM-UP APPROACH (ELECTRIC VEHICLE, AUTONOMOUS VEHICLE, AND OFF-HIGHWAY VEHICLE)
2.2.2 TOP-DOWN APPROACH
FIGURE 8 DRIVE BY WIRE MARKET SIZE: TOP-DOWN APPROACH (SENSOR)
FIGURE 9 DRIVE BY WIRE MARKET: RESEARCH DESIGN & METHODOLOGY
FIGURE 10 DRIVE BY WIRE MARKET: RESEARCH METHODOLOGY ILLUSTRATION OF REVENUE ESTIMATION
2.2.3 FACTOR ANALYSIS FOR MARKET SIZING: DEMAND AND SUPPLY SIDE
2.3 DATA TRIANGULATION
FIGURE 11 DATA TRIANGULATION METHODOLOGY
2.4 FACTOR ANALYSIS
2.5 RESEARCH ASSUMPTIONS
2.6 RESEARCH LIMITATIONS
3 EXECUTIVE SUMMARY (Page No. - 39)
3.1 PRE-& POST COVID-19 SCENARIO
FIGURE 12 PRE & POST COVID-19 SCENARIO: DRIVE BY WIRE MARKET, 2018-2025 (USD MILLION)
TABLE 2 DRIVE BY WIRE MARKET: PRE VS. POST COVID-19 SCENARIO, 20182025 (MILLION USD)
3.2 REPORT SUMMARY
FIGURE 13 DRIVE BY WIRE: MARKET OUTLOOK
FIGURE 14 DRIVE BY WIRE MARKET, BY REGION, 2020 VS. 2025 (USD MILLION)
4 PREMIUM INSIGHTS (Page No. - 44)
4.1 ATTRACTIVE OPPORTUNITIES IN THE DRIVE BY WIRE MARKET
FIGURE 15 STRINGENT EMISSION NORMS AND INCREASING WEIGHT REDUCTION TREND TO FUEL THE DRIVE BY WIRE MARKET DURING THE FORECAST PERIOD
4.2 DRIVE BY WIRE MARKET, BY REGION
FIGURE 16 NORTH AMERICA IS PROJECTED TO HOLD THE LARGEST MARKET, BY VALUE, 2020
4.3 DRIVE BY WIRE MARKET, BY APPLICATION
FIGURE 17 SHIFT-BY-WIRE SEGMENT TO BE THE FASTEST BY 2025 (USD MILLION)
4.4 DRIVE BY WIRE MARKET, BY ON-HIGHWAY VEHICLE
FIGURE 18 PASSENGER CAR SEGMENT TO BE THE LARGEST DURING THE FORECAST PERIOD (USD MILLION)
4.5 DRIVE BY WIRE MARKET, BY SENSOR TYPE
FIGURE 19 GEAR SHIFT POSITION SENSOR TO HOLD THE LARGEST SHARE BY 2025 (USD MILLION)
4.6 DRIVE BY WIRE MARKET, BY COMPONENT
FIGURE 20 ACTUATOR TO HOLD THE LARGEST SHARE BY 2025 (USD MILLION)
4.7 DRIVE BY WIRE MARKET, BY ELECTRIC & HYBRID VEHICLE
FIGURE 21 BEV SEGMENT IS ESTIMATED TO BE THE LARGEST AND FASTEST MARKET BY 2025 (USD BILLION)
4.8 DRIVE BY WIRE MARKET, BY OFF-HIGHWAY VEHICLE
FIGURE 22 AGRICULTURE TRACTORS TO BE THE LARGEST MARKET DURING THE FORECAST PERIOD (USD MILLION)
4.9 AUTONOMOUS VEHICLE DRIVE BY WIRE MARKET, BY REGION
FIGURE 23 NORTH AMERICA TO BE THE LARGEST MARKET DURING THE FORECAST PERIOD (USD MILLION)
5 MARKET OVERVIEW (Page No. - 49)
5.1 INTRODUCTION
5.2 YEARS CONSIDERED
FIGURE 24 DRIVE BY WIRE MARKET: MARKET DYNAMICS
5.2.1 DRIVERS
5.2.1.1 Decreased tail-pipe emission limits leading to vehicle light-weighting trend
5.2.1.1.1 On-road vehicles
TABLE 3 EURO-5 VS. EURO-6 VEHICLE EMISSION STANDARDS ON THE NEW EUROPEAN DRIVING CYCLE
TABLE 4 ON-ROAD VEHICLE EMISSION REGULATION OUTLOOK FOR PASSENGER CARS, 20162021
FIGURE 25 ON-ROAD VEHICLE EMISSION REGULATION OUTLOOK FOR HEAVY-DUTY VEHICLES, 20142025
5.2.1.1.2 Off-road vehicles
FIGURE 26 OFF-ROAD VEHICLE EMISSION REGULATION OUTLOOK, 20192025
5.2.1.2 Easy integration and independence of design will drive technological adoption
FIGURE 27 NISSAN MURANO CONCEPT CAR: DRIVE BY WIRE
5.2.1.3 High operational accuracy and reduced mechanical losses
5.2.2 RESTRAINTS
5.2.2.1 High cost and limited public acceptance
5.2.2.2 Possibility of data hacking
5.2.3 OPPORTUNITIES
5.2.3.1 Advancements in autonomous vehicles
5.2.3.1.1 Developments in autonomous off-highway equipment
TABLE 5 KEY PLAYERS IN AUTONOMOUS CONSTRUCTION EQUIPMENT MARKET
TABLE 6 KEY PLAYERS IN THE AUTONOMOUS TRACTORS & HARVESTERS MARKET
5.2.3.1.2 Increase in demand for autonomous cars
FIGURE 28 DEMAND FOR AUTONOMOUS CARS, 2025 VS. 2030 (000 UNITS)
5.2.3.1.3 Latent demand for semi-autonomous and autonomous trucks
TABLE 7 KEY PLAYERS IN THE GLOBAL TRUCK PLATOONING MARKET
5.2.3.2 Developments in drive by wire components
5.2.4 CHALLENGES
5.2.4.1 Fail-safe electronics
5.2.4.2 Compatibility issues with 12V architecture
5.2.4.3 Rapid developments in automotive electronics may pose challenges for vehicle manufacturers (supply chain)
5.2.4.4 Impact of COVID-19 on drive by wire market
5.3 DRIVE BY WIRE MARKET: SCENARIO ANALYSIS
FIGURE 29 DRIVE BY WIRE MARKET: COVID-19 SCENARIOS ANALYSIS
5.3.1 MOST LIKELY/REALISTIC SCENARIO
TABLE 8 DRIVE BY WIRE MARKET, (REALISTIC SCENARIO), BY REGION, 20182025 (MILLION USD)
5.3.2 HIGH COVID-19 IMPACT SCENARIO
TABLE 9 DRIVE BY WIRE MARKET (HIGH COVID-19 IMPACT SCENARIO), BY REGION, 20182025 (MILLION USD)
5.3.3 LOW COVID-19 IMPACT SCENARIO
TABLE 10 DRIVE BY WIRE MARKET (LOW COVID-19 IMPACT SCENARIO), BY REGION, 20182025 (MILLION USD)
5.4 REVENUE SHIFT DRIVING MARKET GROWTH
5.5 ECOSYSTEM
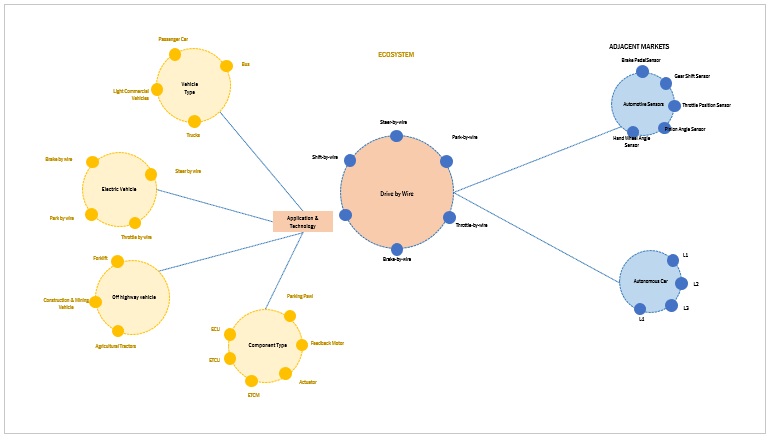
FIGURE 30 ECOSYSTEM: DRIVE BY WIRE MARKET
5.6 SUPPLY CHAIN ANALYSIS
5.7 CASE STUDY ANALYSIS
5.8 PRICING ANALYSIS
TABLE 11 DRIVE BY WIRE PRICING (USD) ANALYSIS, 2019, BY APPLICATION
6 TECHNOLOGY OVERVIEW (Page No. - 66)
6.1 INTRODUCTION
6.2 DRIVE BY WIRE: TECHNOLOGY ROADMAP
6.3 DRIVE BY WIRE: APPLICATIONS
6.3.1 THROTTLE BY WIRE
FIGURE 31 WORKING OF THROTTLE-BY-WIRE
6.3.2 SHIFT-BY-WIRE
FIGURE 32 WORKING OF SHIFT-BY-WIRE
6.3.3 BRAKE-BY-WIRE
FIGURE 33 WORKING DIFFERENCE BETWEEN ELECTRO-HYDRAULIC BRAKE AND ELECTROMECHANICAL BRAKE
6.3.4 PARK-BY-WIRE
6.3.5 STEER-BY-WIRE
FIGURE 34 WORKING OF STEER-BY-WIRE
7 DRIVE BY WIRE MARKET, BY APPLICATION (Page No. - 73)
Note: The Chapter is Further Segmented at Regional Level and Regions Considered are Asia Pacific, Europe, North America, and RoW
7.1 INTRODUCTION
7.1.1 RESEARCH METHODOLOGY
7.1.2 ASSUMPTIONS
7.1.3 INDUSTRY INSIGHTS
FIGURE 35 DRIVE BY WIRE MARKET, BY APPLICATION, 2020 VS. 2025 (USD MILLION)
TABLE 12 DRIVE BY WIRE MARKET, BY APPLICATION, 20182025 (000 UNITS)
TABLE 13 DRIVE BY WIRE MARKET, BY APPLICATION, 20182025 (USD MILLION)
7.2 BRAKE-BY-WIRE
7.2.1 BETTER FUNCTIONAL ACCURACY EXPECTED TO DRIVE DEMAND
TABLE 14 BRAKE-BY-WIRE MARKET, BY REGION, 20182025 (000 UNITS)
TABLE 15 BRAKE-BY-WIRE MARKET, BY REGION, 20182025 (USD MILLION)
7.3 PARK-BY-WIRE
7.3.1 REDUCED WEAR AND TEAR OF VEHICLES DUE TO PARK-BY-WIRE EXPECTED TO DRIVE ITS ADOPTION
TABLE 16 PARK-BY-WIRE MARKET, BY REGION, 20182025 (000 UNITS)
TABLE 17 PARK-BY-WIRE MARKET, BY REGION, 20182025 (USD MILLION)
7.4 SHIFT-BY-WIRE
7.4.1 SMOOTH GEAR SHIFTING AND REDUCED VEHICLE WIGHT EXPECTED TO DRIVE SHIFT-BY-WIRE ADOPTION
TABLE 18 SHIFT-BY-WIRE MARKET, BY REGION, 20182025 (000 UNITS)
TABLE 19 SHIFT-BY-WIRE MARKET, BY REGION, 20182025 (USD MILLION)
7.5 STEER-BY-WIRE
7.5.1 INCREASING R&D AND NEW PRODUCT DEVELOPMENTS EXPECTED TO POPULARIZE STEER-BY-WIRE
TABLE 20 STEER-BY-WIRE MARKET, BY REGION, 20182025 (000 UNITS)
TABLE 21 STEER-BY-WIRE MARKET, BY REGION, 20182025 (USD MILLION)
7.6 THROTTLE-BY-WIRE
7.6.1 IMPLEMENTATION OF STRINGENT EMISSION NORMS EXPECTED TO DRIVE ADOPTION OF THROTTLE-BY-WIRE
TABLE 22 THROTTLE-BY-WIRE MARKET, BY REGION, 20182025 (000 UNITS)
TABLE 23 THROTTLE-BY-WIRE MARKET, BY REGION, 20182025 (USD MILLION)
8 DRIVE BY WIRE MARKET, BY SENSOR TYPE (Page No. - 82)
Note: The Chapter is Further Segmented at Regional Level and Regions Considered are Asia Pacific, Europe, North America, and RoW
8.1 INTRODUCTION
8.1.1 RESEARCH METHODOLOGY
8.1.2 ASSUMPTIONS
8.1.3 INDUSTRY INSIGHTS
TABLE 24 NUMBER OF SENSORS USED PER DRIVE BY WIRE APPLICATION
FIGURE 36 DRIVE BY WIRE MARKET, BY SENSOR TYPE, 2020 VS. 2025 (USD MILLION)
TABLE 25 DRIVE BY WIRE MARKET, BY SENSOR TYPE, 20182025 (000 UNITS)
TABLE 26 DRIVE BY WIRE MARKET, BY SENSOR TYPE, 20182025 (USD MILLION)
8.2 BRAKE PEDAL SENSOR
8.2.1 INCREASING DEMAND FOR SAFETY AND COMFORT EXPECTED TO DRIVE THE SEGMENT
TABLE 27 BRAKE PEDAL SENSOR MARKET, BY REGION, 20182025 (000 UNITS)
TABLE 28 BRAKE PEDAL SENSOR MARKET, BY REGION, 20182025 (USD MILLION)
8.3 HANDWHEEL ANGLE SENSOR
8.3.1 ENHANCED SAFETY AND OPERATIONAL ACCURACY EXPECTED TO DRIVE THE SEGMENT
TABLE 29 HANDWHEEL ANGLE SENSOR MARKET, BY REGION, 20182025 (000 UNITS)
TABLE 30 HANDWHEEL ANGLE SENSOR MARKET, BY REGION, 20182025 (USD MILLION)
8.4 GEAR SHIFT POSITION SENSOR
8.4.1 BENEFITS LIKE REDUCED WEAR AND TEAR AND INCREASED VEHICLE LIFESPAN EXPECTED TO DRIVE THE SEGMENT
TABLE 31 GEAR SHIFT POSITION SENSOR MARKET, BY REGION, 20182025 (000 UNITS)
TABLE 32 GEAR SHIFT POSITION SENSOR MARKET, BY REGION, 20182025 (USD MILLION)
8.5 PINION ANGLE SENSOR
8.5.1 INCREASING ADOPTION OF STEER-BY-WIRE EXPECTED TO DRIVE THE SEGMENT
TABLE 33 PINION ANGLE SENSOR MARKET, BY REGION, 20182025 (000 UNITS)
TABLE 34 PINION ANGLE SENSOR MARKET, BY REGION, 20182025 (USD MILLION)
8.6 PARK SENSOR
8.6.1 EASY AND EFFORTLESS PARKING BENEFIT TO DRIVE ADOPTION
TABLE 35 PARK SENSOR MARKET, BY REGION, 20182025 (000 UNITS)
TABLE 36 PARK SENSOR MARKET, BY REGION, 20182025 (USD MILLION)
8.7 THROTTLE PEDAL SENSOR
8.7.1 BENEFITS LIKE OPERATIONAL ACCURACY EXPECTED TO DRIVE THE SEGMENT
TABLE 37 THROTTLE PEDAL SENSOR MARKET, BY REGION, 20182025 (000 UNITS)
TABLE 38 THROTTLE PEDAL SENSOR MARKET, BY REGION, 20182025 (USD MILLION)
8.8 THROTTLE POSITION SENSOR
8.8.1 INCREASING POPULARITY OF THROTTLE-BY-WIRE EXPECTED TO DRIVE ADOPTION
TABLE 39 THROTTLE POSITION SENSOR MARKET, BY REGION, 20182025 (000 UNITS)
TABLE 40 THROTTLE POSITION SENSOR MARKET, BY REGION, 20182025 (USD MILLION)
9 DRIVE BY WIRE MARKET, BY COMPONENT (Page No. - 93)
Note: The Chapter is Further Segmented at Regional Level and Regions Considered are Asia Pacific, Europe, North America, and RoW
9.1 INTRODUCTION
9.1.1 RESEARCH METHODOLOGY
9.1.2 ASSUMPTIONS
9.1.3 INDUSTRY INSIGHTS
TABLE 41 DRIVE BY WIRE APPLICATION VS AVERAGE NUMBER OF COMPONENTS USED PER APPLICATION
FIGURE 37 DRIVE BY WIRE MARKET, BY COMPONENT, 2020 VS. 2025 (USD MILLION)
TABLE 42 DRIVE BY WIRE MARKET, BY COMPONENT, 20182025 (000 UNITS)
TABLE 43 DRIVE BY WIRE MARKET, BY COMPONENT, 20182025 (USD MILLION)
9.2 ACTUATOR
9.2.1 INCREASING POPULARITY OF PREMIUM VEHICLES EXPECTED TO DRIVE THE SEGMENT
TABLE 44 ACTUATOR MARKET, BY REGION, 20182025 (000 UNITS)
TABLE 45 ACTUATOR MARKET, BY REGION, 20182025 (USD MILLION)
9.3 ELECTRONIC CONTROL UNIT (ECU)
9.3.1 IMPROVED FUEL ECONOMY AND ACCURACY EXPECTED TO DRIVE THE SEGMENT
TABLE 46 ECU MARKET, BY REGION, 20182025 (000 UNITS)
TABLE 47 ECU MARKET, BY REGION, 20182025 (USD MILLION)
9.4 ENGINE CONTROL MODULE (ECM)
9.4.1 BENEFITS SUCH AS BETTER VALVE CONTROL EXPECTED TO DRIVE ECM ADOPTION
TABLE 48 ECM MARKET, BY REGION, 20182025 (000 UNITS)
TABLE 49 ECM MARKET, BY REGION, 20182025 (USD MILLION)
9.5 ELECTRONIC THROTTLE CONTROL MODULE (ETCM)
9.5.1 HIGHER ACCURACY AND PRECISION EXPECTED TO DRIVE DEMAND
TABLE 50 ETCM MARKET, BY REGION, 20182025 (000 UNITS)
TABLE 51 ETCM MARKET, BY REGION, 20182025 (USD MILLION)
9.6 ELECTRONIC TRANSMISSION CONTROL UNIT (ETCU)
9.6.1 GROWING ADOPTION OF AUTOMATIC TRANSMISSION EXPECTED TO DRIVE THE SEGMENT
TABLE 52 ETCU MARKET, BY REGION, 20182025 (000 UNITS)
TABLE 53 ETCU MARKET, BY REGION, 20182025 (USD MILLION)
9.7 FEEDBACK MOTOR
9.7.1 LOW MAINTENANCE AND HIGH EFFICIENCY EXPECTED TO DRIVE ADOPTION
TABLE 54 FEEDBACK MOTOR MARKET, BY REGION, 20182025 (000 UNITS)
TABLE 55 FEEDBACK MOTOR MARKET, BY REGION, 20182025 (USD MILLION)
9.8 PARKING PAWL
9.8.1 BETTER TRACTION CONTROL EXPECTED TO DRIVE THE SEGMENT
TABLE 56 PARKING PAWL MARKET, BY REGION, 20182025 (000 UNITS)
TABLE 57 PARKING PAWL MARKET, BY REGION, 20182025 (USD MILLION)
10 DRIVE BY WIRE MARKET, BY ON-HIGHWAY VEHICLE (Page No. - 104)
Note: The Chapter is Further Segmented at Regional Level and Regions Considered are Asia Pacific, Europe, North America, and RoW
10.1 INTRODUCTION
10.1.1 RESEARCH METHODOLOGY
10.1.2 ASSUMPTIONS
10.1.3 INDUSTRY INSIGHTS
FIGURE 38 DRIVE BY WIRE MARKET, BY ON-HIGHWAY VEHICLE, 2020 VS. 2025 (USD MILLION)
TABLE 58 DRIVE BY WIRE MARKET, BY VEHICLE TYPE, 20182025 (000 UNITS)
TABLE 59 DRIVE BY WIRE MARKET, BY VEHICLE TYPE, 20182025 (USD MILLION)
10.2 PASSENGER CAR
10.2.1 POPULARITY OF PREMIUM CARS EXPECTED TO DRIVE THE MARKET
TABLE 60 PASSENGER CAR: DRIVE BY WIRE MARKET, BY REGION, 20182025 (000 UNITS)
TABLE 61 PASSENGER CAR: DRIVE BY WIRE MARKET, BY REGION, 20182025 (USD MILLION)
10.3 LIGHT COMMERCIAL VEHICLE (LCV)
10.3.1 POPULARITY OF AUTOMATIC TRANSMISSION EXPECTED TO DRIVE THE MARKET
TABLE 62 LCV: DRIVE BY WIRE MARKET, BY REGION, 20182025 (000 UNITS)
TABLE 63 LCV: DRIVE BY WIRE MARKET, BY REGION, 20182025 (USD MILLION)
10.4 TRUCK
10.4.1 POPULARITY OF THROTTLE-BY-WIRE IN TRUCKS EXPECTED TO DRIVE THE MARKET
TABLE 64 TRUCK: DRIVE BY WIRE MARKET, BY REGION, 20182025 (000 UNITS)
TABLE 65 TRUCK: DRIVE BY WIRE MARKET, BY REGION, 20182025 (USD MILLION)
10.5 BUS
10.5.1 INCREASED ADOPTION OF SHIFT-BY-WIRE EXPECTED TO DRIVE THE MARKET
TABLE 66 BUS: DRIVE BY WIRE MARKET, BY REGION, 20182025 (000 UNITS)
TABLE 67 BUS: DRIVE BY WIRE MARKET, BY REGION, 20182025 (USD MILLION)
11 DRIVE BY WIRE MARKET, BY ELECTRIC & HYBRID VEHICLE (Page No. - 111)
Note: The Chapter is Further Segmented at Regional Level and Regions Considered are Asia Pacific, Europe, North America
11.1 INTRODUCTION
11.1.1 RESEARCH METHODOLOGY
11.1.2 ASSUMPTIONS
11.1.3 INDUSTRY INSIGHTS
FIGURE 39 DRIVE BY WIRE MARKET, BY ELECTRIC & HYBRID VEHICLE, 2020 VS. 2025 (USD MILLION)
TABLE 68 DRIVE BY WIRE MARKET, BY ELECTRIC & HYBRID VEHICLE TYPE, 20182025 (000 UNITS)
TABLE 69 DRIVE BY WIRE MARKET, BY ELECTRIC & HYBRID VEHICLE TYPE, 20182025 (USD MILLION)
11.2 BATTERY ELECTRIC VEHICLE (BEV)
11.2.1 ATTRACTIVE GOVERNMENT INITIATIVES TO DRIVE BEV SALES
TABLE 70 BEV: DRIVE BY WIRE MARKET, BY REGION, 20182025 (000 UNITS)
TABLE 71 BEV: DRIVE BY WIRE MARKET, BY REGION, 20182025 (USD MILLION)
11.3 PLUG-IN HYBRID ELECTRIC VEHICLE (PHEV)
11.3.1 BENEFITS LIKE VEHICLE WEIGHT REDUCTION EXPECTED TO DRIVE THE SEGMENT
TABLE 72 PHEV: DRIVE BY WIRE MARKET, BY REGION, 20182025 (000 UNITS)
TABLE 73 PHEV: DRIVE BY WIRE MARKET, BY REGION, 20182025 (USD MILLION)
11.4 FUEL-CELL ELECTRIC VEHICLE (FCEV)
11.4.1 DEVELOPMENTS IN FCEV DRIVE BY WIRE COMPONENTS EXPECTED TO DRIVE THE SEGMENT
TABLE 74 FCEV: DRIVE BY WIRE MARKET, BY REGION, 20182025 (000 UNITS)
TABLE 75 FCEV: DRIVE BY WIRE MARKET, BY REGION, 20182025 (USD MILLION)
12 DRIVE BY WIRE MARKET, BY OFF-HIGHWAY VEHICLE (Page No. - 117)
Note: The Chapter is Further Segmented at Regional Level and Regions Considered are Asia Pacific, Europe, North America, and RoW
12.1 INTRODUCTION
12.1.1 RESEARCH METHODOLOGY
12.1.2 ASSUMPTIONS
12.1.3 INDUSTRY INSIGHTS
FIGURE 40 DRIVE BY WIRE MARKET, BY OFF-HIGHWAY VEHICLE, 2020 VS. 2025 (USD MILLION)
TABLE 76 DRIVE BY WIRE MARKET, BY OFF-HIGHWAY VEHICLE TYPE, 20182025 ('000 UNITS)
TABLE 77 DRIVE BY WIRE MARKET, BY OFF-HIGHWAY VEHICLE TYPE, 20182025 (USD MILLION)
12.2 AGRICULTURE TRACTORS
12.2.1 DEVELOPMENT OF INTELLIGENT TECHNOLOGIES EXPECTED TO DRIVE THE SEGMENT
TABLE 78 AGRICULTURE TRACTORS: DRIVE BY WIRE MARKET, BY REGION, 20182025 ('000 UNITS)
TABLE 79 AGRICULTURE TRACTORS: DRIVE BY WIRE MARKET, BY REGION, 20182025 (USD MILLION)
12.3 CONSTRUCTION & MINING EQUIPMENT
12.3.1 INCREASED FUEL ECONOMY OF AUTONOMOUS EQUIPMENT EXPECTED TO DRIVE DEMAND
TABLE 80 CONSTRUCTION & MINING EQUIPMENT: DRIVE BY WIRE MARKET, BY REGION, 20182025 ('000 UNITS)
TABLE 81 CONSTRUCTION & MINING EQUIPMENT: DRIVE BY WIRE MARKET, BY REGION, 20182025 (USD MILLION)
12.4 FORKLIFT
12.4.1 INCREASING NUMBER OF SMALL BUSINESS AND GROWTH OF ECOMMERCE TO DRIVE THE MARKET
TABLE 82 FORKLIFT: DRIVE BY WIRE MARKET, BY REGION, 20182025 ('000 UNITS)
TABLE 83 FORKLIFT: DRIVE BY WIRE MARKET, BY REGION, 20182025 (USD MILLION)
13 AUTONOMOUS VEHICLE DRIVE BY WIRE MARKET, BY APPLICATION (Page No. - 124)
Note: The Chapter is Further Segment by Application and Application Considered are Brake-by-wire, Park-by-wire, Shift-by-Wire, Steer-by-wire and Throttle-by-wire
13.1 INTRODUCTION
13.1.1 RESEARCH METHODOLOGY
13.1.2 ASSUMPTIONS
13.1.3 INDUSTRY INSIGHTS
FIGURE 41 AUTONOMOUS VEHICLE DRIVE BY WIRE MARKET, BY REGION, 2025 VS. 2030 (USD MILLION)
TABLE 84 AUTONOMOUS VEHICLE: DRIVE BY WIRE MARKET, BY REGION, 20252030 ('000 UNITS)
TABLE 85 AUTONOMOUS VEHICLE: DRIVE BY WIRE MARKET, BY REGION, 20252030 (USD MILLION)
13.2 BRAKE BY WIRE
13.3 PARK-BY-WIRE
13.4 SHIFT-BY-WIRE
13.5 STEER-BY-WIRE
13.6 THROTTLE-BY-WIRE
TABLE 86 AUTONOMOUS VEHICLE: DRIVE BY WIRE MARKET, BY APPLICATION, 20252030 ('000 UNITS)
TABLE 87 AUTONOMOUS VEHICLE: DRIVE BY WIRE MARKET, BY APPLICATION, 20252030 (USD MILLION)
14 DRIVE BY WIRE MARKET, BY REGION (Page No. - 130)
Note: The Chapter is Further Segmented by Application and Application Considered are Brake-by-wire, Park-by-wire, Shift-by-Wire, Steer-by-wire and Throttle-by-wire
14.1 INTRODUCTION
14.1.1 RESEARCH METHODOLOGY
14.1.2 ASSUMPTIONS
14.1.3 INDUSTRY INSIGHTS
TABLE 88 DRIVE BY WIRE MARKET, BY REGION, 20182025 (000 UNITS)
TABLE 89 DRIVE BY WIRE MARKET, BY REGION, 20182025 (USD MILLION)
FIGURE 42 DRIVE BY WIRE MARKET, BY REGION, 2020 VS. 2025 (USD MILLION)
14.2 ASIA PACIFIC
TABLE 90 ASIA PACIFIC: MARKET, BY COUNTRY, 20182025 (000 UNITS)
TABLE 91 ASIA PACIFIC: MARKET, BY COUNTRY, 20182025 (USD MILLION)
FIGURE 43 ASIA PACIFIC: MARKET SNAPSHOT
14.2.1 CHINA
14.2.1.1 Increasing popularity of premium vehicles to drive the market
TABLE 92 CHINA: MARKET, BY APPLICATION, 20182025 (000 UNITS)
TABLE 93 CHINA: MARKET, BY APPLICATION, 20182025 (USD MILLION)
14.2.2 INDIA
14.2.2.1 Increasing popularity of automatic transmission to drive the market
TABLE 94 INDIA: MARKET, BY APPLICATION, 20182025 (000 UNITS)
TABLE 95 INDIA: MARKET, BY APPLICATION, 20182025 (USD MILLION)
14.2.3 JAPAN
14.2.3.1 Developments by domestic manufacturers to drive the market
TABLE 96 JAPAN: MARKET, BY APPLICATION, 20182025 (000 UNITS)
TABLE 97 JAPAN: MARKET, BY APPLICATION, 20182025 (USD MILLION)
14.2.4 SOUTH KOREA
14.2.4.1 Adoption of advanced technologies to drive the market
TABLE 98 SOUTH KOREA: MARKET, BY APPLICATION, 2018-2025 (000 UNITS)
TABLE 99 SOUTH KOREA: MARKET, BY APPLICATION, 20182025 (USD MILLION)
14.2.5 THAILAND
14.2.5.1 Launch of new vehicle models to drive the market
TABLE 100 THAILAND: MARKET, BY APPLICATION, 20182025 (000 UNITS)
TABLE 101 THAILAND: MARKET, BY APPLICATION, 2018-2025 (USD MILLION)
14.2.6 REST OF ASIA PACIFIC
14.2.6.1 Rising production of passenger cars to drive the market
TABLE 102 REST OF ASIA PACIFIC: MARKET, BY APPLICATION, 20182025 (000 UNITS)
TABLE 103 REST OF ASIA PACIFIC: MARKET, BY APPLICATION, 20182025 (USD MILLION)
14.3 EUROPE
TABLE 104 EUROPE: MARKET, BY COUNTRY, 20182025 (000 UNITS)
TABLE 105 EUROPE: MARKET, BY COUNTRY, 20182025 (USD MILLION)
FIGURE 44 EUROPE: MARKET, BY COUNTRY, 2020 VS. 2025 (USD MILLION)
14.3.1 GERMANY
14.3.1.1 Increasing premium vehicle demand to drive the market
TABLE 106 GERMANY: MARKET, BY APPLICATION, 20182025 (000 UNITS)
TABLE 107 GERMANY: MARKET, BY APPLICATION, 20182025 (USD MILLION)
14.3.2 FRANCE
14.3.2.1 Shift-by-wire is expected to be the fastest market due to popularity of automatic transmission
TABLE 108 FRANCE: MARKET, BY APPLICATION, 20182025 (000 UNITS)
TABLE 109 FRANCE: MARKET, BY APPLICATION, 20182025 (USD MILLION)
14.3.3 RUSSIA
14.3.3.1 Growth of premium vehicle sales to drive the market
TABLE 110 RUSSIA: MARKET, BY APPLICATION, 20182025 (000 UNITS)
TABLE 111 RUSSIA: MARKET, BY APPLICATION, 20182025 (USD MILLION)
14.3.4 SPAIN
14.3.4.1 Popularity of luxury brands expected to drive the market
TABLE 112 SPAIN: MARKET, BY APPLICATION, 20182025 (000 UNITS)
TABLE 113 SPAIN: MARKET, BY APPLICATION, 20182025 (USD MILLION)
14.3.5 UK
14.3.5.1 Developments in steer-by-wire and brake-by-wire to drive the market
TABLE 114 UK: MARKET, BY APPLICATION, 20182025 (000 UNITS)
TABLE 115 UK: MARKET, BY APPLICATION, 20182025 (USD MILLION)
14.3.6 TURKEY
14.3.6.1 Growing presence of foreign luxury automakers to drive the market
TABLE 116 TURKEY: MARKET, BY APPLICATION, 20182025 (000 UNITS)
TABLE 117 TURKEY: MARKET, BY APPLICATION, 20182025 (USD MILLION)
14.3.7 ITALY
14.3.7.1 Growing penetration of drive by wire in passenger cars to drive the market
TABLE 118 ITALY: MARKET, BY APPLICATION, 20182025 (000 UNITS)
TABLE 119 ITALY: MARKET, BY APPLICATION, 20182025 (USD MILLION)
14.3.8 REST OF EUROPE
14.3.8.1 Throttle-by-wire is the largest market due to stringent emission norms
TABLE 120 REST OF EUROPE: MARKET, BY APPLICATION, 20182025 (000 UNITS)
TABLE 121 REST OF EUROPE: MARKET, BY APPLICATION, 20182025 (USD MILLION)
14.4 NORTH AMERICA
FIGURE 45 NORTH AMERICA: MARKET SNAPSHOT
TABLE 122 NORTH AMERICA: MARKET, BY COUNTRY, 20182025 (000 UNITS)
TABLE 123 NORTH AMERICA:MARKET, BY COUNTRY, 20182025 (USD MILLION)
14.4.1 CANADA
14.4.1.1 Demand for premium and advanced vehicles to drive the market
TABLE 124 CANADA: MARKET, BY APPLICATION, 20182025 (000 UNITS)
TABLE 125 CANADA: MARKET, BY APPLICATION, 20182025 (USD MILLION)
14.4.2 MEXICO
14.4.2.1 Trade agreements with the US to drive the market
TABLE 126 MEXICO: MARKET, BY APPLICATION, 20182025 (000 UNITS)
TABLE 127 MEXICO: MARKET, BY APPLICATION, 20182025 (USD MILLION)
14.4.3 US
14.4.3.1 Increasing number of supply contracts between manufacturers and automotive OEMs to drive the market
TABLE 128 US: MARKET, BY APPLICATION, 20182025 (000 UNITS)
TABLE 129 US: MARKET, BY APPLICATION, 20182025 (USD MILLION)
14.5 REST OF THE WORLD (ROW)
FIGURE 46 ROW: MARKET SIZE, BY COUNTRY, 2018 VS. 2025 (USD MILLION)
TABLE 130 ROW: MARKET, BY COUNTRY, 20182025 (000 UNITS)
TABLE 131 ROW: MARKET, BY COUNTRY, 20182025 (USD MILLION)
14.5.1 BRAZIL
14.5.1.1 Trade agreements with key countries to drive the market
TABLE 132 BRAZIL: MARKET, BY APPLICATION, 20182025 (000 UNITS)
TABLE 133 BRAZIL: MARKET, BY APPLICATION, 20182025 (USD MILLION)
14.5.2 IRAN
14.5.2.1 Cost-sensitive nature to lead to sluggish market growth
TABLE 134 IRAN: MARKET, BY APPLICATION, 20182025 (000 UNITS)
TABLE 135 IRAN: MARKET, BY APPLICATION, 20182025 (USD MILLION)
14.5.3 ARGENTINA
14.5.3.1 Reduced import duties to drive the market
TABLE 136 ARGENTINA: MARKET, BY APPLICATION, 20182025 (000 UNITS)
TABLE 137 ARGENTINA: MARKET, BY APPLICATION, 20182025 (USD MILLION)
14.5.4 SOUTH AFRICA
14.5.4.1 Launch of premium vehicle models to drive the market
TABLE 138 SOUTH AFRICA: MARKET, BY APPLICATION, 20182025 (000 UNITS)
TABLE 139 SOUTH AFRICA: MARKET, BY APPLICATION, 20182025 (USD MILLION)
14.5.5 REST OF ROW
14.5.5.1 Domestic initiatives to drive the market
TABLE 140 REST OF ROW: MARKET, BY APPLICATION, 20182025 (000 UNITS)
TABLE 141 REST OF ROW: MARKET, BY APPLICATION, 20182025 (USD MILLION)
15 RECOMMENDATIONS BY MARKETSANDMARKETS (Page No. - 164)
15.1 ASIA PACIFIC IS A POTENTIAL MARKET FOR DRIVE BY WIRE
15.2 COMPANIES SHOULD INCREASE FOCUS ON SHIFT-BY-WIRE APPLICATION
15.3 GROWING DEMAND OF EVS FOLLOWED BY AUTONOMOUS VEHICLES GROWTH
15.4 CONCLUSION
16 COMPETITIVE LANDSCAPE (Page No. - 166)
16.1 INTRODUCTION
16.2 COMPETITIVE LEADERSHIP MAPPING
16.2.1 STAR
16.2.2 EMERGING LEADER
16.2.3 PERVASIVE
16.2.4 PARTICIPANT
FIGURE 47 COMPETITIVE LEADERSHIP MAPPING: DRIVE BY WIRE MANUFACTURERS
16.3 STRENGTH OF PRODUCT PORTFOLIO
FIGURE 48 PRODUCT PORTFOLIO ANALYSIS OF TOP PLAYERS IN DRIVE BY WIRE MARKET
16.4 BUSINESS STRATEGY EXCELLENCE
FIGURE 49 BUSINESS STRATEGY EXCELLENCE OF TOP PLAYERS IN DRIVE BY WIRE MARKET
16.5 MARKET EVALUATION FRAMEWORK
FIGURE 50 MARKET EVALUATION FRAMEWORK: DRIVE BY WIRE MARKET
16.6 DRIVE BY WIRE: MARKET SHARE ANALYSIS
FIGURE 51 DRIVE BY WIRE MARKET SHARE, 2019
16.7 KEY PLAYER STRATEGIES/RIGHT TO WIN
FIGURE 52 COMPANIES ADOPTED NEW PRODUCT DEVELOPMENT AS THE KEY GROWTH STRATEGY, 20182020
16.8 COMPETITIVE SCENARIO
16.8.1 NEW PRODUCT DEVELOPMENT
TABLE 142 NEW PRODUCT DEVELOPMENTS
16.8.2 EXPANSION
TABLE 143 EXPANSIONS
16.8.3 JOINT VENTURE
TABLE 144 JOINT VENTURES
16.8.4 ACQUISITION/PARTNERSHIP/COLLABORATION
TABLE 145 ACQUISITIONS/PARTNERSHIPS/COLLABORATIONS
17 COMPANY PROFILES (Page No. - 178)
17.1 COMPANY PROFILES: DRIVE BY WIRE MANUFACTURERS
(Overview, Products offerings, Recent developments & MnM View)*
17.1.1 ROBERT BOSCH GMBH
FIGURE 53 ROBERT BOSCH GMBH: COMPANY SNAPSHOT
TABLE 146 ROBERT BOSCH GMBH: ORGANIC DEVELOPMENTS
TABLE 147 ROBERT BOSCH GMBH: INORGANIC DEVELOPMENTS
17.1.2 CONTINENTAL AG
FIGURE 54 CONTINENTAL AG: COMPANY SNAPSHOT
TABLE 148 CONTINENTAL AG: ORGANIC DEVELOPMENTS
TABLE 149 CONTINENTAL AG: INORGANIC DEVELOPMENTS
17.1.3 ZF FRIEDRICHSHAFEN AG
FIGURE 55 ZF FRIEDRICHSHAFEN AG: COMPANY SNAPSHOT
TABLE 150 ZF FRIEDRICHSHAFEN AG: ORGANIC DEVELOPMENTS
TABLE 151 ZF FRIEDRICHSHAFEN AG: INORGANIC DEVELOPMENTS
17.1.4 INFINEON TECHNOLOGIES AG
FIGURE 56 INFINEON TECHNOLOGIES AG: COMPANY SNAPSHOT
TABLE 152 INFINEON TECHNOLOGIES AG: ORGANIC DEVELOPMENTS
TABLE 153 INFINEON TECHNOLOGIES AG: INORGANIC DEVELOPMENTS
17.1.5 NEXTEER AUTOMOTIVE
FIGURE 57 NEXTEER AUTOMOTIVE: COMPANY SNAPSHOT
TABLE 154 NEXTEER AUTOMOTIVE: ORGANIC DEVELOPMENTS
TABLE 155 NEXTEER AUTOMOTIVE: INORGANIC DEVELOPMENTS
17.1.6 CTS CORPORATION
FIGURE 58 CTS CORPORATION: COMPANY SNAPSHOT
TABLE 156 CTS CORPORATION: ORGANIC DEVELOPMENTS
TABLE 157 CTS CORPORATION: INORGANIC DEVELOPMENTS
17.1.7 FICOSA INTERNACIONAL SA
FIGURE 59 FICOSA INTERNACIONAL SA: COMPANY SNAPSHOT
TABLE 158 FICOSA INTERNACIONAL SA: ORGANIC DEVELOPMENTS
17.1.8 KONGSBERG AUTOMOTIVE
FIGURE 60 KONGSBERG AUTOMOTIVE: COMPANY SNAPSHOT
17.1.9 HITACHI AUTOMOTIVE SYSTEMS, LTD.
FIGURE 61 HITACHI AUTOMOTIVE SYSTEMS, LTD.: COMPANY SNAPSHOT
TABLE 159 HITACHI AUTOMOTIVE SYSTEMS LTD.: ORGANIC DEVELOPMENTS
TABLE 160 HITACHI AUTOMOTIVE SYSTEMS LTD.: INORGANIC DEVELOPMENTS
17.1.10 CURTISS-WRIGHT CORPORATION
FIGURE 62 CURTISS-WRIGHT CORPORATION: COMPANY SNAPSHOT
*Details on Overview, Products offerings, Recent developments & MnM View might not be captured in case of unlisted companies.
17.2 ADDITIONAL COMPANY PROFILES
17.2.1 NORTH AMERICA
17.2.1.1 Orscheln
17.2.1.2 KSR International
17.2.1.3 LORD Corporation
17.2.1.4 Dura Automotive Systems
17.2.2 EUROPE
17.2.2.1 SKF
17.2.2.2 Aptiv
17.2.2.3 MOBIL ELECTRONIK GmbH
17.2.2.4 ThyssenKrupp AG
17.2.3 ASIA PACIFIC
17.2.3.1 Denso Corporation
17.2.3.2 Nissan Corporation
17.2.3.3 JTEKT Corporation
17.3 DRIVE BY WIRE COMPONENT SUPPLIERS
17.3.1 REE AUTOMOTIVE
17.3.2 NXP SEMICONDUCTORS NV
17.3.3 HELLA GMBH
17.3.4 S&T MOTIV CO., LTD.
17.3.5 LEM
17.3.6 ALLIED MOTION, INC.
17.3.7 SCHAEFFLER TECHNOLOGIES AG & CO. KG
17.3.8 NTN CORPORATION
17.3.9 IMMERSION CORPORATION
17.3.10 SORL AUTO PARTS, INC.
18 APPENDIX (Page No. - 207)
18.1 CURRENCY & PRICING
TABLE 161 CURRENCY EXCHANGE RATES (WRT PER USD)
18.2 INSIGHTS OF INDUSTRY EXPERTS
18.3 DISCUSSION GUIDE
18.4 KNOWLEDGE STORE: MARKETSANDMARKETS SUBSCRIPTION PORTAL
18.5 AVAILABLE CUSTOMIZATIONS
18.5.1 DRIVE BY WIRE MARKET, BY SENSOR TYPE (COUNTRY LEVEL)
18.5.1.1 Throttle pedal sensor
18.5.1.2 Throttle position sensor
18.5.1.3 Pinion angle sensor
18.5.1.4 Handwheel angle sensor
18.5.1.5 Gear shift position sensor
18.5.1.6 Brake pedal sensor
18.5.1.7 Park Sensor
18.5.2 DRIVE BY WIRE MARKET, BY COMPONENT (COUNTRY LEVEL)
18.5.2.1 ECU (Electronic control unit)
18.5.2.2 ECM (Engine control module)
18.5.2.3 Actuator
18.5.2.4 Feedback motor
18.5.2.5 ETC (Electronic throttle control module)
18.5.2.6 ETCU (Electronic transmission control unit)
18.5.2.7 Parking pawl
18.5.3 ELECTRIC & HYBRID VEHICLE DRIVE BY WIRE MARKET, BY APPLICATION (COUNTRY LEVEL)
18.5.3.1 Brake-by-wire
18.5.3.2 Park-by-wire
18.5.3.3 Shift-by-wire
18.5.3.4 Steer-by-wire
18.5.3.5 Throttle-by-wire
18.6 RELATED REPORTS
18.7 AUTHOR DETAILS
The study involved four major activities in estimating the current size of the drive by wire market. Exhaustive secondary research was done to collect information on the market, the peer market, and the parent market. The next step was to validate these findings, assumptions, and sizing with the industry experts across value chains through primary research. The bottom-up and top-down approaches were employed to estimate the complete market size. Thereafter, market breakdown and data triangulation processes were used to estimate the market size of segments and subsegments.
The secondary sources referred to for this research study include publications from government sources [such as country level automotive associations and organizations, Organisation for Economic Co-operation and Development (OECD), World Bank, CDC, and Eurostat]; corporate and regulatory filings (such as annual reports, SEC filings, investor presentations, and financial statements); business magazines and research journals; press releases; free and paid automotive databases [Organisation Internationale des Constructeurs d'Automobiles (OICA), MarkLines, etc.] and trade, business, and professional associations; among others. Trade websites, and technical articles have been used to identify and collect information useful for an extensive commercial study of the drive by wire market.
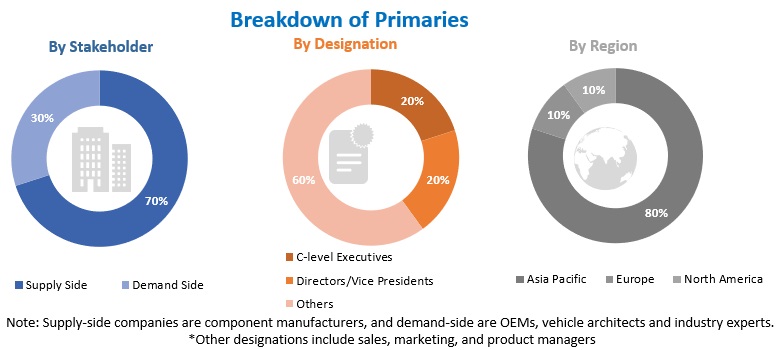
In the primary research process, various primary sources from both supply side and demand side and other stakeholders were interviewed to obtain qualitative and quantitative information on the market. Primary interviews have been conducted to gather insights such as drive by wire penetration demand by application, sensor, component, and highest potential region for the drive by wire market. The primary sources from the supply side included various industry experts, such as CXOs, vice presidents, directors from business development, marketing, product development/innovation teams, vehicle architecture expertsand related key executives from various key companies. Below is the breakdown of primary respondents:
To know about the assumptions considered for the study, download the pdf brochure
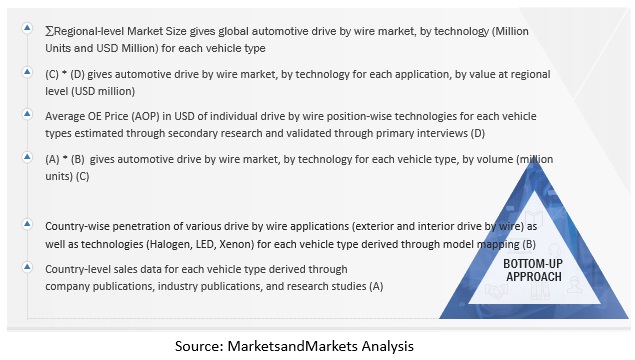
The top-down and bottom-up approaches were used to estimate and validate the size of the drive by wire market. In these approaches, the production statistics for pssaenger cars, LCVs,trucks, and buses at a country and prdduction statistics of BEVs, PHEVs, FCEVs, autonomous vehicles at regional level were considered to estimate the aggregate market of various drive by wire segments. The research methodology used to estimate the market size includes the following:
In the bottom-up approach, vehicle production of each vehicle type at the country level was considered. Penetration of each drive by wire application was derived through model mapping for each vehicle type. The country-level production by vehicle type was then multiplied with the penetration for each application to determine the market size of the drive by wire market in terms of volume. The country-level market size, in terms of volume, by application, was then multiplied with the country-level average OE Price (AOP) of each drive by wire application to determine the market size in terms of value for each vehicle type. Summation of the country-level market size for each vehicle type by application, by volume and value, would give the regional-level market size. Further, the summation of the regional markets provided the drive by wire market size. The market size for vehicle type was derived from the global market.
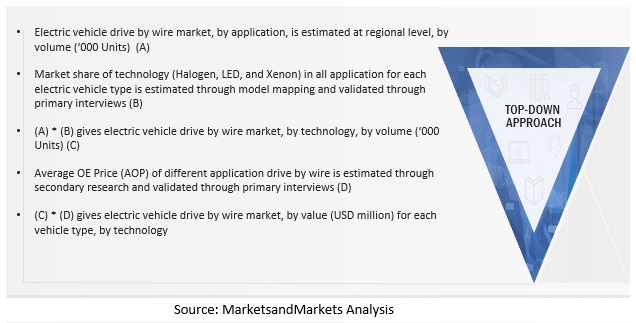
The top-down approach was used to estimate and validate the market size of the drive by wire, by sensor type, by value. To derive the market size for sensor type (000 units), the global drive by wire market (000 units) is multiplied by the average number of sensors employed in each drive by application. Drive by wire sensor market, by volume, is further multiplied with the average selling price of respective sensors, giving the drive by wire market, by value. The global market was further segmented at the regional level. A similar approach was used for deriving the market size of the component segment in terms of value.
After arriving at the overall market size of the global market through the above-mentioned methodology, this market was split into several segments and sub segments. The data triangulation and market breakdown procedure were employed, wherever applicable, to complete the overall market engineering process and arrive at the exact market value data for the key segments and sub segments. The extrapolated market data was triangulated by studying various macro indicators and regional trends from both the demand- and supply-side participants.
With the given market data, MarketsandMarkets offers customizations in accordance with the companys specific needs
Note: The Chapter is Further Segmented at Country Level, and Considered Countries are US, Canada, Mexico, Germany, UK, France, Spain, Russia, Turkey, China, India, Japan, South Korea, Brazil, Iran
Note: The Chapter is Further Segmented at Country Level, and Considered Countries are US, Canada, Mexico, Germany, UK, France, Spain, Italy, Russia, Turkey, China, India, Japan, South Korea, Brazil, Iran
Growth opportunities and latent adjacency in Drive By Wire Market
Hello is brake and steer by wire included under "Other" in this report? (see overview graph) Or do you break out separately?