Elastomeric Sealants Market by Type (PS, PU, PB, Silicone, Acrylic, SMP), End-Use Industry (Construction, Automotive & Transportation, Electronics, Furniture & Woodworks, Aerospace & Defense, Marine), Region - Global Forecast to 2022


[131 Pages Report] elastomeric sealants market was valued at USD 3.55 Billion in 2016 and is projected to reach USD 5.19 Billion by 2022, at a CAGR of 6.6% during the forecast period from 2017 to 2022. The elastomeric sealants market has been segmented based on type, end-use industry, and region. Based on type, the elastomeric sealants market has been segmented into Polyurethane (PU), Polybutadiene (PB), Polysulfide (PS), silicone, acrylic, Silyl Modified Polymer (SMP), and others. Based on end-use industry, the elastomeric sealants market has been segmented into construction, automotive & transportation, electronics, furniture & woodworks, aerospace & defense, marine, and others. Based on region, the elastomeric sealants market has been segmented into Asia Pacific, North America, Europe, South America, and the Middle East & Africa. The base year that has been considered for the study is 2016 and the forecast period considered is between 2017 and 2022.
Objectives of the Study:- To define, describe, and forecast the elastomeric sealants market based on type, end-use industry, and region
- To provide detailed information about key factors such as drivers, restraints, opportunities, and challenges influencing the growth of the elastomeric sealants market
- To strategically analyze micromarkets with respect to individual growth trends, future growth prospects, and contribution to the total elastomeric sealants market
- To analyze opportunities in the elastomeric sealants market for the stakeholders and provide detailed information on the competitive landscape of the market
- To strategically profile key players operating in the elastomeric sealants market and comprehensively analyze their market shares and core competencies
Both, top-down and bottom-up approaches have been used to estimate and validate the size of the elastomeric sealants market and estimate the sizes of various other dependent submarkets. The research study that has been used, involved extensive use of secondary sources, directories, and databases such as Hoovers, Bloomberg, Factiva, the Securities and Exchange Commission (SEC), the Association of the European Adhesive & Sealant Industry (FEICA), and the American National Standards Institute (ANSI) to identify and collect information useful for this technical, market-oriented, and commercial study of the elastomeric sealants market.
To know about the assumptions considered for the study, download the pdf brochure
This study answers several questions for various market players across the value chain of products, primarily which market segments to focus on, in the next two to five years for prioritizing their efforts and investments.
Key players operating in the elastomeric sealants market include The Dow Chemical Company (US), Henkel AG (Germany), 3M Company (US), Arkema (France), and Sika AG (Switzerland), among others.
Key Target Audience:
- Manufacturers of Elastomeric Sealants
- Traders, Distributors, and Suppliers of Elastomeric Sealants
- Regional Associations of Manufacturers of Elastomeric Sealants and General Chemical Associations
- Government & Regional Agencies and Research Organizations
- Investment Research Firms
Scope of the Report:
This research report categorizes the elastomeric sealants market based on type, end-use industry, and region.
Elastomeric Sealants Market, by Type:
- Polysulfide (PS)
- Polyurethane (PU)
- Polybutadiene (PB)
- Silicone
- Acrylic
- Silyl Modified Polymer (SMP)
- Others (Epoxy and Latex Elastomeric Sealants)
Elastomeric Sealants Market, by End-use Industry:
- Construction
- Automotive & Transportation
- Electronics
- Furniture & Woodworks
- Aerospace & Defense
- Marine
- Others (Industrial Machine Assembly and Heating, Ventilation, Air Conditioning, and Refrigeration (HVACR) Industry)
Elastomeric Sealants Market, by Region:
- North America
- Asia Pacific
- Europe
- South America
- Middle East & Africa
The elastomeric sealants market has been further analyzed based on key countries of each of these regions.
Available Customizations:
With the given market data, MarketsandMarkets offers customizations according to the specific requirements of companies. The following customization options are available for the report:
Regional Analysis:
- Country-level analysis of the elastomeric sealants market
Company Information:
- Detailed analysis and profiling of additional market players
The elastomeric sealants market is projected to grow from USD 3.77 Billion in 2017 to USD 5.19 Billion by 2022, at a CAGR of 6.6% during the forecast period from 2017 to 2022. The growth of the elastomeric sealants market can be attributed to the increasing applications of elastomeric sealants in the construction industry and rising demand for automobiles and electronics products across the globe. Elastomeric sealants are increasingly used in the automotive & transportation industry due to their high durability, good adhesion, excellent flexibility, and high heat resistance. Moreover, development of lightweight electric vehicles is also driving the growth of the elastomeric sealants market across the globe. Increased consumption of elastomeric sealants in developed economies such as the US and Germany and emerging economies such as China, India, and Brazil is also leading to the growth of the elastomeric sealants market across the globe.
The elastomeric sealants market has been segmented based on type into Polybutadiene (PB), Polysulfide (PS), Polybutadiene (PB), silicone, acrylic, Silyl Modified Polymer (SMP), and others. The silicone type segment accounted for the largest share of the elastomeric sealants market in 2017, in terms of volume. The Silyl Modified Polymer (SMP) type segment of the elastomeric sealants market is projected to grow at the highest CAGR in terms of both, value and volume during the forecast period. The growth of the Silyl Modified Polymer (SMP) type segment of the elastomeric sealants market can be attributed to the increased demand for silyl modified polymer elastomeric sealants from the automotive & transportation and marine industries.
Based on end-use industry, the elastomeric sealants market has been segmented into construction, automotive & transportation, electronics, furniture & woodworks, aerospace & defense, marine, and others. The construction end-use industry segment accounted for the largest share of the elastomeric sealants market in terms of volume in 2017. This segment of the market is projected to grow at the highest CAGR during the forecast period, in terms of both, value as well as volume. The rising demand for residential and commercial infrastructures is driving the growth of the elastomeric sealants market across the globe.
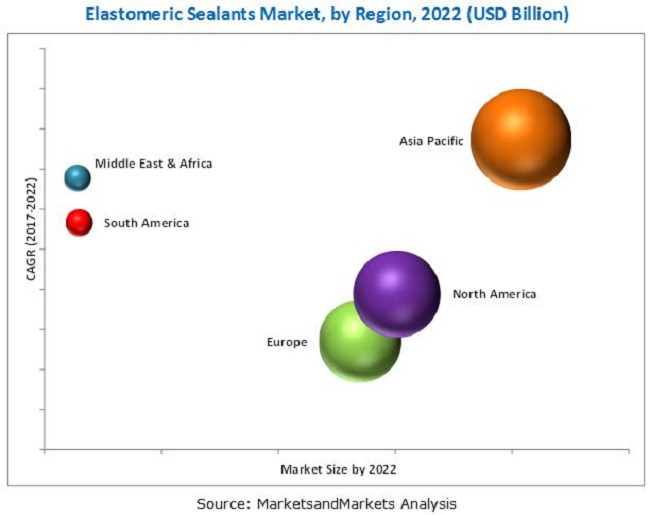
The elastomeric sealants market has been studied in Asia Pacific, North America, Europe, South America, and the Middle East & Africa. The Asia Pacific region is expected to lead the elastomeric sealants market during the forecast period. The growth of the Asia Pacific elastomeric sealants market can be attributed to the economic development taking place in different countries of the Asia Pacific region. Moreover, increased investments by private and government sectors in the construction industry of the Asia Pacific region is also fueling the growth of the elastomeric sealants market in the region. The elastomeric sealants markets in China, India, Mexico, and Brazil are also witnessing significant growth, owing to the increased consumption of electronic products and automobiles in these countries. However, growing concerns over emissions of Volatile Organic Compounds (VOCs) act as a restraint to the growth of the elastomeric sealants market across the globe.
Key players operating in the elastomeric sealants market include The Dow Chemical Company (US), Henkel AG (Germany), 3M Company (US), Arkema (France), and Sika AG (Switzerland), among others. These leading players have adopted various growth strategies such as expansions, new product launches, acquisitions, and mergers to strengthen their position in the elastomeric sealants market and widen their customer base. For instance, in 2017, The Dow Chemical Company (US) merged with DuPont (US) to form DowDuPont (US) to cater to the increased demand for elastomeric sealants from various industries. In 2016, The Dow Chemical Company (US) launched three silicone elastomeric sealants for use in various industries such as construction, automotive & transportation, and electronics, among others.
To speak to our analyst for a discussion on the above findings, click Speak to Analyst
 Exclusive indicates content/data unique to MarketsandMarkets and not available with any competitors.
Table of Contents
1 Introduction (Page No. - 13)
1.1 Objectives of the Study
1.2 Market Definition
1.3 Market Scope
1.4 Years Considered for the Study
1.5 Currency
1.6 Units Considered
1.7 Stakeholders
2 Research Methodology (Page No. - 16)
2.1 Research Data
2.1.1 Secondary Data
2.1.1.1 Key Data From Secondary Sources
2.1.2 Primary Data
2.1.2.1 Key Data From Primary Sources
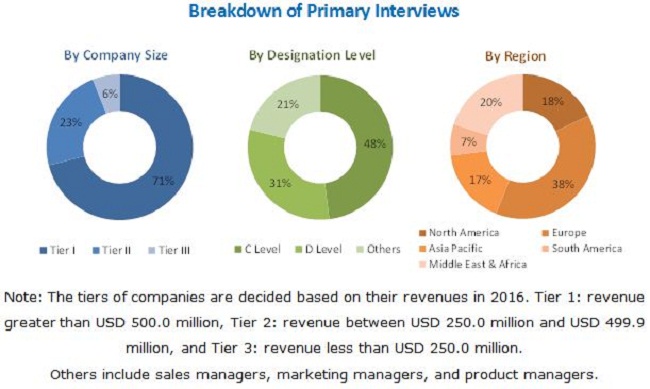
2.1.2.2 Breakdown of Primary Interviews
2.2 Market Size Estimation
2.2.1 Bottom-Up Approach
2.2.2 Top-Down Approach
2.3 Data Triangulation
2.3.1 Assumptions
2.3.2 Limitations
3 Executive Summary (Page No. - 23)
4 Premium Insights (Page No. - 27)
4.1 Significant Opportunities in the Elastomeric Sealants Market
4.2 Elastomeric Sealants Market, By End-Use Industry
4.3 Elastomeric Sealants Market in APAC, By End-Use Industry and Country, 2016
4.4 Elastomeric Sealants Market Size, By Country
5 Market Overview (Page No. - 30)
5.1 Introduction
5.2 Market Dynamics
5.2.1 Drivers
5.2.1.1 Growing Demand in Construction Industry
5.2.1.1.1 Construction Sector Recovery in Us
5.2.1.1.2 Increasing Construction Activities in Emerging Countries
5.2.1.1.3 Increasing Concerns Regarding the Use of Eco-Friendly Construction Sealants
5.2.1.2 Increasing Use of Elastomeric Sealants in Solar and Wind Power Equipment
5.2.1.3 Surging Demand for PS Elastomeric Sealants in Aerospace & Defense Industry
5.2.2 Restraints
5.2.2.1 Foam Tapes Replacing Elastomeric Sealants in Construction Industry
5.2.3 Opportunities
5.2.3.1 Growing Demand for Bio-Based and Eco-Friendly Sealants
5.2.3.2 High Growth in Automotive Industry in Emerging Countries
5.2.4 Challenges
5.2.4.1 Regulations Pertaining to Voc Content of Elastomeric Sealants
5.3 Porter�s Five Forces Analysis
5.3.1 Threat of New Entrants
5.3.2 Threat of Substitutes
5.3.3 Bargaining Power of Suppliers
5.3.4 Bargaining Power of Buyers
5.3.5 Intensity of Competitive Rivalry
6 Macroeconomic Overview (Page No. - 38)
6.1 Introduction
6.2 Trends and Forecast of GDP
6.3 Trends of Automotive Industry
6.4 Trends of Construction Industry
6.4.1 Construction Industry in North America
6.4.2 Construction Industry in Europe
6.4.3 Construction Industry in APAC
7 Elastomeric Sealants Market, By Type (Page No. - 43)
7.1 Introduction
7.2 Silicone
7.3 Polysulfide (PS)
7.4 Polyurethanes (PU)
7.5 Silyl Modified Polymers (SMP)
7.6 Polybutadiene (PB)
7.7 Others
8 Elastomeric Sealants Market, By End-Use Industry (Page No. - 48)
8.1 Introduction
8.2 Construction
8.2.1 Cladding
8.2.2 Glass Windows
8.2.3 Bridges, Roads & Highways, and Car Parking
8.2.4 Marble Work
8.2.5 Others
8.3 Automotive
8.3.1 Spot Weld Sealing
8.3.2 Water Shield Sealing
8.3.3 Windscreen
8.3.4 Frames
8.3.5 Interior and Seating Construction
8.3.6 Others
8.4 Electronics
8.4.1 Circuit Board Assembly
8.4.2 Die Attach
8.4.3 Potting and Encapsulation
8.4.4 Conformal Coating
8.4.5 Others
8.5 Furniture and Woodwork
8.5.1 Upholstery
8.5.2 Bonding
8.5.3 Others
8.6 Aerospace & Defense
8.6.1 Fay Sealing
8.6.2 Pressure Fuselage Sealing
8.6.3 Fuel Tank Sealing
8.6.4 Others
8.7 Marine
8.7.1 Deck to Hull Sealing
8.7.2 Sealing Below and Above Waterline
8.7.3 General Interior Sealing
8.7.4 Others
8.8 Others
9 Elastomeric Sealants Market, By Region (Page No. - 57)
9.1 Introduction
9.2 North America
9.2.1 US
9.2.2 Mexico
9.2.3 Canada
9.3 APAC
9.3.1 China
9.3.2 India
9.3.3 South Korea
9.3.4 Japan
9.3.5 Rest of APAC
9.4 Europe
9.4.1 Germany
9.4.2 France
9.4.3 Italy
9.4.4 UK
9.4.5 Russia
9.4.6 Rest of Europe
9.5 Middle East & Africa
9.5.1 Saudi Arabia
9.5.2 South Africa
9.5.3 Rest of Middle East & Africa
9.6 South America
9.6.1 Brazil
9.6.2 Rest of South America
10 Competitive Landscape (Page No. - 97)
10.1 Overview
10.2 Market Ranking Analysis
10.3 Competitive Situations & Trends
10.4 Contracts & Expansions
10.5 Mergers & Acquisitions
10.6 New Product Launches
11 Company Profiles (Page No. - 103)
11.1 The Dow Chemical
11.2 3M Company
11.3 Henkel
11.4 Arkema
11.5 Sika
11.6 Franklin International
11.7 H.B. Fuller
11.8 Mapei
11.9 RPM International
11.10 Wacker Chemie
11.11 Other Companies
11.11.1 DCP Int
11.11.2 Draco Construction Chemicals Inc.
11.11.3 Isomat S.A.
11.11.4 KCC Corporation
11.11.5 K�ster Bauchemie AG
11.11.6 Mageba
11.11.7 Mule-Hide Products Co. Inc.
11.11.8 PPG Industries, Inc.
11.11.9 Prodotti Industriali, S.R.L.
11.11.10 Rockwool International A/S
11.11.11 Saudi Vetonit Co. Ltd.
11.11.12 Species SA
11.11.13 The Sherwin-Williams Company
11.11.14 Torggler Chimica SPA
11.11.15 Vcm Polyurethanes Pvt. Ltd.
12 Appendix (Page No. - 123)
12.1 Insights From Industry Experts
12.2 Discussion Guide
12.3 Knowledge Store: Marketsandmarkets Subscription Portal
12.4 Introducing RT: Real-Time Market Intelligence
12.5 Related Reports
12.6 Author Details
List of Tables (72 Table)
Table 1 Trends and Forecast of GDP, 2016�2022 (USD Billion)
Table 2 Automotive Production, Million Unit (2011�2016)
Table 3 Contribution of Construction Industry to the GDP of North America, 2014�2016 (USD Billion)
Table 4 Contribution of Construction Industry to the GDP of Europe, 2014�2016 (USD Billion)
Table 5 Contribution of Construction Industry to the GDP of APAC, 2014�2016 (USD Billion)
Table 6 By Market Size, By Type, 2015�2022 (Kiloton)
Table 7 By Market Size, By Type, 2015�2022 (USD Million)
Table 8 By Market Size, By End-Use Industry, 2015�2022 (Kiloton)
Table 9 By Market Size, By End-Use Industry, 2015�2022 (USD Million)
Table 10 By Market Size, By Region, 2015�2022 (Kiloton)
Table 11 By Market Size, By Region, 2015�2022 (USD Million)
Table 12 North America: By Market Size, By Country, 2015�2022 (Kiloton)
Table 13 North America: By Market Size, By Country, 2015�2022 (USD Million)
Table 14 North America: By Market Size, By End-Use Industry, 2015�2022 (Kiloton)
Table 15 North America: By Market Size, By End-Use Industry, 2015�2022 (USD Million)
Table 16 US: By Market Size, By End-Use Industry, 2015�2022 (Kiloton)
Table 17 US: By Market Size, By End-Use Industry, 2015�2022 (USD Million)
Table 18 Mexico: By Market Size, By End-Use Industry, 2015�2022 (Kiloton)
Table 19 Mexico: By Market Size, By End-Use Industry, 2015�2022 (USD Million)
Table 20 Canada: By Market Size, By End-Use Industry, 2015�2022 (Kiloton)
Table 21 Canada: By Market Size, By End-Use Industry, 2015�2022 (USD Million)
Table 22 APAC: By Market Size, By Country, 2015�2022 (Kiloton)
Table 23 APAC: By Market Size, By Country, 2015�2022 (USD Million)
Table 24 APAC: By Market Size, By End-Use Industry, 2015�2022 (Kiloton)
Table 25 APAC: By Market Size, By End-Use Industry,2015�2022 (USD Million)
Table 26 China: By Market Size, By End-Use Industry, 2015�2022 (Kiloton)
Table 27 China: By Market Size, By End-Use Industry, 2015�2022 (USD Million)
Table 28 India: By Market Size, By End-Use Industry, 2015�2022 (Kiloton)
Table 29 India: By Market Size, By End-Use Industry, 2015�2022 (USD Million)
Table 30 South Korea: By Market Size, By End-Use Industry, 2015�2022 (Kiloton)
Table 31 South Korea: By Market Size, By End-Use Industry, 2015�2022 (USD Million)
Table 32 Japan: By Market Size, By End-Use Industry, 2015�2022 (Kiloton)
Table 33 Japan: By Market Size, By End-Use Industry, 2015�2022 (USD Million)
Table 34 Rest of APAC: By Market Size, By End-Use Industry, 2015�2022 (Kiloton)
Table 35 Rest of APAC: By Market Size, By End-Use Industry, 2015�2022 (USD Million)
Table 36 Europe: By Market Size, By Country, 2015�2022 (Kiloton)
Table 37 Europe: By Market Size, By Country, 2015�2022 (USD Million)
Table 38 Europe: By Market Size, By End-Use Industry, 2015�2022 (Kiloton)
Table 39 Europe: By Market Size, By End-Use Industry, 2015�2022 (USD Million)
Table 40 Germany: By Market Size, By End-Use Industry, 2015�2022 (Kiloton)
Table 41 Germany: By Market Size, By End-Use Industry, 2015�2022 (USD Million)
Table 42 France: By Market Size, By End-Use Industry, 2015�2022 (Kiloton)
Table 43 France: By Market Size, By End-Use Industry, 2015�2022 (USD Million)
Table 44 Italy: By Market Size, By End-Use Industry, 2015�2022 (Kiloton)
Table 45 Italy: By Market Size, By End-Use Industry, 2015�2022 (USD Million)
Table 46 UK: By Market Size, By End-Use Industry, 2015�2022 (Kiloton)
Table 47 UK: By Market Size, By End-Use Industry, 2015�2022 (USD Million)
Table 48 Russia: By Market Size, By End-Use Industry, 2015�2022 (Kiloton)
Table 49 Russia: By Market Size, By End-Use Industry, 2015�2022 (USD Million)
Table 50 Rest of Europe: By Market Size, By End-Use Industry, 2015�2022 (Kiloton)
Table 51 Rest of Europe: By Market Size, By End-Use Industry, 2015�2022 (USD Million)
Table 52 Middle East & Africa: By Market Size, By Country, 2015�2022 (Kiloton)
Table 53 Middle East & Africa: By Market Size, By Country, 2015�2022 (USD Million)
Table 54 Middle East & Africa: By Market Size, By End-Use Industry, 2015�2022 (Kiloton)
Table 55 Middle East & Africa: By Market Size, By End-Use Industry, 2015�2022 (USD Million)
Table 56 Saudi Arabia: By Market Size, By End-Use Industry, 2015�2022 (Kiloton)
Table 57 Saudi Arabia: By Market Size, By End-Use Industry, 2015�2022 (USD Million)
Table 58 South Africa: By Market Size, By End-Use Industry, 2015�2022 (Kiloton)
Table 59 South Africa: By Market Size, By End-Use Industry, 2015�2022 (USD Million)
Table 60 Rest of Middle East & Africa: By Market Size, By End-Use Industry, 2015�2022 (Kiloton)
Table 61 Rest of Middle East & Africa: By Market Size, By End-Use Industry, 2015�2022 (USD Million)
Table 62 South America: By Market Size, By Country, 2015�2022 (Kiloton)
Table 63 South America: By Market Size, By Country, 2015�2022 (USD Million)
Table 64 South America: By Market Size, By End-Use Industry, 2015�2022 (Kiloton)
Table 65 South America: By Market Size, By End-Use Industry, 2015�2022 (USD Million)
Table 66 Brazil: By Market Size, By End-Use Industry, 2015�2022 (Kiloton)
Table 67 Brazil: By Market Size, By End-Use Industry, 2015�2022 (USD Million)
Table 68 Rest of South America: By Market Size, By End-Use Industry, 2015�2022 (Kiloton)
Table 69 Rest of South America: By Market Size, By End-Use Industry, 2015�2022 (USD Million)
Table 70 Contracts &N Expansions, 2015�2017
Table 71 Mergers & Acquisitions, 2015�2017
Table 72 New Product Launches, 2015�2017
List of Figures (35 Figures)
Figure 1 Elastomeric Sealants Market Segmentation
Figure 2 Elastomeric Sealants Market: Research Design
Figure 3 Market Size Estimation Methodology: Bottom-Up Approach
Figure 4 Market Size Estimation Methodology: Top-Down Approach
Figure 5 Elastomeric Sealants Market: Data Triangulation
Figure 6 Silicone Elastomeric Sealants to Lead Elastomeric Sealants Market
Figure 7 Construction to Be the Largest End-Use Industry in Elastomeric Sealants Market
Figure 8 Elastomeric Sealants Market Size, By Country, 2016 (USD Million)
Figure 9 Elastomeric Sealants Market Share, By Region, 2016
Figure 10 Construction Industry to Dominate Elastomeric Sealants Market
Figure 11 Construction to Be the Fastest-Growing Industry Between 2017 and 2022
Figure 12 China Was the Largest Market in APAC
Figure 13 China to Be the Largest Country Between 2017 and 2022
Figure 14 Drivers, Restraints, Opportunities, and Challenges of the Elastomeric Sealants Market
Figure 15 Trends and Forecast of GDP, 2017�2022 (USD Billion)
Figure 16 Automotive Production in Key Countries, Million Unit (2015 vs. 2016)
Figure 17 Silicone Elastomeric Sealants to Account for the Largest Market Share
Figure 18 Construction Industry to Dominate the Elastomeric Sealants Market
Figure 19 India, China, and Brazil to Be the Emerging Markets for Elastomeric Sealants Between 2017 and 2022
Figure 20 North American Elastomeric Sealants Market Snapshot
Figure 21 APAC Elastomeric Sealants Market Snapshot
Figure 22 European Elastomeric Sealants Market Snapshot
Figure 23 Construction Industry to Dominate Elastomeric Sealants Market in the Middle East & Africa
Figure 24 Construction Industry Dominates Elastomeric Sealants Market in South America
Figure 25 Companies Adopted Contracts, Expansions, Agreements, Joint Ventures & Investments as the Key Development Strategy, 2015�2017
Figure 26 Market Ranking Analysis of Key Players
Figure 27 Dow: Company Snapshot
Figure 28 3M: Company Snapshot
Figure 29 Henkel: Company Snapshot
Figure 30 Arkema: Company Snapshot
Figure 31 Sika: Company Snapshot
Figure 32 H.B. Fuller: Company Snapshot
Figure 33 Mapei: Company Snapshot
Figure 34 RPM International: Company Snapshot
Figure 35 Wacker Chemie: Company Snapshot


Growth opportunities and latent adjacency in Elastomeric Sealants Market