Energy Efficient Glass Market by Coating (Hard Coat, Soft Coat), Glazing (Single Glazing, Double Glazing, Triple Glazing), Application (Building & Construction, Automotive, Solar Panel), and Region - Global Forecast to 2023


The energy efficient glass market is projected to reach USD 32.02 billion by 2023, at a CAGR of 5.0%. In this report, 2017 has been considered as the base year and the forecast period is considered between 2018 and 2023.
Energy Efficient Glass Market Objectives of this Study are
- To define, describe, and forecast the size of the energy efficient glass market, in terms of value
- To provide detailed information about the major factors (drivers, restraints, opportunities, and challenges) influencing the market growth
- To analyze the market segmentation on the basis of coating into hard coat and soft coat
- To analyze the market segmentation on the basis of glazing into single glazing, double glazing, and triple glazing
- To analyze the market segmentation on the basis of end-use industry into building & construction, automotive, and solar panel
- To forecast the energy efficiency glass market with respect to key regions, namely, Asia Pacific (APAC), Europe, North America, the Middle East & Africa, and South America
- To strategically analyze the market with respect to individual growth trends, prospects, and contribution to the total market
- To analyze competitive developments such as new product launch and expansion in the energy efficient glass market
- To strategically identify and profile the key market players and analyze their core competencies in the market
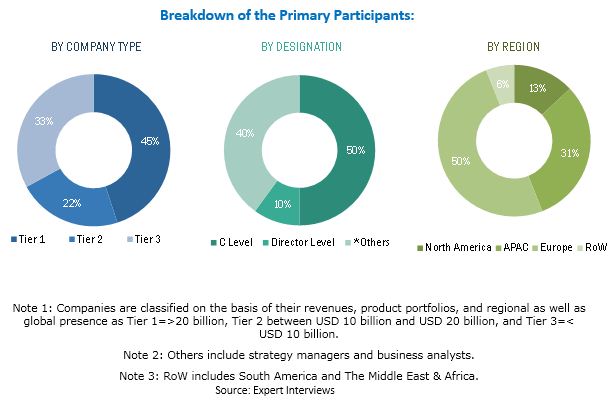
This research study involves the extensive use of secondary sources, directories, and databases such as Hoovers, Bloomberg BusinessWeek, and Factiva to identify and collect information useful for this technical, market-oriented, and commercial study of the energy efficiency glass market. Primary sources that have been considered mainly include several industry experts from the core and related industries and preferred suppliers, manufacturers, distributors, service providers, and organizations related to all the segments of the industry’s supply chain. After arriving at the overall market size, the total market has been split into several segments and subsegments. The figure below illustrates the breakdown of primary interviews based on company type, designation, and region conducted during this research study on the energy efficient glass market.
To know about the assumptions considered for the study, download the pdf brochure
Saint-Gobain S.A. (France), Nippon Sheet Glass Co., Ltd. (Japan), AGC Inc. (Japan), SCHOTT AG (Germany), Guardian Glass, LLC. (US), Sisecam Group (Turkey), and Vitro Architectural Glass (US) are key players operating in the energy efficient glass market.
Target Audiences in Energy Efficient Glass Market
- Raw material suppliers
- Energy efficient glass manufacturers
- Energy efficient glass traders, distributors, and suppliers
- Energy efficient glass technology providers
- End-use industry participants of energy efficient glass
- Government and research organizations
- Associations and industrial bodies
- Research and consulting firms
“This study answers several questions for stakeholders, primarily, which market segments they need to focus on during the next two to five years to prioritize their efforts and investments.”
Energy Efficient Glass Market Report Scope
This report categorizes the energy efficient glass market on the basis of coating, glazing, end-use industry, and region.
Energy Efficient Glass Market, by Coating:
- Hard Coat
- Soft Coat
Energy Efficient Glass Market, by Glazing:
- Single Glazing
- Double Glazing
- Triple Glazing
Energy Efficiency Glass Market, by End-use Industry:
- Building & Construction
- Automotive
- Solar Panel
- Others
Energy Efficient Glass Market, by Region:
- APAC
- North America
- Europe
- South America
- Middle East & Africa
Energy Efficient Glass Market Report Available Customizations
With the given market data, MarketsandMarkets offers customizations according to the specific needs of companies. The following customization options are available for the report:
Energy Efficient Glass Market Regional Analysis
- Further breakdown of a region to the country level with additional end-use industries and/or types of coating or glazing and their subsegments
Energy Efficient Glass Market Country Information
- Additional country information (up to 3)
Energy Efficient Glass Market Company Information
- Detailed analysis and profiles of additional market players (up to 5)
The global energy efficient glass market is estimated to be USD 25.11 billion in 2018 and is projected to reach USD 32.02 billion by 2023, at a CAGR of 5.0% between 2018 and 2023. The increased demand for energy efficient glass in the building & construction, automotive, and solar panel industries is expected to drive the energy efficient glass market.
The energy efficiency glass market has been segmented on the basis of coating into hard coat and soft coat. The hard coated energy efficiency glass market is projected to register the highest CAGR during the forecast period. This high growth is attributed to its low emissivity, durability, and easy availability for installation.
On the basis of glazing, the energy efficient glass market has been segmented into single glazing, double glazing, and triple glazing. The triple glazing energy efficiency glass market is projected to register the highest CAGR during the forecast period. The high growth of the segment is attributed to building contractors shifting to triple glazing energy efficient glass from double glazing energy efficient glass, due to its excellent low emission properties.
On the basis of end-use industry, the energy efficiency glass market has been segmented into building & construction, automotive, solar panel, and others. The market in the building & construction end-use industry is projected to register the highest CAGR during the forecast period. This high growth is attributed to the growing construction activities in emerging countries of APAC due to the growing population as well as the increasing urbanization.
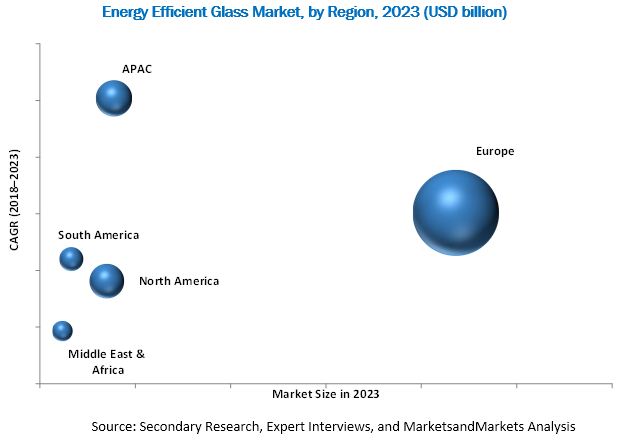
APAC is the largest energy efficient glass market, which is projected to register the highest CAGR between 2018 and 2023. The increasing disposable income, growing wealth, and rising urbanization and population growth have led to industrial growth in the region. Several government initiatives such as FDI have also encouraged international companies to build production units in the region. Hence, APAC has emerged as a manufacturing hub for automotive, appliances, and building & construction products. All these factors are expected to fuel the consumption of energy efficient glass in various end-use industries.
The major factors challenging the growth of the energy efficient glass market include lack of access to raw materials, promotion of recycling, and management of chemicals in the most responsible manner.
Key Players in Energy Efficient Glass Market
Companies such as Saint-Gobain S.A. (France), Nippon Sheet Glass Co., Ltd. (Japan), AGC Inc. (Japan), SCHOTT AG (Germany), Guardian Glass, LLC. (US), Sisecam Group (Turkey), and Vitro Architectural Glass (US) are the leading players in the energy efficient glass market, globally. Diversified product portfolio, high depth in application reach, and technical assistance to customers are factors responsible for strengthening the position of these companies in the energy efficient glass market. They have also been adopting various organic growth strategies such as new product launch and expansion to enhance their current scenario in the energy efficiency glass market.
Frequently Asked Questions (FAQ):
How big is the Energy Efficient Glass Market industry?
The global energy efficient glass market is estimated to be USD 25.11 billion in 2018 and is projected to reach USD 32.02 billion by 2023, at a CAGR of 5.0% between 2018 and 2023.
Who leading market players in Energy Efficient Glass industry?
Saint-Gobain S.A. (France), Nippon Sheet Glass Co., Ltd. (Japan), AGC Inc. (Japan), SCHOTT AG (Germany), Guardian Glass, LLC. (US), Sisecam Group (Turkey), and Vitro Architectural Glass (US) are the leading energy efficient glass manufacturers, globally.
To speak to our analyst for a discussion on the above findings, click Speak to Analyst
 Exclusive indicates content/data unique to MarketsandMarkets and not available with any competitors.
Table of Contents
1 Introduction (Page No. - 14)
1.1 Objectives of the Study
1.2 Market Definition
1.3 Market Scope
1.3.1 Years Considered for the Study
1.4 Currency
1.5 Limitations
1.6 Stakeholders
2 Research Methodology (Page No. - 18)
2.1 Research Data
2.1.1 Secondary Data
2.1.1.1 Key Data From Secondary Sources
2.1.2 Primary Data
2.1.2.1 Key Data From Primary Sources
2.1.2.2 Key Industry Insights
2.1.2.3 Breakdown of Primary Interviews
2.2 Market Size Estimation
2.2.1 Bottom-Up Approach
2.2.2 Top-Down Approach
2.3 Data Triangulation
2.4 Assumptions
3 Executive Summary (Page No. - 24)
4 Premium Insights (Page No. - 27)
4.1 Attractive Opportunities in Energy Efficient Glass Market
4.2 Energy Efficiency Glass Market, By End-Use Industry
4.3 Energy Efficient Glass Market, By Type & By Region
4.4 Energy Efficiency Glass Market Attractiveness
5 Market Overview (Page No. - 29)
5.1 Introduction
5.2 Market Dynamics
5.2.1 Drivers
5.2.1.1 Growing Prominence of Green Buildings
5.2.2 Restraint
5.2.2.1 Lack of Access to Raw Materials, Promotion of Recycling, and Management of Chemicals in the Most Responsible Manner
5.2.3 Opportunity
5.2.3.1 Growing Building and Construction Activities in APAC
5.2.4 Challenge
5.2.4.1 Lack of Investments in Developing New Products
5.3 Porter’s Five Forces Analysis
5.3.1 Threat of New Entrants
5.3.2 Threat of Substitutes
5.3.3 Bargaining Power of Suppliers
5.3.4 Bargaining Power of Buyers
5.3.5 Intensity of Competitive Rivalry
6 Energy Efficient Glass Market, By Coating (Page No. - 36)
6.1 Introduction
6.2 Hard Coat
6.3 Soft Coat
7 Energy Efficiency Glass Market, By Glazing (Page No. - 40)
7.1 Introduction
7.2 Triple Glazing
7.3 Double Glazing
7.4 Single Glazing
8 Energy Efficient Glass Market, By End-Use Industry (Page No. - 45)
8.1 Introduction
8.2 Building & Construction
8.2.1 Commercial
8.2.2 Residential
8.3 Automotive
8.4 Solar Panel
8.5 Others
9 Energy Efficient Glass Market, By Region (Page No. - 52)
9.1 Introduction
9.2 Europe
9.2.1 Western Europe
9.2.1.1 Germany
9.2.1.2 UK
9.2.1.3 France
9.2.1.4 Rest of Western Europe
9.2.2 Central & Eastern Europe
9.2.2.1 Russia
9.2.2.2 Turkey
9.2.2.3 Rest of Central & Eastern Europe
9.3 North America
9.3.1 US
9.3.2 Canada
9.3.3 Mexico
9.4 APAC
9.4.1 China
9.4.2 India
9.4.3 Japan
9.4.4 South Korea
9.4.5 Indonesia
9.4.6 Rest of APAC
9.5 South America
9.5.1 Brazil
9.5.2 Argentina
9.5.3 Rest of South America
9.6 Middle East & Africa
9.6.1 Saudi Arabia
9.6.2 UAE
9.6.3 Rest of Middle East & Africa
10 Competitive Landscape (Page No. - 78)
10.1 Overview
10.2 Market Ranking Analysis
10.3 Competitive Scenario
10.3.1 Expansion
10.3.2 New Product Launch
11 Company Profiles (Page No. - 81)
(Business Overview, Products Offered, Recent Developments, SWOT Analysis, and MnM View)*
11.1 Saint-Gobain
11.2 AGC
11.3 Nippon Sheet Glass
11.4 SCHOTT AG
11.5 Sisecam Group
11.6 Guardian
11.7 Vitro Architectural Glass
11.8 Morley Glass & Glazing
11.9 Kaphs S.A.
11.10 Sedak GmbH & Co. Kg
11.11 Metro Performance Glass
11.12 Other Key Players
11.12.1 CSG Holding Co., Ltd.
11.12.2 Taiwan Glass Ind Corp.
11.12.3 Abrisa Technologies
11.12.4 Bendheim
11.12.5 Central Glass Co., Ltd.
11.12.6 Gsc Glass Ltd
11.12.7 Arnold Glas
11.12.8 Fuso Glass India Pvt. Ltd
*Details on Business Overview, Products Offered, Recent Developments, SWOT Analysis, and MnM View Might Not Be Captured in Case of Unlisted Companies.
12 Appendix (Page No. - 101)
12.1 Discussion Guide
12.2 Knowledge Store: Marketsandmarkets’ Subscription Portal
12.3 Available Customizations
12.4 Related Reports
12.5 Author Details
List of Tables (57 Tables)
Table 1 Energy Efficient Glass Market Size, By Coating, 2016–2023 (USD Million)
Table 2 Hard Coated Energy Efficient Glass Market Size, By Region, 2016–2023 (USD Million)
Table 3 Soft Coated Energy Efficient Glass Market Size, By Region, 2016–2023 (USD Million)
Table 4 Energy Efficiency Glass Market Size, By Glazing, 2016–2023 (USD Million)
Table 5 Triple Glazing Energy Efficient Glass Market Size, By Region, 2016–2023 (USD Million)
Table 6 Double Glazing Energy Efficient Glass Market Size, By Region, 2016–2023 (USD Million)
Table 7 Single Glazing Energy Efficient Glass Market Size, By Region, 2016–2023 (USD Million)
Table 8 Energy Efficient Glass Market Size, By End-Use Industry, 2016–2023 (USD Million)
Table 9 Market Size in Building & Construction, By Region, 2016–2023 (USD Million)
Table 10 Market Size in Automotive, By Region, 2016–2023 (USD Million)
Table 11 Market Size in Solar Panel, By Region, 2016–2023 (USD Million)
Table 12 Market Size in Other End-Use Industries, By Region, 2016–2023 (USD Million)
Table 13 Market Size, By Region, 2016–2023 (USD Million)
Table 14 Europe: Energy Efficient Glass Market Size, By Country, 2016–2023 (USD Million)
Table 15 Europe: Market Size, By Coating, 2016–2023 (USD Million)
Table 16 Europe: Market Size, By Glazing, 2016–2023 (USD Million)
Table 17 Europe: Market Size, By End-Use Industry, 2016–2023 (USD Million)
Table 18 Germany: Energy Efficient Glass Market Size, By Glazing, 2016–2023 (USD Million)
Table 19 UK: Energy Efficient Glass Market Size, By Glazing, 2016–2023 (USD Million)
Table 20 France: Energy Efficient Glass Market Size, By Glazing, 2016–2023 (USD Million)
Table 21 Rest of Western Europe: Energy Efficient Glass Market Size, By Glazing, 2016–2023 (USD Million)
Table 22 Russia: Energy Efficient Glass Market Size, By Glazing, 2016–2023 (USD Million)
Table 23 Turkey: Energy Efficient Glass Market Size, By Glazing, 2016–2023 (USD Million)
Table 24 Rest of Central & Eastern Europe: Energy Efficiency Glass Market Size, By Glazing, 2016–2023 (USD Million)
Table 25 North America: Energy Efficient Glass Market Size, By Country, 2016–2023 (USD Million)
Table 26 North America: Market Size, By Coating, 2016–2023 (USD Million)
Table 27 North America: Market Size, By Glazing, 2016–2023 (USD Million)
Table 28 North America: Market Size, By End-Use Industry, 2016–2023 (USD Million)
Table 29 US: Energy Efficient Glass Market Size, By Glazing, 2016–2023 (USD Million)
Table 30 Canada: Energy Efficiency Glass Market Size, By Glazing, 2016–2023 (USD Million)
Table 31 Mexico: Energy Efficient Glass Market Size, By Glazing, 2016–2023 (USD Million)
Table 32 APAC: Energy Efficient Glass Market Size, By Country, 2016–2023 (USD Million)
Table 33 APAC: Market Size, By Coating, 2016–2023 (USD Million)
Table 34 APAC: Market Size, By Glazing, 2016–2023 (USD Million)
Table 35 APAC: Market Size, By End-Use Industry, 2016–2023 (USD Million)
Table 36 China: Energy Efficient Glass Market Size, By Glazing, 2016–2023 (USD Million)
Table 37 India: Energy Efficient Glass Market Size, By Glazing, 2016–2023 (USD Million)
Table 38 Japan: Energy Efficient Glass Market Size, By Glazing, 2016–2023 (USD Million)
Table 39 South Korea: Energy Efficiency Glass Market Size, By Glazing, 2016–2023 (USD Million)
Table 40 Indonesia: Energy Efficient Glass Market Size, By Glazing, 2016–2023 (USD Million)
Table 41 Rest of APAC: Energy Efficient Glass Market Size, By Glazing, 2016–2023 (USD Million)
Table 42 South America: Energy Efficient Glass Market Size, By Country, 2016–2023 (USD Million)
Table 43 South America: Market Size, By Coating, 2016–2023 (USD Million)
Table 44 South America: Market Size, By Glazing, 2016–2023 (USD Million)
Table 45 South America: Market Size, By End-Use Industry, 2016–2023 (USD Million)
Table 46 Brazil: Energy Efficiency Glass Market Size, By Glazing, 2016–2023 (USD Million)
Table 47 Argentina: Energy Efficient Glass Market Size, By Glazing, 2016–2023 (USD Million)
Table 48 Rest of South America: Energy Efficient Glass Market Size, By Glazing, 2016–2023 (USD Million)
Table 49 Middle East & Africa: Market Size, By Country, 2015–2022 (USD Million)
Table 50 Middle East & Africa: Market Size, By Coating, 2016–2023 (USD Million)
Table 51 Middle East & Africa: Market Size, By Glazing, 2016–2023 (USD Million)
Table 52 Middle East & Africa: Market Size, By End-Use Industry, 2016–2023 (USD Million)
Table 53 Saudi Arabia: Energy Efficiency Glass Market Size, By Glazing, 2016–2023 (USD Million)
Table 54 UAE: Energy Efficient Glass Market Size, By Glazing, 2016–2023 (USD Million)
Table 55 Rest of Middle East & Africa: Energy Efficient Glass Market Size, By Glazing, 2016–2023 (USD Million)
Table 56 Expansion, 2014–2017
Table 57 New Product Launch, 2014–2017
List of Figures (45 Figures)
Figure 1 Energy Efficient Glass Market Segmentation
Figure 2 Energy Efficiency Glass Market: Research Design
Figure 3 Market Size Estimation Methodology: Bottom-Up Approach
Figure 4 Market Size Estimation Methodology: Top-Down Approach
Figure 5 Energy Efficient Glass Market: Data Triangulation
Figure 6 Building & Construction to Be the Fastest-Growing End-Use Industry of Energy Efficient Glass
Figure 7 Triple Glazing Energy Efficient Glass to Be the Largest Glazing Type Segment
Figure 8 Europe Dominated the Energy Efficiency Glass Market in 2017
Figure 9 Energy Efficient Glass Market to Witness Moderate Growth During the Forecast Period
Figure 10 Building & Construction to Be the Largest End-Use Industry
Figure 11 Triple Glazing Energy Efficient Glass Accounted for the Largest Market Share in 2017
Figure 12 Energy Efficiency Glass Market to Register High Cagr in APAC Between 2018 and 2023
Figure 13 Overview of Factors Governing the Energy Efficient Glass Market
Figure 14 Porter’s Five Forces Analysis: Energy Efficient Glass Market
Figure 15 Soft Coated Energy Efficient Glass to Be the Largest Type Segment
Figure 16 APAC to Be the Largest Market of Hard Coated Energy Efficient Glass
Figure 17 Europe to Be the Largest Market of Soft Coated Energy Efficient Glass
Figure 18 Triple Glazing to Be the Largest Glazing Type in the Energy Efficient Glass Market
Figure 19 Europe to Be the Largest Market for Triple Glazing Energy Efficient Glass
Figure 20 Europe to Be the Largest Market for Double Glazing Energy Efficient Glass
Figure 21 APAC to Be the Largest Market of Single Glazing Energy Efficient Glass
Figure 22 Building & Construction to Be the Largest End-Use Industry of Energy Efficient Glass
Figure 23 Europe to Be the Largest Energy Efficient Glass Market in Building & Construction End-Use Industry
Figure 24 Europe to Be the Largest Energy Efficient Glass in Automotive End-Use Industry
Figure 25 Europe to Be the Largest Energy Efficiency Glass Market in Solar Panel
Figure 26 Europe to Be the Largest Energy Efficient Glass Market in Other End-Use Industries
Figure 27 Germany Was the Largest Consumer of Energy Efficient Glass in 2017
Figure 28 Europe: Energy Efficient Glass Market Snapshot
Figure 29 North America: Energy Efficiency Glass Market Snapshot
Figure 30 APAC: Energy Efficient Glass Market Snapshot
Figure 31 South America: Energy Efficiency Glass Market Snapshot
Figure 32 Middle East & Africa: Energy Efficient Glass Market Snapshot
Figure 33 Companies Primarily Adopted Organic Growth Strategies Between 2014 and 2017
Figure 34 Ranking of Key Market Players, 2017
Figure 35 Saint-Gobain: Company Snapshot
Figure 36 Saint-Gobain: SWOT Analysis
Figure 37 AGC: Company Snapshot
Figure 38 AGC: SWOT Analysis
Figure 39 Nippon Sheet Glass: Company Snapshot
Figure 40 Nippon Sheet Glass: SWOT Analysis
Figure 41 SCHOTT AG : Company Snapshot
Figure 42 SCHOTT AG: SWOT Analysis
Figure 43 Sisecam Group: Company Snapshot
Figure 44 Sisecam: SWOT Analysis
Figure 45 Metro Performance Glass: Company Snapshot


Growth opportunities and latent adjacency in Energy Efficient Glass Market