Enhanced Vision System Market by Technology (Infrared, Synthetic Vision Systems, GPS, Millimeter Wave Radar), Component (Sensors, Processing Units, Control Electronics, Camera, Display), Platform (Fixed, Rotary) and Region - Global Forecast to 2035


 Exclusive indicates content/data unique to MarketsandMarkets and not available with any competitors.
Table of Contents
1 Introduction (Page No. - 16)
1.1 Objectives of Study
1.2 Market Definition
1.3 Study Scope
1.3.1 Markets Covered
1.3.2 Regional Scope
1.3.3 Years Considered for the Study
1.4 Currency & Pricing
1.5 Study Limitations
1.6 Market Stakeholders
2 Research Methodology (Page No. - 20)
2.1 Research Data
2.1.1 Secondary Data
2.1.1.1 Key Data From Secondary Sources
2.1.2 Primary Data
2.1.2.1 Key Data From Primary Sources
2.1.2.2 Key Industry Insights
2.1.2.3 Breakdown of Primaries
2.2 Factor Analysis
2.2.1 Introduction
2.2.2 Demand-Side Indicators
2.2.2.1 General Aviation Safety
2.2.2.2 Operational Flexibility
2.2.3 Supply-Side Indicators
2.2.3.1 High Growth Prospects for Component Manufacturers
2.3 Market Size Estimation
2.3.1 Bottom-Up Approach
2.3.2 Top-Down Approach
2.4 Data Triangulation
2.5 Research Assumptions
3 Executive Summary (Page No. - 31)
4 Premium Insights (Page No. - 35)
4.1 Increasing Global Demand for Enhanced Vision System
4.2 Enhanced Vision Systems (EVS) Market, By Technology
4.3 Enhanced Vision Systems Market Size, By Component
4.4 Market Share and Growth Analysis, By Region
4.5 Life Cycle Analysis, By Region
5 Market Overview (Page No. - 38)
5.1 Introduction
5.2 Market Segmentation
5.2.1 By Technology
5.2.2 By Component
5.2.3 By Platform
5.2.4 By Region
5.3 Market Dynamics
5.3.1 Drivers
5.3.1.1 Improved Safety and Situational Awareness
5.3.1.2 Reliable Operations at Poor Visibility
5.3.1.3 Smaller Airports With Inadequate Infrastructure
5.3.2 Restraints
5.3.2.1 Industry Regulations
5.3.2.2 High Cost of Technology
5.3.3 Opportunities
5.3.3.1 Retrofit and Aftermarket
5.3.3.2 Standard Fit for Business Jets and Operational Efficiency for Aircraft
5.3.4 Challenges
5.3.4.1 Create Awareness of EVS Among Aircraft Operators
6 Industry Trends (Page No. - 48)
6.1 Introduction
6.2 Value Chain
6.3 Supply Chain
6.4 Advancements in Existing Technologies
6.4.1 Infrared Technologies
6.4.2 Radar Technologies
6.4.3 Wave Guide Display vs Oled Display
6.5 Emerging Technology Trends
6.5.1 Forward Looking Infrared (FLIR) Technology
6.5.2 Multispectral & Hyper Spectral Cameras
6.5.3 Multi-Sensor Technology
6.5.4 Cooled Thermal Cameras
6.6 Patent Registrations
6.7 Vision Systems for UAV
6.7.1 Intelligence Surveillance and Reconnaissance (ISR)
6.7.1.1 Intelligence
6.7.1.2 Surveillance
6.7.1.3 Reconnaissance
6.8 Combined Vision Systems
6.8.1 Enhanced Vision System (EVS)
6.8.2 Synthetic Vision Systems (SVS)
6.8.3 Synthetic Aperture Radar (SAR)
6.8.4 Milli Metric Wave Radar
7 Enhanced Vision System Market, By Technology (Page No. - 58)
7.1 Introduction
7.2 Infrared
7.3 Synthetic Vision
7.4 Global Positioning System
7.5 Millimeter Wave Radar
8 Enhanced Vision System Market, By Component (Page No. - 63)
8.1 Introduction
8.2 Displays
8.3 Cameras
8.4 Processing Unit
8.5 Sensors
8.6 Control Electronics
9 Enhanced Vision System Market, By Platform (Page No. - 68)
9.1 Introduction
9.2 Fixed Wing
9.2.1 Commercial Jets
9.2.2 Fighter Jets
9.2.3 Business Jets
9.3 Rotary Wing
9.3.1 Commercial Helicopters
9.3.2 Military Helicopters
10 Regional Analysis (Page No. - 73)
10.1 Introduction
10.2 North America
10.2.1 By Technology
10.2.2 By Component
10.2.3 By Platform
10.2.4 By Country
10.2.4.1 U.S.
10.2.4.1.1 By Technology
10.2.4.1.2 By Component
10.2.4.1.3 By Platform
10.2.4.2 Canada
10.2.4.2.1 By Technology
10.2.4.2.2 By Component
10.2.4.2.3 By Platform
10.3 Europe
10.3.1 By Technology
10.3.2 By Component
10.3.3 By Platform
10.3.4 By Country
10.3.4.1 U.K.
10.3.4.1.1 By Technology
10.3.4.1.2 By Component
10.3.4.1.3 By Platform
10.3.4.2 France
10.3.4.2.1 By Technology
10.3.4.2.2 By Component
10.3.4.2.3 By Platform
10.3.4.3 Germany
10.3.4.3.1 By Technology
10.3.4.3.2 By Component
10.3.4.3.3 By Platform
10.3.4.4 Russia
10.3.4.4.1 By Technology
10.3.4.4.2 By Component
10.3.4.4.3 By Platform
10.4 Asia-Pacific
10.4.1 By Technology
10.4.2 By Component
10.4.3 By Platform
10.4.4 By Country
10.4.4.1 China
10.4.4.1.1 By Technology
10.4.4.1.2 By Component
10.4.4.1.3 By Platform
10.4.4.2 Japan
10.4.4.2.1 By Technology
10.4.4.2.2 By Component
10.4.4.2.3 By Platform
10.4.4.3 India
10.4.4.3.1 By Technology
10.4.4.3.2 By Component
10.4.4.3.3 By Platform
10.5 Rest of the World
10.5.1 By Technology
10.5.2 By Component
10.5.3 By Platform
10.5.4 By Country
10.5.4.1 UAE
10.5.4.1.1 By Technology
10.5.4.1.2 By Component
10.5.4.1.3 By Platform
10.5.4.2 Brazil
10.5.4.2.1 By Technology
10.5.4.2.2 By Component
10.5.4.2.3 By Platform
10.5.4.3 South Africa
10.5.4.3.1 By Technology
10.5.4.3.2 By Component
10.5.4.3.3 By Platform
11 Competitive Landscape (Page No. - 109)
11.1 Overview
11.2 Market Rank Analysis, By Company
11.3 Brand Analysis
11.4 Competitive Situations & Trends
11.4.1 Contracts
11.4.2 New Product Launches
11.4.3 Acquisitions
12 Company Profiles (Page No. - 117)
(Company at A Glance, Recent Financials, Products & Services, Strategies & Insights, & Recent Developments)*
12.1 Introduction
12.2 Honeywell International, Inc.
12.3 United Technologies Corporation
12.4 L-3 Communications Holdings, Inc.
12.5 Thales Group
12.6 Elbit Systems Ltd.
12.7 Rockwell Collins, Inc.
12.8 Esterline Technologies Corporation
12.9 Astronics Corporation
12.10 MBDA
12.11 Opgal
*Details on Company at A Glance, Recent Financials, Products & Services, Strategies & Insights, & Recent Developments Might Not Be Captured in Case of Unlisted Companies.
13 Appendix (Page No. - 145)
13.1 Discussion Guide
13.2 Knowledge Store: Marketsandmarkets¡¯ Subscription Portal
13.3 Introducing RT: Real Time Market Intelligence
13.4 Available Customizations
13.5 Related Reports
13.6 Author Details
List of Tables (80 Tables)
Table 1 Market Segmentation: By Technology
Table 2 Market Segmentation: By Component
Table 3 Market Segmentation: By Platform
Table 4 Geographic Analysis of EVS Market
Table 5 Parameters and Compliance Characteristic for EVS
Table 6 Misconceptions and Comprehensions of Enhanced Vision System (EVS)
Table 7 Increasing Role of Drones for Intelligence Activities
Table 8 Micro Drone Applications
Table 9 Characteristics of Milli Meter Wave Radar (MMWR)
Table 10 EVS Market Size, By Technology, 2014-2021 (USD Million)
Table 11 Infrared Segment, By Region, 2014-2021 (USD Million)
Table 12 Synthetic Vision Segment, By Region, 2014-2021 (USD Million)
Table 13 Global Positioning System Segment, By Region, 2014-2021 (USD Million)
Table 14 Millimeter Wave Radar Segment, By Region, 2014-2021 (USD Million)
Table 15 Features of Enhanced Vision System Sensors
Table 16 EVS Market, By Component, 2014-2021 (USD Million)
Table 17 Displays Segment, By Region, 2014-2021 (USD Million)
Table 18 Cameras Segment, By Region, 2014-2021 (USD Million)
Table 19 Processing Unit Segment, By Region, 2014-2021 (USD Million)
Table 20 Sensors Segment, By Region, 2014-2021 (USD Million)
Table 21 Control Electronics Segment, By Region, 2014-2021 (USD Million)
Table 22 EVS Market Size, By Platform, 2014-2021 (USD Million)
Table 23 Fixed Wing Segment, By Region, 2014-2021 (USD Million)
Table 24 Rotary Wing Segment, By Region, 2014-2021 (USD Million)
Table 25 EVS Market Size, By Region, 2015-2021 (USD Million)
Table 26 North America: EVS Market Size, By Technology, 2014-2021 (USD Million)
Table 27 North America: EVSMarket Size, By Component, 2014-2021 (USD Million)
Table 28 North America: EVS Market Size, By Platform, 2014-2021 (USD Million)
Table 29 North America: EVS Market Size, By Country, 2014-2021 (USD Million)
Table 30 U.S.: Enhanced Vision System Industry Size, By Technology, 2014-2021 (USD Million)
Table 31 U.S.: Enhanced Vision System Industry Size, By Component, 2014-2021 (USD Billion)
Table 32 U.S.: Enhanced Vision System Industry Size, By Platform, 2014-2021 (USD Million)
Table 33 Canada: EVS Market Size, By Technology, 2014-2021 (USD Million)
Table 34 Canada: EVS Market Size, By Component, 2014-2021 (USD Million)
Table 35 Canada: EVS Market Size, By Platform, 2014-2021 (USD Million)
Table 36 Europe: EVS Market Size, By Technology, 2014-2021 (USD Million)
Table 37 Europe: EVS Market Size, By Component, 2014-2021 (USD Million)
Table 38 Europe: EVS Market Size, By Platform, 2014-2021 (USD Million)
Table 39 Europe: EVS Market Size, By Country, 2014-2021 (USD Million)
Table 40 U.K.: Market Size, By Technology, 2014-2021 (USD Million)
Table 41 U.K.: Market Size, By Application, 2014-2021 (USD Million)
Table 42 U.K.: Market Size, By Platform, 2014-2021 (USD Million)
Table 43 France: Market Size, By Technology, 2014-2021 (USD Million)
Table 44 France: Market Size, By Component, 2014-2021 (USD Thousand)
Table 45 France: Market Size, By Platform, 2014-2021 (USD Million)
Table 46 Germany: Market Size, By Technology, 2014-2021 (USD Million)
Table 47 Germany: Market Size, By Component, 2014-2021 (USD Thousand)
Table 48 Germany: Enhanced Vision System Size, By Platform, 2014-2021 (USD Million)
Table 49 Russia: Market Size, By Technology, 2014-2021 (USD Million)
Table 50 Russia: EnhancMarket Size, By Component, 2014-2021 (USD Thousand)
Table 51 Russia: Market Size, By Platform, 2014-2021 (USD Million)
Table 52 Asia-Pacific: EVS Market Size, By Technology, 2014-2021 (USD Million)
Table 53 Asia-Pacific: EVS Market Size, By Component, 2014-2021 (USD Million)
Table 54 Asia-Pacific: EVS Market Size, By Platform, 2014-2021 (USD Million)
Table 55 Asia-Pacific: EVS Market Size, By Country, 2015-2021 (USD Million)
Table 56 China: EVS Market Size, By Technology, 2014-2021 (USD Million)
Table 57 China: EVS Market Size, By Application, 2014-2021 (USD Million)
Table 58 China: EVS Market Size, By Platform, 2014-2021 (USD Million)
Table 59 Japan: EVS Market Size, By Technology, 2014-2021 (USD Million)
Table 60 Japan: EVS Market Size, By Application, 2014-2021 (USD Million)
Table 61 Japan: Market Size, By Platform, 2014-2021 (USD Million)
Table 62 India: Market Size, By Technology, 2014-2021 (USD Million)
Table 63 India: Market Size, By Application, 2014-2021 (USD Million)
Table 64 India: Market Size, By Platform, 2014-2021 (USD Million)
Table 65 Rest of the World: Market, By Technology, 2014-2021 (USD Billion)
Table 66 Rest of the World: Market, By Application, 2014-2021 (USD Million)
Table 67 Rest of the World: Market, By Platform, 2015-2021 (USD Million)
Table 68 Rest of the World: Market, By Country, 2014-2021 (USD Million)
Table 69 UAE: Market Size, By Technology, 2014-2021 (USD Billion)
Table 70 UAE: Market Size, By Component, 2014-2021 (USD Million)
Table 71 UAE: Market Size, By Platform, 2014-2021 (USD Million)
Table 72 Brazil: Market Size, By Technology, 2014-2021 (USD Million)
Table 73 Brazil: Market Size, By Component, 2014-2021 (USD Million)
Table 74 Brazil: Market Size, By Platform, 2014-2021 (USD Million)
Table 75 South Africa: Market Size, By Technology, 2014-2021 (USD Million)
Table 76 South Africa: Market Size, By Component, 2014-2021 (USD Thousand)
Table 77 South Africa: Market Size, By Platform, 2014-2021 (USD Million)
Table 78 Contracts, October 2014 - October 2016
Table 79 New Product Launches: October 2013 - November 2015
Table 80 Acquisitions: October 2016
List of Figures (55 Figures)
Figure 1 Enhanced Vision System Market: Markets Covered
Figure 2 Years Considered for the Study
Figure 3 Research Process Flow
Figure 4 Research Design
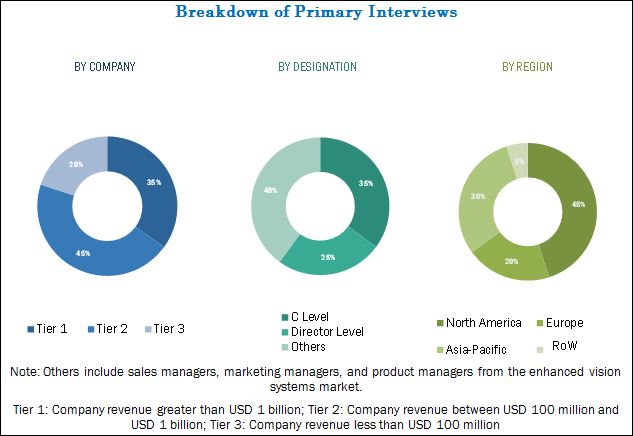
Figure 5 Breakdown of Primary Interviews: By Company Type, Designation and Region
Figure 6 Benefits of Enhanced Vision System
Figure 7 Global Air Passenger Growth (%), 2005-2015
Figure 8 Market Size Estimation Methodology: Bottom-Up Approach
Figure 9 Market Size Estimation Methodology: Top-Down Approach
Figure 10 Data Triangulation
Figure 11 Assumptions of the Research Study
Figure 12 Enhanced Vision System Market, By Region, 2016 & 2021 (USD Million)
Figure 13 The Infrared Segment Led the Enhanced Vision System Market in 2016
Figure 14 Asia-Pacific Projected to Be the Fastest-Growing Market for Enhanced Vision System During the Forecast Period
Figure 15 Contracts Was the Key Growth Strategy Adopted By Top Players, October 2014- October 2016
Figure 16 Attractive Market Opportunities in the Enhanced Vision Systems Market
Figure 17 The Infrared Segment Projected to Grow at the Highest CAGR During the Forecast Period
Figure 18 Displays Segment Projected to Be the Largest Segment By 2021
Figure 19 Enhance Vision System Market in Asia-Pacific Projected to Grow at the Highest CAGR During the Forecast Period
Figure 20 Enhanced Vision System Market: Drivers, Restraints, Opportunities & Challenges
Figure 21 Global Temperature Rise (¢ªc), 1951-2010
Figure 22 Value Chain : Enhanced Vision Systems Market
Figure 23 Supply Chain : Enhanced Vision Systems Market
Figure 24 Advancements in Existing Technologies
Figure 25 Patent Registration in Enhanced Vision Systems
Figure 26 Infrared Expected to Be the Largest Segment of the Market By 2021
Figure 27 Displays Segment Projected to Grow at the Highest CAGR During the Forecast Period
Figure 28 Fixed Wing Segment Projected to Grow at the Highest CAGR During the Forecast Period
Figure 29 Enhanced Vision System Market: Regional Snapshot, 2016-2021
Figure 30 North America: Enhanced Vision System Market Snapshot (2016)
Figure 31 Europe: Enhanced Vision System Market Snapshot (2016)
Figure 32 Asia-Pacific: Enhanced Vision System Market Snapshot (2016)
Figure 33 Rest of the World: Enhanced Vision System Market Snapshot
Figure 34 Companies Adopted Contracts as the Key Growth Strategy From October 2013 to October 2016
Figure 35 Market Rank Analysis, 2015
Figure 36 Brand Analysis: Enhanced Vision Systems Market
Figure 37 Enhanced Vision Systems Market Witnessed Significant Developments From October 2013 to October 2016
Figure 38 Contracts & Agreements is the Most Preferred Strategy Adopted By the Market Players
Figure 39 Regional Revenue Mix of Top 5 Market Players (2015)
Figure 40 Honeywell International, Inc.: Company Snapshot
Figure 41 Honeywell International, Inc.: SWOT Analysis
Figure 42 United Technologies Corporation: Company Snapshot
Figure 43 United Technologies Corporation: SWOT Analysis
Figure 44 L-3 Communications Holdings, Inc.: Company Snapshot
Figure 45 L-3 Communications Holdings, Inc.: SWOT Analysis
Figure 46 Thales Group: Company Snapshot
Figure 47 Thales Group: SWOT Analysis
Figure 48 Elbit Systems Ltd.: Company Snapshot
Figure 49 Elbit Systems Ltd.: SWOT Analysis
Figure 50 Rockwell Collins, Inc.: Company Snapshot
Figure 51 Rockwell Collins, Inc.: SWOT Analysis
Figure 52 Esterline Technologies Corporation: Company Snapshot
Figure 53 Esterline Technologies Corporation: SWOT Analysis
Figure 54 Astronics Corporation: Company Snapshot
Figure 55 Astronics Corporation: SWOT Analysis
The research methodology used to estimate and forecast the market includes study of data and revenues of key market players through secondary resources, such as annual reports, Yahoo Finance, Federal Aviation Administration (FAA), International Civil Aviation Organization (ICAO), International Air Transport Association (IATA), and Stockholm International Peace Research Institute (SIPRI). The bottom-up procedure was employed to arrive at the overall size of the enhanced vision system market from the revenue of key players in the market. After arriving at the overall market size, the market was split into several segments and subsegments, which were then verified through primary research by conducting extensive interviews with key industry experts, such as CEOs, VPs, directors, executives, and engineers. These data triangulation and market breakdown procedures were employed to complete the overall market engineering process and arrive at the exact statistics for all segments and subsegments. Breakdown of profiles of primaries is shown in the figure given below:
To know about the assumptions considered for the study, download the pdf brochure
Market Ecosystem
The ecosystem of the enhanced vision systems market comprises platform, technology, and component industries. The enhanced vision systems value chain includes component suppliers, such as Honeywell International, Inc. (U.S.), United Technologies Corporation (U.S.), L-3 Communications Holdings, Inc. (U.S.), Thales Group (France), Elbit Systems Ltd. (Israel), Rockwell Collins, Inc. (U.S.), Esterline Technologies Corporation (U.S.), and Astronics Corporation (U.S.). Dassault Falcon Jets Corp. (U.S.), Gulfstream Aerospace Corporation (U.S.), Bombardier Inc. (Canada), and Embraer SA (Brazil) are some of the aircraft manufacturers using enhanced vision systems manufactured by the various component suppliers listed above. Acquisitions and new product launches are the major strategies adopted by key players operational in the market.
Target Audience for this Report
- Manufacturers of Enhanced Vision Systems
- Original Equipment Manufacturers (OEMs)
- Sub-component Manufacturers
- Technology Support Providers
- Government and Certification Bodies
- Aircraft Manufacturer Associations
- Manufacturers of Unmanned Aerial Vehicles and Drones
¡°This study answers several questions for stakeholders, primarily, which market segments to focus on during the next two to five years for prioritizing their efforts and investments.¡±
Scope of the Report:
Enhanced Vision Systems Market, By Technology
- Infrared
- Synthetic Vision
- Global Positioning System
- Millimeter Wave Radar
Enhanced Vision Systems Market, By Component
- Sensors
- Processing Unit
- Control Electronics
- Camera
- Display
Enhanced Vision Systems Market, By Platform
- Fixed Wing
- Rotary Wing
Enhanced Vision Systems Market, By Region
- North America
- Europe
- Asia-Pacific
- Rest of the World
Available Customizations
Along with market data, MarketsandMarkets offers customizations as per specific needs of a company. The following customization options are available for this report:
-
Geographic Analysis
- Further breakdown of the Rest of the World market
-
Company Information
- Detailed analysis and profiling of additional market players (up to five)
- Additional Level Segmentation


Growth opportunities and latent adjacency in Enhanced Vision System Market