
Avionics Market Size, Share, Growth & Trends

Avionics Market Size, Share and Trends by Systems (Navigation, Payload & Mission Management, Traffic and Collision Management, Communication, Weather Detection, Power & Data management, Flight Management, Electronic Flight Display), Platform, Fit and Region - Forecast to 2030


AVIONICS MARKET SIZE, SHARE & TRENDS
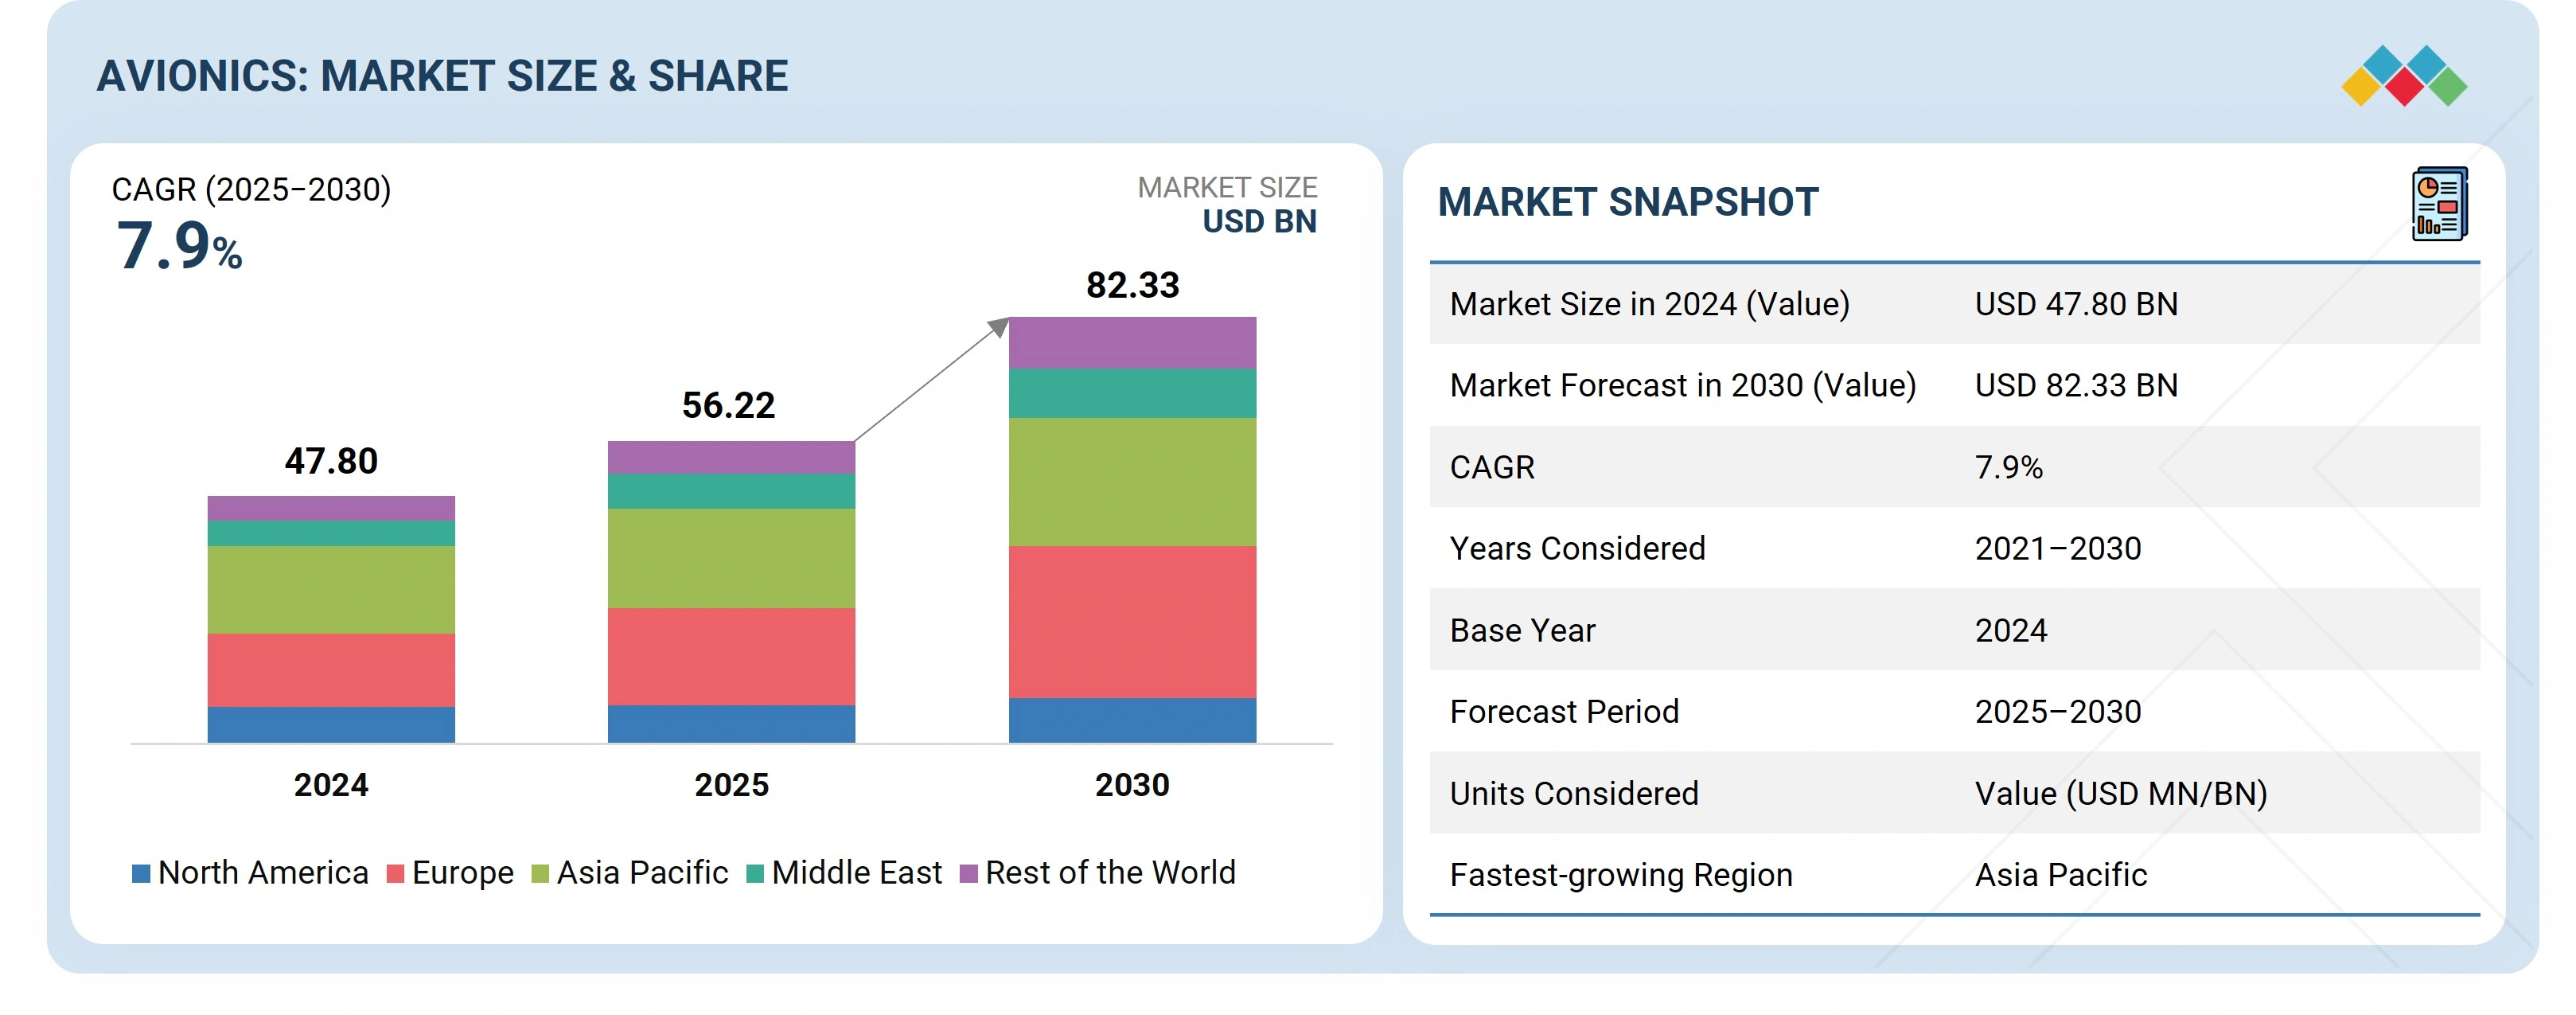
According to Marketsandmarkets, The avionics market size was valued at USD 56.22 billion in 2025 and is projected to reach USD 82.33 billion by 2030, growing at a CAGR of 7.9% from 2025 to 2030. Growth is fueled by rising demand for connected, fuel-efficient aircraft, technological advancements, and the shift toward autonomous and electric platforms, driving the need for sophisticated avionics to enhance performance and meet evolving standards.
MARKET SNAPSHOT TABLE
| REPORT METRIC | DETAILS |
|---|---|
| Market Size in 2025 (Value) | USD 56.22 Billion |
| Market Forecast in 2030 (Value) | USD 82.33 Billion |
| Growth Rate | CAGR of 7.9% from 2025-2030 |
| Years Considered | 2021-2030 |
| Base Year | 2024 |
| Forecast Period | 2025-2030 |
| Units Considered | Value (USD Million/Billion) |
| Report Coverage | Revenue forecast, company ranking, competitive landscape, growth factors, and trends. |
| Top Companies |
|
| Growth Driver |
|
| Segments Covered |
|
| Regions Covered | North America, Asia Pacific, Europe, Middle East, and Rest of the World |
Market Size & Forecast
KEY TAKEAWAYS
-
By SystemAvionics demand is led by navigation, communication, and flight management systems, driven by the need for real-time connectivity, safety, and efficient airspace use. Advanced displays, mission computers, and collision-avoidance systems are gaining traction as automation and next-generation aircraft programs grow.
-
By PlatformDemand extends across commercial, military, general, and special mission aviation, reflecting diverse needs from passenger connectivity to mission-critical situational awareness. Emerging platforms such as urban air mobility and electric aircraft are influencing avionics design toward compact, modular, and digital architectures.
-
By FitLine-fit integration supports new aircraft programs with advanced avionics suites tailored to evolving operational requirements. Retrofit programs are equally critical, addressing compliance, modernization, and performance upgrades across active fleets to extend lifecycle value and align with evolving aviation standards.
-
By RegionRegional growth in the avionics market is fueled by commercial aircraft deliveries in the Asia Pacific, defense spending in Europe, and strong business jet demand in North America, alongside broader investments in advanced and fuel-efficient avionics solutions.
-
COMPETITIVE LANDSCAPELeading players in the UAV (drone) propulsion market are strengthening their position through strategic partnerships, collaborations, and targeted investments. For instance, Heart Aerospace and Honeywell International Inc. collaborated to integrate Honeywell’s next-generation flight control system into the new ES-30 regional electric airplane.
The future growth of the avionics industry will be driven by connected and autonomous technologies, rising demand for electric and hybrid aircraft, and a focus on efficiency and safety. Fleet expansion and retrofits will sustain investments in advanced navigation, connectivity, and cybersecurity through 2030.
Source: Secondary Research, Interviews with Experts, MarketsandMarkets Analysis
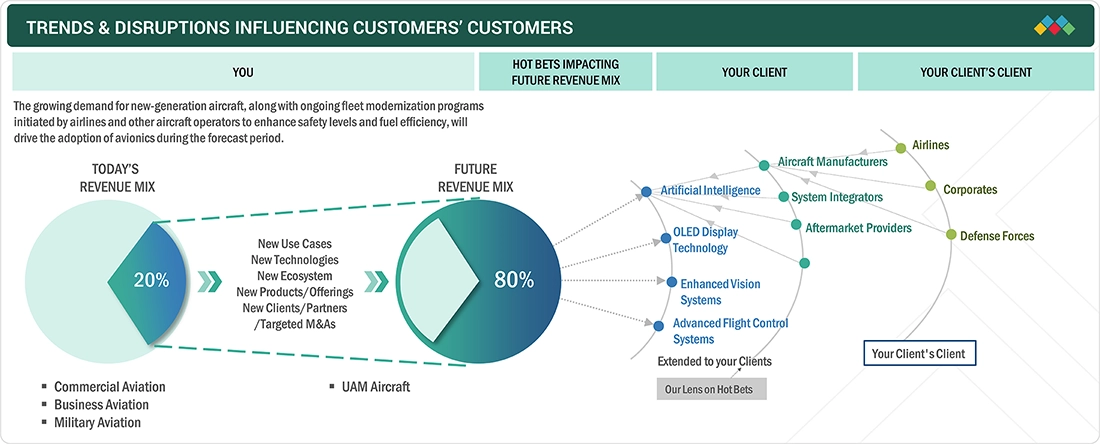
TRENDS & DISRUPTIONS IMPACTING CUSTOMERS' CUSTOMERS
The impact on the client’s business is increasingly shaped by disruptive avionics technologies, evolving regulations, and new use cases. Avionics manufacturers are focusing on AI-driven systems, OLED cockpit displays, enhanced vision, and advanced flight controls, supported by strategic partnerships and ecosystem collaborations. With commercial, business, and military aviation dominating today’s revenue mix, the rapid rise of urban air mobility is set to drive future growth, creating new opportunities across airlines, defense forces, corporate operators, and aftermarket providers.
Source: Secondary Research, Interviews with Experts, MarketsandMarkets Analysis
MARKET DYNAMICS
Level
-
Rising aircraft production

-
Growing fleet of commercial and military aircraft

Level
-
Stringent regulatory compliance

-
High development costs

Level
-
Integration of artificial intelligence in avionics systems

-
Advent of advanced connectivity solutions

Level
-
Complexity of modern avionics systems

-
Risk of technological obsolescence

Source: Secondary Research, Interviews with Experts, MarketsandMarkets Analysis
Driver: Rising aircraft production
Rising aircraft production is directly driving demand for sophisticated avionics, including navigation, communication, and safety systems. Strong delivery pipelines from OEMs and growing passenger volumes reinforce sustained investment in avionics integration.
Restraint: Stringent regulatory compliance
Complex certification processes from authorities such as the FAA and EASA extend development timelines and increase costs. This creates barriers for smaller players and compels established firms to invest heavily in compliance and validation.
Opportunity: Advent of advanced connectivity solutions
High-speed satellite links, 5G, and real-time data integration are transforming avionics. These solutions improve operational efficiency and safety while enabling new passenger experiences through connected and seamless flight operations.
Challenge: Vulnerability to cyber threats
Increasing digitalization and connectivity expose avionics to cyberattacks, from spoofing to data breaches. Mitigating these risks requires advanced encryption, continuous monitoring, and stronger collaboration between regulators and industry stakeholders.
Avionics Market: COMMERCIAL USE CASES ACROSS INDUSTRIES
| COMPANY | USE CASE DESCRIPTION | BENEFITS |
|---|---|---|
 |
Early deployment of ADS-B Out avionics (DO-260B transponders, GPS/MMRs) across fleets; collaboration with FAA and OEMs to address certification and operational challenges | Compliance with ADS-B mandates, global airspace access, smoother ATC integration, influence on avionics policy updates |
 |
Introduction of FlytX integrated avionics suite with modular tactile displays and IMA architecture for helicopters, eVTOLs, turboprops, and business jets | 30–40% SWaP reduction, scalable cockpit design, reduced pilot workload, faster avionics upgrades via incremental certification |
 |
Fleet retrofit programme upgrading 787-8 avionics and cockpit systems to current Boeing service standards, alongside reliability and safety enhancements | Improved system reliability, reduced in-service disruptions, extended aircraft lifespan, compliance with regulator directives |
 |
Development of advanced integrated avionics and mission computer system for TH/AH530 to enable fast reconfiguration between training and combat roles | Mission flexibility, rapid avionics/weapon swap, cost-effective precision attack capability, enhanced situational awareness |
 |
Integration of next-generation mission computers into maritime patrol and surveillance aircraft to modernize legacy avionics architectures | Extended platform life, improved mission performance, MIL-STD-1553 & ARINC 429 compliance, reduced NRE costs |
Logos and trademarks shown above are the property of their respective owners. Their use here is for informational and illustrative purposes only.
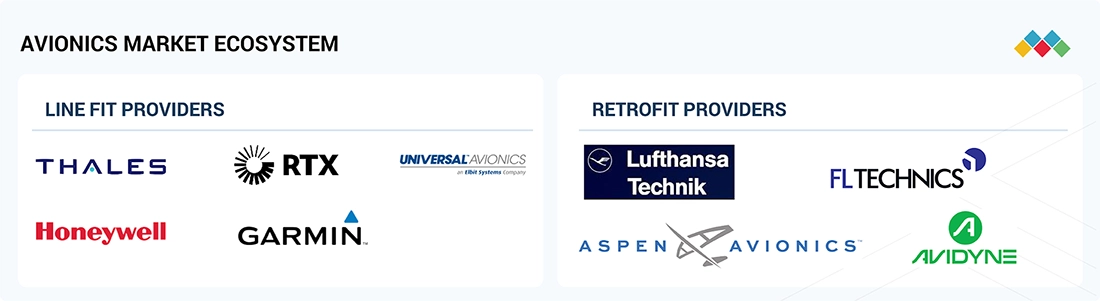
MARKET ECOSYSTEM
The avionics market ecosystem consists of leading line-fit providers developing advanced flight management, communication, and cockpit systems, supported by retrofit specialists upgrading existing fleets with modern solutions. End users in commercial, business, and military aviation are driving demand for safer, connected, and mission-specific avionics, making the integration of innovative technologies and cost-effective upgrades central to market growth.
Logos and trademarks shown above are the property of their respective owners. Their use here is for informational and illustrative purposes only.
MARKET SEGMENTS
Source: Secondary Research, Interviews with Experts, MarketsandMarkets Analysis
Avionics Market By System
Navigation is the largest avionics system segment, driven by the growing need for precise positioning, advanced flight management, and compliance with air traffic modernization programs such as Performance-Based Navigation (PBN) and NextGen/SESAR initiatives.
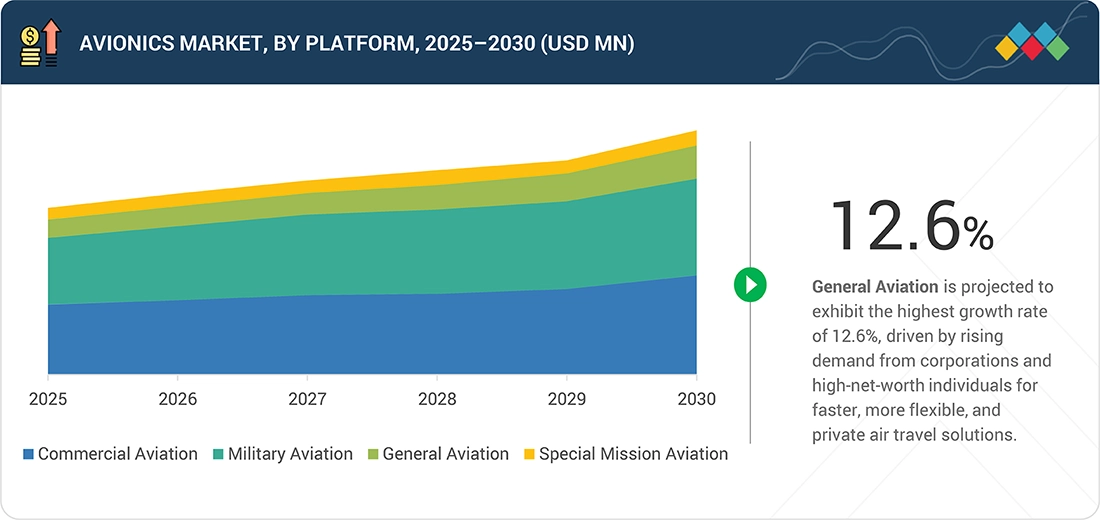
Avionics Market By Platform
Commercial aviation leads the avionics market, driven by increasing global air passenger traffic, expanding airline fleets, and ongoing demand for advanced cockpit and connectivity solutions to enhance operational efficiency and passenger safety.
Avionics Market By Fit
Line fit dominates the avionics market as OEMs integrate advanced systems during new aircraft production, driven by demand for factory-installed, certified solutions that meet evolving regulatory standards and reduce long-term retrofit costs.
REGION
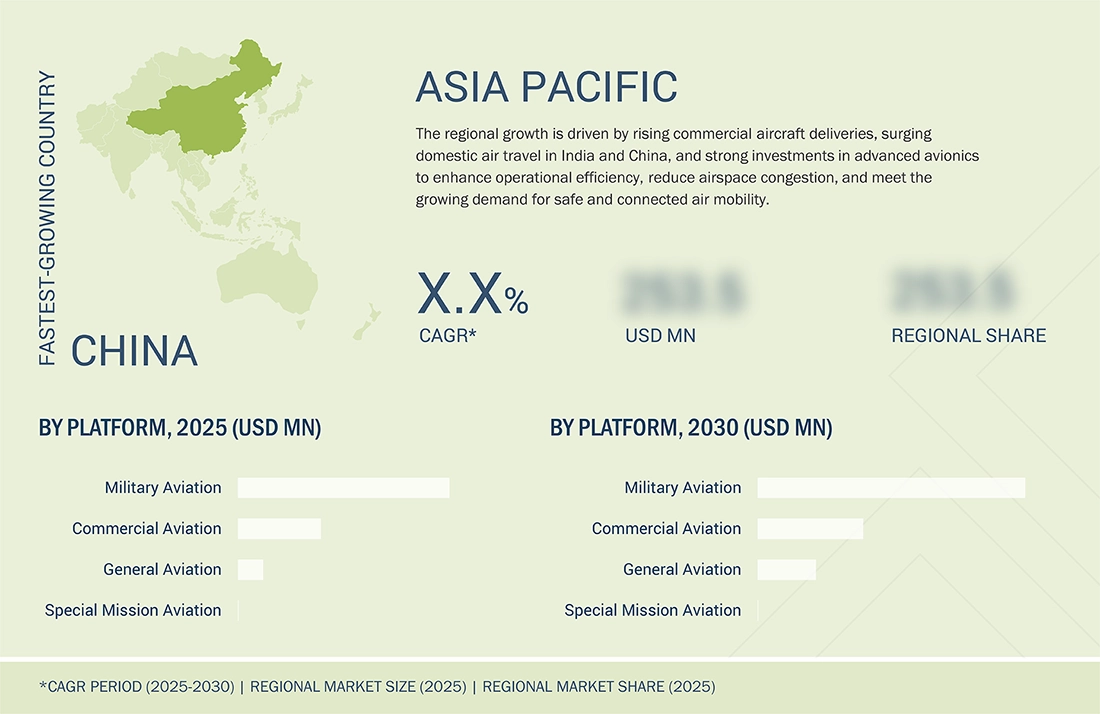
Asia Pacific to be fastest-growing region in global avionics market during forecast period
The Asia Pacific is emerging as the fastest-growing region in the avionics market, driven by record commercial aircraft deliveries, rapidly expanding domestic travel in key economies such as India and China, and sustained investments in next-generation avionics solutions aimed at enhancing operational efficiency, alleviating airspace congestion, and supporting the region’s growing demand for safe, connected, and high-capacity air mobility.
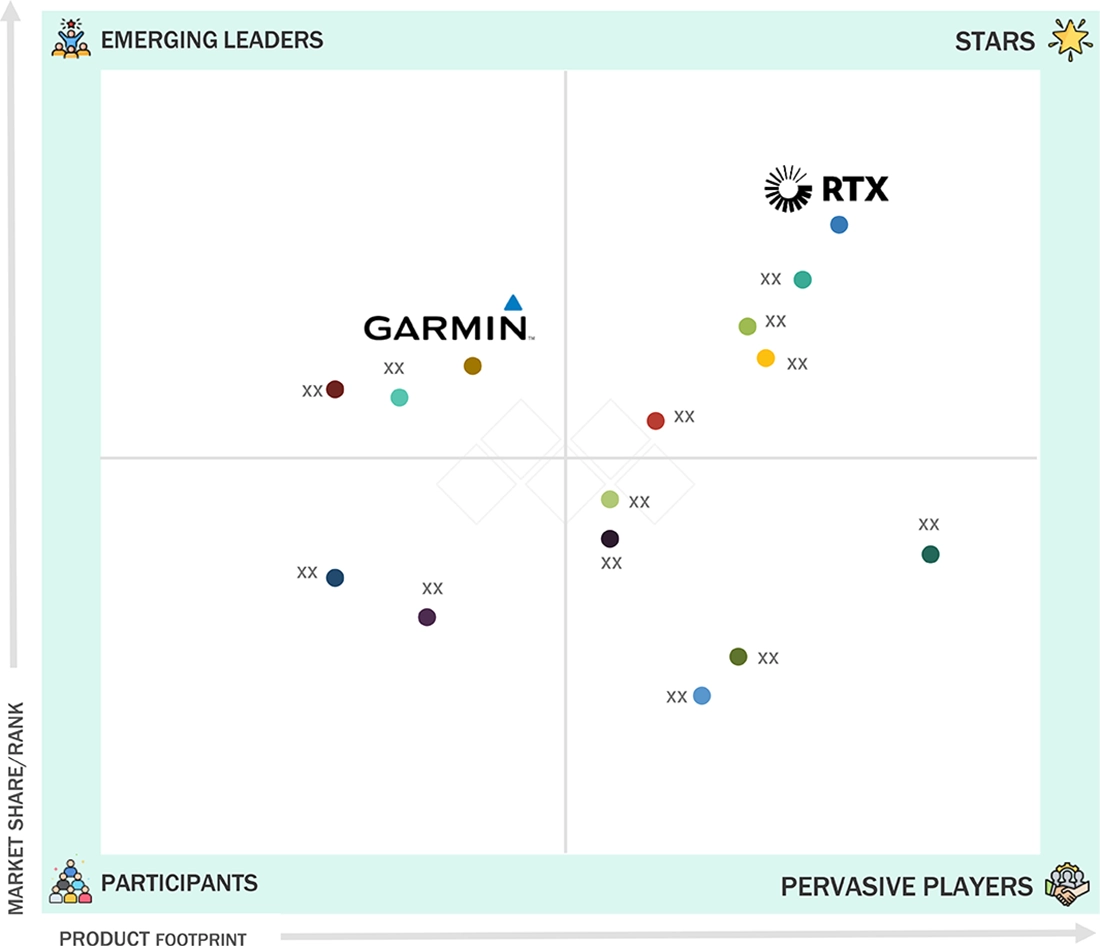
Avionics Market: COMPANY EVALUATION MATRIX
The company evaluation matrix for the avionics market evaluates players based on product footprint and market share. It highlights their competitive positioning and ranks them according to market strength and growth strategies. RTX is positioned as a leading player with a strong focus on advanced avionics technologies, while Garmin International is recognized as an emerging leader in this market.
Source: Secondary Research, Interviews with Experts, MarketsandMarkets Analysis
KEY MARKET PLAYERS
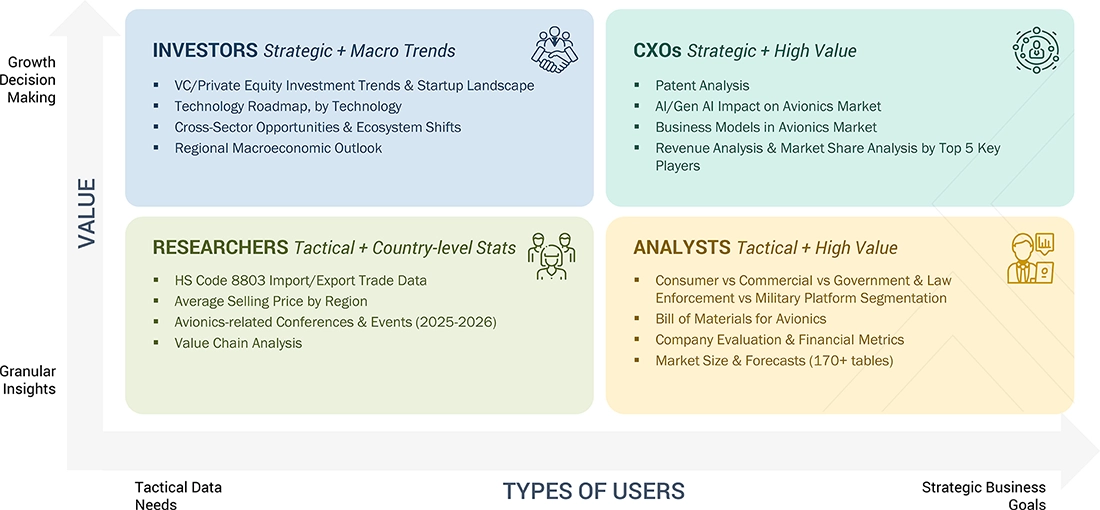
WHAT IS IN IT FOR YOU: Avionics Market REPORT CONTENT GUIDE
DELIVERED CUSTOMIZATIONS
We have successfully delivered the following deep-dive customizations:
| CLIENT REQUEST | CUSTOMIZATION DELIVERED | VALUE ADDS |
|---|---|---|
| Comprehensive understanding of the avionics market for special mission civil aviation (rotorcraft & fixed-wing) | Delivered detailed segmentation by aircraft type and avionics components, assessed demand trends, and provided growth projections with technology insights | Supported strategic decision-making with clear visibility on demand drivers, regulatory impact, and forecasted trends |
| Platform-wise avionics system breakdown | Delivered comprehensive market analysis and forecasts for commercial, military, general, and Special Mission Aviation, including detailed system-level segmentation | Equipped client with platform-specific system outlook, comparative growth trends, and forecast-driven insights to identify priority markets and allocate resources effectively |
RECENT DEVELOPMENTS
- March 2025 : Collins Aerospace (US) was awarded a contract to upgrade the avionics of Army Black Hawks.
- March 2025 : Thales (France) signed an avionics support deal for Malaysia Airlines’ new A330neos.
- February 2025 : GE Aerospace (US) was awarded a contract to provide performance-based logistics (PBL) avionics support for the F/A-18, AV-8B, and AH1-Z aircraft globally.
- February 2025 : Cyient DLM (India) announced that it had been awarded a strategic avionics manufacturing program by Thales (France).
- July 2024 : L3Harris Technologies, Inc. (US) secured an avionics contract with Air India for next-generation voice and data recorders.
Table of Contents
 Exclusive indicates content/data unique to MarketsandMarkets and not available with any competitors.
Methodology
The research study on the avionics market involved the extensive use of secondary sources, directories, and databases such as Hoovers, Bloomberg BusinessWeek, and Factiva to identify and collect information relevant to the market. Primary sources included industry experts, service providers, manufacturers, solution providers, technology developers, alliances, and organizations related to all segments of this industry's value chain. In-depth interviews with primary respondents, including key industry participants, subject matter experts, industry consultants, and C-level executives, were conducted to obtain and verify critical qualitative and quantitative information about the avionics market and assess the market's growth prospects.
Secondary Research
The market share of companies in the avionics market was determined using secondary data acquired through paid and unpaid sources and by analyzing the product portfolios of major companies operating in the market. These companies were rated based on the performance and quality of their products. Primary sources further validated these data points.
Secondary sources referred to for this research study on the avionics market included government sources, such as GAMA (General Aviation Manufacturer Association), FlightGlobal Commercial Avionics Consensus, International Air Transport Association (IATA), Boeing Outlook, Airbus Outlook, and federal and state governments of various countries; corporate filings, such as annual reports, investor presentations, and financial statements; and trade, business, and professional associations; among others. Secondary data was collected and analyzed to determine the overall size of the avionics market, which was further validated by primary respondents.
Primary Research
Extensive primary research was conducted after acquiring information regarding the avionics market through secondary research. Several primary interviews were conducted with experts from both the demand and supply sides across major countries of North America, Europe, Asia Pacific, the Middle East, and the Rest of the World, which comprises Africa and Latin America. Primary data was collected through questionnaires, emails, and telephonic interviews.

Note: The tiers of companies have been defined based on their total revenue as of 2024. Tier 1 = >USD 1 billion; Tier 2 = between USD 100 million and USD 1 billion; and Tier 3 = USD 100 million.
Others include sales, marketing, and product managers.
To know about the assumptions considered for the study, download the pdf brochure
Market Size Estimation
- Both top-down and bottom-up approaches were used to estimate and validate the size of the avionics market.
- Key players were identified through secondary research, and their market ranking was determined through primary and secondary research. This included a study of annual and financial reports of the top market players and extensive interviews of leaders, including CEOs, directors, and marketing executives.
- All percentage shares, splits, and breakdowns were determined using secondary sources and verified through primary sources. All possible parameters that affect the markets covered in this research study were accounted for, viewed in extensive detail, verified through primary research, and analyzed to obtain the final quantitative and qualitative data. This data was consolidated, enhanced with detailed inputs, analyzed by MarketsandMarkets, and presented in this report.
Avionics Market : Top-Down and Bottom-Up Approach

Data Triangulation
After arriving at the overall size of the avionics market from the market size estimation process explained above, the total market was split into several segments and subsegments. Wherever applicable, data triangulation and market breakdown procedures explained below were implemented to complete the overall market engineering process and arrive at the exact statistics for various market segments and subsegments. The data was triangulated by studying various factors and trends from both the demand and supply sides. The market size was also validated using both top-down and bottom-up approaches.
Market Definition
Avionics refers to the electronic systems used in aircraft, encompassing communication, navigation, flight control, and monitoring systems. It involves integrating hardware and software for radar, GPS, autopilot, and cockpit displays. Avionics ensures safe and efficient flight operations, enabling communication with air traffic control, navigation, weather detection, and precise aircraft control. These systems are critical for flight safety, improving situational awareness, and enhancing the overall performance of both commercial and military aircraft.
Key Stakeholders
- USV Manufacturers
- Government Authorities
- Regulatory Bodies
- R&D Companies
- Commercial aircraft manufacturers
- Subsystem Manufacturers
- Avionics Solution and Service Providers
Report Objectives
- To define, describe, and forecast the size of the avionics market based on platform, fit, and system
- To forecast the size of market segments within five regions: North America, Europe, Asia Pacific, the Middle East, and the Rest of the World
- To identify and analyze drivers, restraints, opportunities, and challenges influencing market growth
- To analyze micro markets with respect to individual growth trends, prospects, and their contribution to the overall market
- To analyze opportunities in the market for stakeholders by identifying market trends
- To profile key players and comprehensively analyze their market share and core competencies
- To analyze the degree of competition in the market by identifying key growth strategies adopted by leading market players, such as acquisitions, contracts, partnerships, and product launches
- To identify detailed financial positions, key products, and unique selling points of leading market players
- To provide a detailed competitive landscape of the market, along with market share and revenue analyses of key players
Available Customizations
Along with the market data, MarketsandMarkets offers customizations to meet the specific needs of companies. The following customization options are available for the report:
Product Analysis
- Product matrix, which gives a detailed comparison of the product portfolio of each company
Regional Analysis
- Further breakdown of the market segments at the country level
Company Information
- Detailed analysis and profiling of up to five additional players
Key Questions Addressed by the Report
What is the current size of the Avionics Market?
The global Avionics Market is valued at USD 56.22 billion in 2025 and is projected to reach USD 82.33 billion by 2030.
What is the expected CAGR of the Avionics Market?
The market is expected to grow at a CAGR of 7.9% from 2025 to 2030, driven by increasing aircraft deliveries, digital cockpit modernization, and connected aviation technologies.
What are the major growth drivers of the Avionics Market?
Key growth drivers include rising global air passenger traffic, increasing demand for connected and fuel-efficient aircraft, avionics modernization programs, growth in autonomous aviation technologies, and expanding aircraft fleets.
Which region is expected to grow the fastest in the Avionics Market?
Asia Pacific is projected to be the fastest-growing region due to rapid airline fleet expansion, increasing aircraft deliveries, and strong aviation investments in countries such as China and India.
Which platform segment dominates the Avionics Market?
The Commercial Aviation segment leads the market, supported by growing airline fleets, increasing passenger demand, and continuous investments in advanced cockpit and connectivity solutions.
Which avionics system segment holds the largest market share?
The Navigation Systems segment holds the largest share due to increasing requirements for precise positioning, advanced flight management, and compliance with modern air traffic management programs.
What are the key trends shaping the Avionics Market?
Major trends include AI-enabled avionics, integrated modular avionics, advanced flight management systems, enhanced cockpit connectivity, predictive maintenance, autonomous flight technologies, and electric aircraft integration.
Who are the leading companies in the Avionics Market?
Key players include RTX, Honeywell International, L3Harris Technologies, General Electric, Thales, Garmin, Safran, BAE Systems, Northrop Grumman, and Leonardo.
Which system segment is expected to witness significant growth during the forecast period?
The Power & Data Management Systems segment is expected to experience substantial growth due to increasing aircraft electrification and the need for efficient management of complex onboard systems.
What insights does a Avionics Market report provide?
The report provides detailed analysis of market size, growth forecasts, technology trends, system segmentation, platform analysis, competitive landscape, regional outlook, investment opportunities, and strategic developments across the aviation industry.
Need a Tailored Report?
Customize this report to your needs
Get 10% FREE Customization
Customize This ReportPersonalize This Research
- Triangulate with your Own Data
- Get Data as per your Format and Definition
- Gain a Deeper Dive on a Specific Application, Geography, Customer or Competitor
- Any level of Personalization
Let Us Help You
- What are the Known and Unknown Adjacencies Impacting the Avionics Market
- What will your New Revenue Sources be?
- Who will be your Top Customer; what will make them switch?
- Defend your Market Share or Win Competitors
- Get a Scorecard for Target Partners

Custom Market Research Services
We Will Customise The Research For You, In Case The Report Listed Above Does Not Meet With Your Requirements
Get 10% Free CustomisationTESTIMONIALS
Growth opportunities and latent adjacency in Avionics Market


Valentin
Apr, 2019
Topics: General aviation retrofit, forward-fit, and/or conventional gauges market values for piston engine (only) aircraft. Avionics, more specifically electronic flight instrument systems (EFIS). Data: Market share, number of tails, growth rates, sales history, etc. Thank you in advance!.