Ethernet Storage Fabric Market by Device (Switches, Adapters), Switching Port (10 GbE to 25 GbE, 100 GbE and Above), Storage Type (Block Storage, Hyper-Converged Infrastructure), Automation (Enterprise Data Center), and Geography - Global forecast 2024


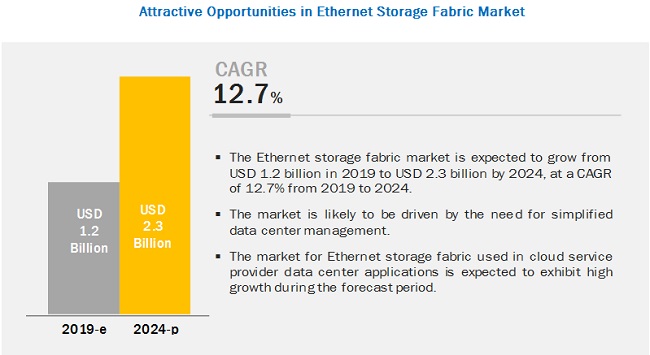
[138 Pages Report] The Ethernet storage fabric market size is expected to grow from USD 1.2 billion in 2019 to USD 2.3 billion by 2024, at a CAGR of 12.7% during the forecast period. Growing need for enterprise mobility to improve efficiency and rapid adoption of Ethernet storage fabric are expected to drive the ESF market during the forecast period. The ESF leverages the speed, flexibility, and cost efficiencies of Ethernet, along with the best switching hardware and software packaged in ideal form factors to provide performance, scalability, intelligence, high availability, and simplified management. ESF provides the foundation for the fastest and most efficient way of networking storage. An ESF operates on purpose-built switches, adapters, and controllers that are enhanced to offer the highest levels of performance, low latencies, and zero packet loss with unique form factors.
The market for 100 GbE and above switching port to grow at the highest CAGR during forecast period
The highest growth rate of the ESF market for 100 GbE and above switching port is due to the growing demand for high bandwidth, performance, and scalability in enterprise and cloud service provider data center. The expansion of data centers and growth in virtualization technology propel the demand for 100 GbE and above. In addition, 100 GbE and above switching port-based products are backward-compatible, which simplifies deployment. So, it helps end users reduce the installation and upgrade cost of switches, adapters, and controllers.
Enterprise data center application to hold the largest market size by 2019
The enterprise data center application expected to hold the largest market size in 2019. This growth is mainly attributed to the high adoption of ESF-based devices and technology in small and medium-sized enterprise (SME) and large enterprise. So, evolving enterprise data centers are powered by dynamic architectural solutions. Large enterprises across different industries have been increasingly adopting the digitization to improve their business processes. Also, revolutionizing digitization in healthcare, e-commerce, banking, and education is the key driver for the growing number of enterprise data centers, which would eventually drive the growth of the ESF market.
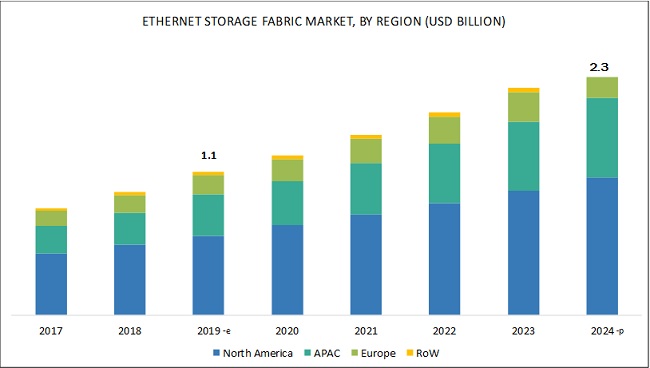
North America to hold largest share of Ethernet storage fabric market in 2019
North America region is expected to hold the largest share of the ethernet storage fabric market in 2019. Organizations shifting toward ESF-based devices and solutions, and the increasing adoption of advanced storage technologies are the major factors that are expected to drive the adoption of ESF offerings in North America. The US and Canada are the top North American countries that are expected to contribute to the ESF market. The US is expected to contribute the maximum share to the ESF market in North America due to technological advancements and the willingness to adopt innovations and new technologies.
Key Market Players
Mellanox Technologies (Israel), Huawei Technologies (China), Juniper Networks (US), Arista Networks (US), Hewlett Packard Enterprise Company (US), Intel Corporation (US), and Dell Technologies Inc. (US), Cisco Systems Inc., (US), Fujitsu (Japan), Fortinet (US), Microsemi Corporation (US), Allied Telesis Holdings K.K.(Japan), Lenovo Group (China), D-Link (Taiwan), H3C Technologies CO., Limited (Taiwan), Vicinity (US), Apeiron Data Systems (US), Argo Technologie SA (Switzerland), E8 Storage (US), and Edgecore Networks (Taiwan) are some of the major companies dominating the Ethernet storage fabric market.
Mellanox Technologies (Israel) is one of the leaders in developing multiple generations of high-speed interconnect solutions and Ethernet storage fabric switches and adapters. It has established its business globally, serving all major geographic regions comprising Asia, Europe, and the US. The company focuses on the organic growth strategy with dedicated R&D efforts on innovation. The company invests heavily in R&D; for instance, in 2017, the company invested about 42% of its revenue in R&D. The company is also one of the pioneers of InfiniBand switches.
The company initially started offering InfiniBand switches and then added Ethernet switches to its portfolio in 2007. So, the company�s core strategies include the facilitation of continued adoption of InfiniBand switches and Ethernet switches by expanding its partnerships with key vendors. Currently, Mellanox Technologies mainly focuses on capturing the Ethernet storage fabric market by expanding its Ethernet switch portfolio. Along with R&D, the company also invests a high share of its revenue in sales and marketing, ensuring the effective channel fit. The company�s marketing and sales offices are in the US, Europe, China, Japan, India, Taiwan, and Australia. To further focus its efforts on design and marketing, the company relies on third-party vendor manufacturing.
Cisco Systems Inc., (US) invests heavily in R&D to develop cost-competitive products and stay ahead in the industry. In 2017, it invested around USD 6.33 billion in R&D for the enhancement of existing products and developing cost-effective and high performing products with new features. For instance, the company launched the upgraded catalyst 9000 series switches, which provide a smarter and secure way of network deployment. Furthermore, Cisco Systems focuses on providing intelligent network automation, security, and analytics switching platforms. The company offers real-time visibility solutions for data centers through its newly innovated Tetration Analytics platform. This provides behavior-based application insight using deep forensic-based analysis. The company achieves productivity and cost efficiency by ensuring inventory management, flexibility regarding capacity, and quality and cost management. This is achieved by third-party manufacturing contracts.
Scope of the Report:
|
Report Metric |
Details |
|
Market size available for years |
2015�2024 |
|
Base year |
2018 |
|
Forecast period |
2019�2024 |
|
Units |
Value (USD) and Volume (Units) |
|
Segments covered |
Device, switching port, storage type, application, and Region |
|
Geographic regions covered |
North America, APAC, Europe, and RoW |
|
Companies covered |
Mellanox Technologies (Israel), Huawei Technologies (China), Juniper Networks (US), Arista Networks (US), |
This report categorizes the market based on device, switching port, storage type, application, and region.
Ethernet storage fabric market, by Device:
- Switches
- Adapters
- Controllers
Ethernet storage fabric market, by Switching Port:
- 10 GbE to 25 GbE
- 40 GbE to 50 GbE
- 100 GbE and Above
Ethernet storage fabric market, by Storage Type:
- Block Storage
- File Storage
- Object Storage
- Hyper-Converged Infrastructure
Ethernet storage fabric market, by Application:
- Enterprise Data Center
- Cloud Service Provider Data Center
- Telecommunications
- Government
Ethernet storage fabric market, by Region:
- North America
- US
- Canada
- Mexico
- APAC
- China
- Japan
- India
- Rest of APAC
- Europe
- Germany
- France
- UK
- Rest of Europe
- RoW
- Middle East and Africa
- South America
Recent Developments
- In November 2018, Cisco Systems launched Catalyst 9000 series switches for intent-based network. Cisco�s catalyst 9000 switches are the expansion of its previous catalyst switches, which help end user to deploy a network with smarter, simpler, and more secure.
- In October 2018, Arista Networks launched two platforms supporting 400 Gigabit Ethernet. The 400 GbE fixed systems deliver the performance that hyper-scale cloud networks and datacenters need for the growth of applications such as AI (artificial intelligence), machine learning, and serverless computing. Owing to this, the company strengthen its product portfolio and domain expertise
- In November 2018, LINE Corporation collaborated with Mellanox Technologies and Cumulus Networks to Power Advanced Messaging Platform. LINE Corporation selected Mellanox open Ethernet switches and Cumulus Linux open network operating system for its messaging applications.
- In November 2018, Juniper Networks announced to acquire HTBASE, offers a single layer of computing, networking, and storage across public and private clouds. Owing to this, Juniper Networks strengthen its domain expertise.
Key Questions Addressed in the Report
- How big is the opportunity for the Ethernet storage fabric market? How rising adoption of ESF-based devices can help to grasp this USD 2.3 billion opportunity?
- Which are the recent industry trends that can be implemented to generate additional revenue streams?
- Who are the major players operating in this market? Which companies are the front runners?
- With the rise in demand for ESF-based devices from various end-user industries, what are the opportunities for players now and for those planning to enter various stages of the value chain?
- How will the increasing adoption of hyper-converged infrastructure storage in cloud service provider data center application impact the growth rate of the overall market?
To speak to our analyst for a discussion on the above findings, click Speak to Analyst
 Exclusive indicates content/data unique to MarketsandMarkets and not available with any competitors.
Table of Contents
1 Introduction (Page No. - 15)
1.1 Study Objectives
1.2 Definition
1.3 Scope
1.3.1 Markets Covered
1.3.2 Years Considered
1.4 Currency
1.5 Limitation
1.6 Market Stakeholders
2 Research Methodology (Page No. - 18)
2.1 Research Data
2.1.1 Secondary Data
2.1.1.1 Secondary Sources
2.1.2 Primary Data
2.1.2.1 Primary Sources
2.1.2.2 Key Industry Insights
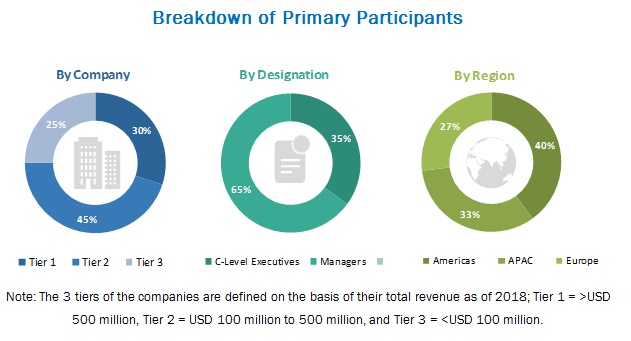
2.1.2.3 Breakdown of Primaries
2.2 Market Size Estimation
2.2.1 Bottom-Up Approach
2.2.2 Top-Down Approach
2.3 Market Breakdown and Data Triangulation
2.4 Research Assumptions
3 Executive Summary (Page No. - 26)
4 Premium Insights (Page No. - 30)
4.1 Attractive Growth Opportunities in Ethernet Storage Fabric Market
4.2 Market, By Application and Region
4.3 Market, By Device
4.4 Market, By Country
5 Market Overview (Page No. - 33)
5.1 Introduction
5.2 Market Dynamics
5.2.1 Drivers
5.2.1.1 Need for Simplified Data Center Management
5.2.1.2 Rapid Adoption of Ethernet Storage Fabric
5.2.1.3 Growing Need for Enterprise Mobility to Improve Efficiency
5.2.2 Restraints
5.2.2.1 Fear of Vendor Lock-In Organizations� Resistance to Adopt Modern Technologies
5.2.3 Opportunities
5.2.3.1 Growing Bandwidth Requirements in Data Centers
5.2.3.2 Increasing Need for Technologically Advanced Storage Solutions
5.2.4 Challenges
5.2.4.1 Compatibility With Data Center Architecture
5.3 Value Chain Analysis
6 Ethernet Storage Fabric Market, By Device (Page No. - 39)
6.1 Introduction
6.2 Switches
6.2.1 Switches to Dominate Ethernet Storage Fabric Market, in Terms of Market Size, Owing to Growing Interest of Leading Players to Offer High-Quality Switches for Enterprise and Cloud Service Provider Data Center
6.3 Adapters
6.3.1 Increasing Adoption of Ethernet Storage Fabric Due to Benefits Offered Such as Better Connectivity Along With Flexibility in Deployment to Boost Adapter Market
6.4 Controllers
6.4.1 Increasing Need of Technologically Advanced Architecture With High Performance From Enterprise and Cloud Service Provider Data Center Provide Opportunity for Market for Controllers
7 Ethernet Storage Fabric Market, By Switching Port (Page No. - 58)
7.1 Introduction
7.2 10 GbE to 25 GbE
7.2.1 Increasing Demand for Low Power Consumption Devices Drives the Growth of 10 GbE to 25 GbE Switching Port Market
7.3 40 GbE to 50 GbE
7.3.1 Expansion of Data Center Market and Wide Use of Servers and Virtulization Technology Fuel the Growth of 40 GbE to 50 GbE Switching Port Market
7.4 100 GbE and Above
7.4.1 Growing Demand for Greater Bandwidth and High Switching Speed and to Handle the Increased Data Load Spur the Growth of 100 GbE and Above Switching Port Market
8 Ethernet Storage Fabric Market, By Storage Type (Page No. - 64)
8.1 Introduction
8.2 Block Storage
8.2.1 Increasing Demand for Data Storage By Data Center Drives the Growth of Block Storage Market
8.3 File Storage
8.3.1 Increasing Data Traffic and High Addoption of Advanced Storage Technologies Spur the Growth of File Storage
8.4 Object Storage
8.4.1 Rising Demand for Data Management Solution in Cloud Service Provider Data Center Boost the Growth of Object Storage Market
8.5 Hyper-Converged Infrastructure (HCI)
8.5.1 High Adoption of Cloud Storage Solution Expected to Provide the Opportunity for Hyper-Converged Infrastructure Market
9 Ethernet Storage Fabric Market, By Application (Page No. - 67)
9.1 Introduction
9.2 Enterprise Data Center
9.2.1 Small- and Medium-Sized Enterprise (SME) Data Center
9.2.1.1 High Growth Rate in Data Storage to Fuel the Growth of Ethernet Storage Fabric in Small- and Medium-Sized Enterprise (SME) Data Center
9.2.2 Large Enterprise Data Center
9.2.2.1 Growing Adoption of Highly Scalable Infrastructure for Data Storage on Data Center to Drive the Ethernet Storage Fabric in Large Enterprise Data Center
9.3 Cloud Service Provider Data Center
9.3.1 Increasing Demand for High Bandwidth Solution for Managed and Unmanaged Network to Fuel the Growth of Ethernet Storage Fabric in Cloud Service Provider Data Center
9.4 Telecommunications
9.4.1 Need for Data Management and Mobile Data Traffic to Spur the Demand of Ethernet Storage Fabric in Telecommunications
9.5 Government
9.5.1 Growing Demand for Secure and Reliable Network Connectivity to Drive the Growth of Ethernet Storage Fabric in Government
10 Geographic Analysis (Page No. - 77)
10.1 Introduction
10.2 North America
10.2.1 US
10.2.1.1 Early Adoption Advanced Storage Technologies and Strong Presence of ESF Players to Fuel the Growth of ESF in the Us
10.2.2 Canada
10.2.2.1 Government Initiatives for the Growth of Data Centers to Drive the ESF in Canada
10.2.3 Mexico
10.2.3.1 Growing Economy and High Data Generation Growth to Drive the Demand for ESF in Mexico
10.3 Asia Pacific
10.3.1 China
10.3.1.1 Increasing Multinational and Domestic Enterprises Towards Cloud Technology to Fuel the Growth of ESF in China
10.3.2 India
10.3.2.1 Increasing IT Sector and SME to Spur the Demand of ESF in India
10.3.3 Japan
10.3.3.1 High Adoption of Cloud Services in SME Business to Drive the Growth of ESF in Japan
10.3.4 Rest of the APAC
10.3.4.1 Increasing Digitization in Enterprises to Fuel the Growth of ESF in Rest of the APAC
10.4 Europe
10.4.1 UK
10.4.1.1 Huge Spending on IoT, Big Data, Social Networking, and Increasing Trend of Data Center Outsourcing By Enterprises to Drive the Growth of ESF in UK
10.4.2 Germany
10.4.2.1 Heavy Adoption of Storage Technologies in IT Infrastructure to Increase the Demand for ESF in Germany
10.4.3 France
10.4.3.1 Presence of High-Speed Telecommunications Infrastructure to Drive the ESF Market in France
10.4.4 Rest of the Europe
10.4.4.1 Growing Enterprise and CSP Data Center to Boost the Demand for ESF in Rest of Europe
10.5 RoW
10.5.1 Middle East and Africa
10.5.1.1 Initiatives By Cloud Service Provider and Government in Cloud Data Center to Increase the Demand for ESF in Middle East and Africa
10.5.2 South America
10.5.2.1 Strong Investment in Telecom Industry to Drive the Growth of ESF in South America
11 Competitive Landscape (Page No. - 92)
11.1 Introduction
11.2 Market Ranking Analysis, 2018
11.3 Competitive Scenario
11.3.1 Product Launches and Developments
11.3.2 Partnerships and Collaborations
11.3.3 Acquisitions and Expansions
11.4 Competitive Leadership Mapping
11.4.1 Visionary Leaders
11.4.2 Dynamic Differentiators
11.4.3 Innovators
11.4.4 Emerging Companies
12 Company Profile (Page No. - 98)
(Business Overview, Products Offered, Recent Developments, MnM View, SWOT Analysis)*
12.1 Key Players
12.1.1 Mellanox Technologies, Ltd
12.1.2 Cisco Systems, Inc.
12.1.3 Hewlett Packard Enterprise Company
12.1.4 Huawei Technologies Co., Ltd.
12.1.5 Arista Networks
12.1.6 Juniper Networks
12.1.7 Intel Corporation
12.1.8 Dell Technologies Inc.
12.1.9 Fujitsu
12.1.10 Fortinet, Inc.
12.2 Other Key Players
12.2.1 Microsemi Corporation
12.2.2 Allied Telesis Holdings K.K.
12.2.3 Lenovo Group Ltd.
12.2.4 D-Link
12.2.5 H3C Technologies Co., Limited
12.2.6 Vcinity
12.2.7 Apeiron Data Systems
12.2.8 Argo Technologie SA
12.2.9 E8 Storage
12.2.10 Edgecore Networks
*Business Overview, Products Offered, Recent Developments, MnM View, SWOT Analysis Might Not Be Captured in Case of Unlisted Companies.
13 Appendix (Page No. - 133)
13.1 Discussion Guide
13.2 Knowledge Store: Marketsandmarkets� Subscription Portal
13.3 Available Customizations
13.4 Related Reports
13.5 Author Details
List of Tables (65 Tables)
Table 1 Comparison of Technologies
Table 2 Market, By Device, 2015�2024 (USD Million)
Table 3 Market for Switches, By Switching Port, 2015�2024 (USD Million)
Table 4 Market for Switches, By Application, 2015�2024 (USD Million)
Table 5 Market for Switches, By Enterprise Data Center Application Type, 2015�2024 (USD Million)
Table 6 Market for Switches, By Region, 2015�2024 (USD Million)
Table 7 Ethernet Storage Fabric Market for Switches in Enterprise Data Center Application, By Region, 2015�2024 (USD Million)
Table 8 Market for Switches in Small- & Medium- Sized Enterprise Data Center Application, By Region, 2015�2024 (USD Million)
Table 9 Market for Switches in Large Enterprise Data Center Application, By Region, 2015�2024 (USD Million)
Table 10 Market for Switches in Cloud Service Provider Data Center Application, By Region, 2015�2024 (USD Million)
Table 11 Market for Switches in Telecommunications Application, By Region, 2015�2024 (USD Million)
Table 12 Market for Switches in Government Application, By Region, 2015�2024 (USD Million)
Table 13 Market for Adapters, By Switching Port, 2015�2024 (USD Million)
Table 14 Market for Adapters, By Application, 2015�2024 (USD Million)
Table 15 Market for Adapters, By Enterprise Data Center Application Type, 2015�2024 (USD Million)
Table 16 Market for Adapters, By Region, 2015�2024 (USD Million)
Table 17 Market for Adapters in Enterprise Data Center Application, By Region, 2015�2024 (USD Million)
Table 18 Market for Adapters in Small- & Medium- Sized Enterprise Data Center Application, By Region, 2015�2024 (USD Million)
Table 19 Market for Adapters in Large Enterprise Data Center Application, By Region, 2015�2024 (USD Million)
Table 20 Market for Adapters in Cloud Service Provider Data Center Application, By Region, 2015�2024 (USD Million)
Table 21 Market for Adapters in Telecommunications Application, By Region, 2015�2024 (USD Million)
Table 22 Market for Adapters in Government Application, By Region, 2015�2024 (USD Million)
Table 23 Market for Controllers, By Switching Port, 2015�2024 (USD Million)
Table 24 Market for Controllers, By Application, 2015�2024 (USD Million)
Table 25 Market for Controllers, By Enterprise Data Center Application Type, 2015�2024 (USD Million)
Table 26 Market for Controllers, By Region, 2015�2024 (USD Million)
Table 27 Market for Controllers in Enterprise Data Center Application, By Region, 2015�2024 (USD Million)
Table 28 Market for Controllers in Small- & Medium- Sized Enterprise Data Center Application, By Region, 2015�2024 (USD Thousand)
Table 29 Market for Controllers in Large Enterprise Data Center Application, By Region, 2015�2024 (USD Million)
Table 30 Market for Controllers in Cloud Service Provider Data Center Application, By Region, 2015�2024 (USD Thousand)
Table 31 Market for Controllers in Telecommunications Application, By Region, 2015�2024 (USD Thousand)
Table 32 Market for Controllers in Government Application, By Region, 2015�2024 (USD Thousand)
Table 33 Market for Switches, By Switching Port, 2015�2024 (USD Million)
Table 34 Market for 10 GbE to 25 GbE, By Device, 2015�2024 (USD Million)
Table 35 Market for 40 GbE to 50 GbE, By Device, 2015�2024 (USD Million)
Table 36 Market for 100 GbE and Above, By Device, 2015�2024 (USD Million)
Table 37 Market, By Storage Type, 2015�2024 (USD Million)
Table 38 Market, By Application, 2015�2024 (USD Million)
Table 39 Market, By Enterprise Data Center Application Type, 2015�2024 (USD Million)
Table 40 Market for Enterprise Data Center Application, By Device, 2015�2024 (USD Million)
Table 41 Market for Enterprise Data Center Application, By Region, 2015�2024 (USD Million)
Table 42 Market for Small-And Medium-Sized Enterprise Data Center Application, By Device, 2015�2024 (USD Million)
Table 43 Market for Large Enterprise Data Center Application, By Device, 2015�2024 (USD Million)
Table 44 Market for Cloud Service Provider Data Center Application, By Device, 2015�2024 (USD Million)
Table 45 Market for Cloud Service Provider Data Center Application, By Region, 2015�2024 (USD Million)
Table 46 Market for Telecommunications Application, By Device, 2015�2024 (USD Million)
Table 47 Market for Telecommunications Application, By Region, 2015�2024 (USD Million)
Table 48 Market for Government Application, By Device, 2015�2024 (USD Million)
Table 49 Market for Government Application, By Region, 2015�2024 (USD Million)
Table 50 Market, By Region, 2015�2024 (USD Million)
Table 51 Market in North America, By Device, 2015�2024 (USD Million)
Table 52 Market in North America, By Application, 2015�2024 (USD Million)
Table 53 Ethernet Storage Fabric Market in North America, By Country, 2015�2024 (USD Million)
Table 54 Market in APAC, By Device, 2015�2024 (USD Million)
Table 55 Market in APAC, By Application, 2015�2024 (USD Million)
Table 56 Market in APAC, By Country, 2015�2024 (USD Million)
Table 57 Market in Europe, By Device, 2015�2024 (USD Million)
Table 58 Market in Europe, By Application, 2015�2024 (USD Million)
Table 59 Market in Europe, By Country, 2015�2024 (USD Million)
Table 60 Market in RoW, By Device, 2015�2024 (USD Million)
Table 61 Market in RoW, By Application, 2015�2024 (USD Million)
Table 62 Market in RoW, By Region, 2015�2024 (USD Million)
Table 63 Product Launches and Developments, 2017�2018
Table 64 Partnerships and Collaborations, 2017�2018
Table 65 Agreements and Contracts, 2016�2018
List of Figures (45 Figures)
Figure 1 Ethernet Storage Fabric Market: Research Design
Figure 2 Research Flow of Market Size Estimation
Figure 3 Market Size Estimation Methodology: Bottom-Up Approach
Figure 4 Market Size Estimation Methodology: Top-Down Approach
Figure 5 Data Triangulation
Figure 6 Switches to Hold Largest Size of Market During 2019�2024
Figure 7 100 GbE and Above Switching Port to Witness Highest CAGR of Market During 2019�2024
Figure 8 Hyper-Converged Infrastructure to Account for Largest Share of Market By 2024
Figure 9 Ethernet Storage Fabric Market for Cloud Service Provider Data Center Applications to Grow at Highest CAGR From 2019 to 2024
Figure 10 APAC Expected to Be Fastest-Growing Region in Market During Forecast Period
Figure 11 Need for Simplified Data Center Management to Spur Ethernet Storage Fabric Growth During Forecast Period
Figure 12 Enterprise Data Center and North America are Expected to Account Largest Share of Market, Based on Application and Region, Respectively, in 2024
Figure 13 Switches to Account for Largest Share of Market During Forecast Period
Figure 14 China to Grow at the Fastest Rate During the Forecast Period
Figure 15 Need for Simplified Data Center Management
Figure 16 Increasing Big Data Volume, 2014�2020 (Zettabytes)
Figure 17 Increasing Cloud Data Center Traffic During 2016�2021
Figure 18 Value Chain: Market, 2018
Figure 19 Market, By Device
Figure 20 Market for Switches to Grow at the Highest CAGR During the Forecast Period
Figure 21 Ethernet Storage Fabric Switches Market in APAC to Witness Highest CAGR During Forecast Period
Figure 22 North America to Account for Largest Share of Ethernet Storage Fabric Adapters Market By 2019
Figure 23 Ethernet Storage Fabric Controllers Market in APAC to Witness Highest CAGR During Forecast Period
Figure 24 Market, By Switching Port
Figure 25 Market for 100 GbE and Above to Grow at the Highest CAGR During the Forecast Period
Figure 26 Market, By Storage Type
Figure 27 Ethernet Storage Fabric Market, By Application
Figure 28 Market for Cloud Service Provider Data Center to Grow at the Highest CAGR During the Forecast Period
Figure 29 APAC to Witness Highest CAGR in Ethernet Storage Fabric Market During Forecast Period
Figure 30 North America: Market Snapshot
Figure 31 Asia Pacific: Market Snapshot
Figure 32 Europe: Market Snapshot
Figure 33 Companies Adopted Product Launches and Developments as Key Growth Strategies From 2015 to 2018
Figure 34 Ranking of Top 5 Players in Market
Figure 35 Market (Global) Competitive Leadership Mapping, 2018
Figure 36 Mellanox Technologies, Ltd: Company Snapshot
Figure 37 Cisco Systems, Inc.: Company Snapshot
Figure 38 Hewlett Packard Enterprise Company: Company Snapshot
Figure 39 Huawei Technologies Co., Ltd.: Company Snapshot
Figure 40 Arista Networks: Company Snapshot
Figure 41 Juniper Networks: Company Snapshot
Figure 42 Intel Corporation: Company Snapshot
Figure 43 Dell Technologies Inc.: Company Snapshot
Figure 44 Fujitsu: Company Snapshot
Figure 45 Fortinet, Inc.: Company Snapshot
The study involved 4 major activities in estimating the current size of the Ethernet storage fabric (ESF) market. Exhaustive secondary research has been done to collect information about the market, the peer market, and the parent market. Validating findings, assumptions, and sizing with industry experts across the value chain through primary research has been the next step. Both top-down and bottom-up approaches have been employed to estimate the complete market size. After that, market breakdown and data triangulation methods have been used to estimate the market size of segments and sub segments.
Secondary Research
In the secondary research process, various secondary sources have been referred to for identifying and collecting information pertinent to this study. Secondary sources include annual reports; press releases; investor presentations; white papers; journals and certified publications; and articles from recognized authors, directories, and databases. Secondary research has been conducted to obtain important information about the industry�s supply chain, value chain, total pool of key players, market segmentation according to the industry trends (to the bottommost level), geographic markets, and key developments from both market- and technology-oriented perspectives.
Primary Research
Extensive primary research has been conducted after gaining knowledge about the ESF market scenario through secondary research. Several primary interviews have been conducted with market experts from both demand (commercial application providers) and supply (equipment manufacturers and distributors) sides across 4 major regions: North America, Europe, APAC, and RoW. Approximately 20% and 80% primary interviews have been conducted with parties from demand and supply sides, respectively. The primary data has been collected through questionnaires, emails, and telephonic interviews.
To know about the assumptions considered for the study, download the pdf brochure
Market Size Estimation
In the complete engineering process, both top-down and bottom-up approaches, along with several data triangulation methods, have been used to estimate and validate the size of the ESF market and other dependent submarkets. The key players in the market have been determined through primary and secondary research. This entire research methodology involves the study of the annual and financial reports of the top market players and extensive interviews with industry experts such as CEOs, VPs, directors, and marketing executives for key insights (both qualitative and quantitative) into the ESF market.
Data Triangulation
All the percentage shares, splits, and breakdowns have been determined using secondary sources and verified through primary sources. All the possible parameters that affect the markets covered in this research study have been accounted for, viewed in extensive detail, verified through primary research, and analyzed to get the final quantitative and qualitative data. This data has been consolidated and supplemented with detailed inputs and analysis from MarketsandMarkets and presented in the report.
Report Objectives
- To describe and forecast the Ethernet storage fabric (ESF) market by device, switching port, storage type, application and geography, in terms of value
- To describe and forecast the market for devices� switches, adapters, and controllers, in terms of value
- To describe and forecast the market for various segments, by region�North America, Europe, Asia Pacific (APAC), and Rest of the World (RoW), in terms of value
- To provide detailed information regarding the drivers, restraints, opportunities, and challenges that influence the growth of the ESF market
- To provide a detailed overview of the Ethernet storage fabric value chain and industry trends and standards in the said market
- To strategically analyze micromarkets1 with respect to the individual growth trends, prospects, and contribution to the overall market
- To analyze opportunities in the market for various stakeholders by identifying high-growth segments of the ESF market
- To strategically profile key players and comprehensively analyze their market ranking in terms of revenue and core competencies2
- To analyze strategies such as product launches and developments, agreements, partnerships, collaborations, merger and acquisitions, and expansions in the ESF market
Available Customizations
With the given market data, MarketsandMarkets offers customizations according to the company�s specific needs. The following customization options are available for the report:
Company Information
- Detailed analysis and profiling of additional market players (up to 5).


Growth opportunities and latent adjacency in Ethernet Storage Fabric Market