Feed Palatability Enhancers & Modifiers Market by Type (Natural and Synthetic), by Livestock (Swine, Poultry, Cattle, Pets, Aquaculture, and Others) - Global Trends & Forecasts to 2019


This report analyzes the feed palatability enhancers market by type, livestock, and geography. Geographically, the report is segmented into Asia-Pacific, Europe, North America, and Rest of the World. The livestock covered in this report are swine, poultry, cattle, pet, and aquaculture. The market segmentation in terms of category of the report includes flavors, sweeteners, and texturants. The palatability enhancers are added to the animal feed in order to nullify the bitter taste of vitamins, minerals, and other medicines, thus increasing the feed intake by the animal. This also provides shelf life stability to the product. The other additives are used to achieve an ideal terrain in the gastrointestinal tract that will limit the excessive growth of pathogenic microbes and optimize the conditions for the proliferation of beneficial bacteria.
The report estimates the global feed palatability enhancers market size in terms of value. It discusses the market drivers, restraints, and opportunities. The report also tracks the recent strategic activities of market players such as product launches, expansion plans, supply contracts, partnerships and collaborations. Additionally, 10 key players of the market have been profiled in this report.
Feed palatability enhancers & modifiers have gained a significant position in the field of feed supplements as they are highly influential in the development of animal feed industry. The utilization of feed palatability enhancers & modifiers has increased the feed intake in animals and also, the sweetness of animal feed.
Feed Palatability Enhancers & Modifiers Market Share (Value), by Livestock, 2013
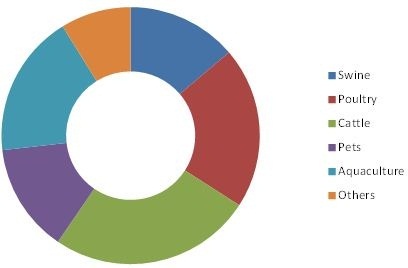
Source: MarketsandMarkets Analysis
The feed palatability enhancers market was valued at $2,577.8 Million in 2013. Various types of feed flavors, sweeteners, and texturants have been introduced in the past decade. These products not only help in neutralizing the bad taste of feed, but also in improving the overall health of the livestock.
The global market is a rewarding market from the perspective of feed manufacturers and meat producers. Product innovations are likely to play a key role in increasing the share of the market players. Some of the key players include Eli Lilly and Company (U.S.), Kerry Group (Ireland), Associated British Foods Plc. (U.K.), and Diana Foods (France). The top four players mentioned above accounted for about 21% of the market in 2013, in terms of value. The products of these companies are used by feed manufacturers and meat producers. Asia-Pacific is leading the global market due to the rise in animal health concerns and accelerated meat consumption in the region. Moreover, high awareness of the benefits of feed palatability enhancer & modifiers products in animal health has helped in increasing the penetration of the market in the North American nations. The North American feed palatability enhancers market is also growing rapidly owing to the increase in preference for the quality products by the pet owners and rising awareness regarding the chemicals used in animal feeds.
This report highlights the natural and synthetic types of feed flavors, sweeteners and texturants. The report also estimates the market size of feed palatability enhancers & modifiers in the key markets of Europe, APAC, North America, and Rest of the World (ROW). In addition to market forecasts, the report also highlights the key opportunity areas for the relevant stakeholders by analyzing trends, opportunities, drivers, and inhibitors for the market.
In order to provide a deeper understanding of the competitive landscape, the report profiles ten key players of the feed palatability enhancers & modifiers market, and provide more than hundred market tables, categorized into type, livestock, and geographic regions.
The report segments the global market into the following three segments:
By type:
- Natural
- Synthetic
By livestock:
- Swine
- Poultry
- Cattle
- Pets
- Aquaculture
- Others
By geography:
- North America
- Europe
- Asia-Pacific
- Rest of the World
Feed Palatability Enhancers Market is forecast as $3172.6 Million in 2019, Asia Pacific leading the market with 34% share in 2013.
The feed palatability enhancers & modifiers market is fueled by the rise in the meat consumption all over the world. The feed palatability enhancers & modifiers market has been growing at a steady rate over the last few years. The high consumption and export of meat in the Asia-Pacific is fueling the market in the region. The unpleasant smell and bitter taste of the feed that comes from feed additives�that are considered good for the gut health of the digestive tract in the animals and are also a good substitute to the antibiotics in feed are neutralized by the flavors and sweeteners. The market for these products is growing in developing economies such as China, India, and Brazil.
The growing demand for healthy and safe human food and mass production of meat has received significant attention of the manufacturers of feed additives such as flavors, sweeteners, and texturants. Palatability is not only confined to adding flavors to the product, but also adds texture to the animal feed. Palatability includes oxidation, mold control, and increased shelf life of the animal feed. The dietary insertion of these palatability enhancers has a positive effect on the animal health as it is mixed with other feed additives with nutritive value. These help in proliferation of indigenous lactic acid bacteria, which play a prominent role in the activation of the immune response against diseases. The feed palatability enhancers market is projected to grow at a CAGR of 3.5% from 2014 to 2019. Asia-Pacific is increasingly becoming an attractive market for the manufacturers of feed palatability enhancers & modifiers.
Feed Palatability Enhancers & Modifiers Market Size, by Livestock, 2014 vs. 2019 ($Million)
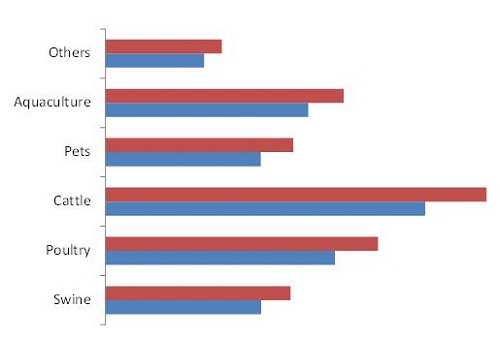
Source: MarketsandMarkets Analysis
Use of these products was dominated by cattle feed, owing mainly to the rising production of cattle meat, the global market is projected to grow further. Pet food is growing at the highest CAGR from 2014 to 2019, owing mainly rise in the aging population of the region. High pet adoption rates by the aging population the region are fueling the market growth for feed palatability enhancers & modifiers in pet food. By geography, Asia-Pacific dominated the feed palatability enhancers market followed by North America.
Asia-Pacific is a key consumer of palatability enhancers & modifiers in global feed additives market, with a share of over 34% in 2013. It is the largest market for feed palatability as a result of the growing demand for animal feed in the region. Thus, the manufacture of the animal feed palatability enhancers & modifiers in the region is quite high. Further, the consumer awareness regarding the chemicals used in animal feed has led to some of the major innovations in the animal feed palatability enhancers & modifiers in the region. Overall, the animal feed palatability enhancers & modifiers industry in the European region has been quite stagnating, for the past few years due to strict regulations and factors such as such as cost and productivity of the animal feed, which has been the a key factor in impeding its growth
Some of the major players in the global feed palatability enhancers market are Eli Lilly and Company (U.S.), Kerry Group (Ireland), Associated British Foods Plc. (U.K.), and Diana Foods (France). These companies provide an extensive range of products, which offer specialized benefits to animals such as swine, pets, cattle, poultry, and the aquatic species.
 Exclusive indicates content/data unique to MarketsandMarkets and not available with any competitors.
Table of Contents
1 Introduction (Page No. - 18)
1.1 Objectives of the Study
1.2 Report Description
1.3 Markets Covered
1.4 Stakeholders
1.5 Research Methodology
1.5.1 Market Size Estimation
1.5.2 Market Breakdown & Data Triangulation
1.5.3 Assumptions Made for the Report
1.5.4 Key Data Taken From Secondary Sources
1.5.5 Key Data Taken From Primary Sources
2 Executive Summary (Page No. - 29)
3 Premium Insights (Page No. - 32)
4 Total Addressable Market (Page No. - 38)
4.1 Introduction
4.1.1 Poultry Feed
4.1.2 Cattle Feed
4.1.3 Swine Feed
4.1.4 Aqua Feed
4.1.5 Pet Foods
4.1.6 Others
5 Industry Analysis (Page No. - 42)
5.1 Introduction
5.2 Supply Chain Analysis
5.3 Market Share Analysis
5.4 Swot Analysis
5.4.1 Associated British Foods PLC (ABF)
5.4.2 Diana Group
5.4.3 E. I. Dupont
5.4.4 Eli Lilly and Company
5.4.5 Kerry Group
6 Market Overview (Page No. - 54)
6.1 Introduction
6.2 Key Features
6.2.1 Growing Population & Rise in Demand for High-Protein Food
6.2.2 Cattle Industry
6.3 Market Dynamics
6.4 Drivers
6.4.1 Rise in Global Meat Consumption
6.4.2 Consumer Awareness About Quality of Meat
6.4.3 Mass Production of Meat
6.4.4 Rising Demand for Feed
6.4.5 Quality of Pet Food - A Major Concern
6.5 Restraint
6.5.1 Rise in the Cost of Raw Materials
6.5.2 Harmful Effects of Ingredients
6.6 Opportunity
6.6.1 Rise in the Cost of Natural Feed Products
6.7 Impact Analysis
6.8 Winning Imperative
6.8.1 Business Expansions & Acquisitions
6.9 Porter�s Five forces Analysis
6.9.1 Suppliers� Power
6.9.2 Buyers� Power
6.9.3 Threat of New Entrants
6.9.4 Threat of Substitutes
6.9.1 Intensity of Competitive Rivalry
7 Animal Palatability Enhancers & Modifiers Market, By Type (Page No. - 70)
7.1 Introduction
7.2 Feed Flavors & Sweeteners
7.2.1 Natural Flavors
7.2.1.1 Fruit Flavors
7.2.1.2 Citrus Flavors
7.2.1.3 Flavors From Spices
7.2.1.4 Other Flavors
7.2.2 Synthetic Flavors
7.2.2.1 Flavor Inclusions to Induce Feed Intake in Animals
7.2.3 Natural Sweeteners
7.2.3.1 Glycyrrhizin (Glycyrrhizic Acid Or Glycyrrhizinic Acid)
7.2.3.2 Thaumatin
7.2.3.3 Stevia
7.2.4 Synthetic Sweeteners
7.2.4.1 Saccharine
7.2.4.2 Neohesperidine Dihydrochalcone (NHDC)
7.2.4.3 Neotame
7.2.4.4 Economical Substitutes & Palatability Improvement Features Drive Demand for Feed Sweeteners
7.3 Feed Texturants
7.3.1 Natural Texturants
7.3.1.1 Hydrocolloids
7.3.1.1.1 Alginates
7.3.1.1.2 Carrageenan
7.3.1.2 Guar Meal
7.3.1.3 Bentonite & Clay
7.3.1.4 Gums
7.3.2 Synthetic Texturants
7.3.2.1 Urea formaldehyde
8 Animal Palatability Enhancers & Modifiers Market, By Livestock (Page No. - 81)
8.1 Introduction
8.2 Swine
8.2.1 Key Features
8.2.1.1 Rising Health Concerns for Swine Spurs the Demand for Palatability Enhancers & Modifiers
8.3 Poultry
8.3.1 Driver
8.3.1.1 Rising Demand for Poultry Meat to Boost Demand for Poultry Animal Palatability Enhancers & Modifiers
8.4 Cattle
8.4.1 Driver
8.4.1.1 Prevention of Nutritional Diseases Advances Growth
8.5 Aquaculture
8.5.1 Driver
8.5.1.1 Nutrition & Feeding Management Drive the Palatability Enhancers Market
8.6 Pet Foods
8.6.1 Driver
8.6.1.1 Health Benefits Lead the Growth of the Pet Food Palatability Enhancers Market
8.7 Others
9 Animal Palatability Enhancers & Modifiers Market, By Geography (Page No. - 93)
9.1 Introduction
9.2 North America
9.2.1 Restraint
9.2.1.1 Prevailing Challenges in Pork Industry Hamper North America�s Growth in Animal Feed Industry
9.2.2 U.S.
9.2.2.1 Increasing Per Capita Income Drives Livestock Feed Sector in the U.S.
9.2.3 Canada
9.2.3.1 Rising Demand for Livestock Meat Boosts Animal Palatability Enhancers & Modifiers Market in Canada
9.2.4 Mexico
9.2.4.1 Increasing Per Capita Consumption of Pork Promotes Growth of the Palatability Enhancers & Modifiers Market in Mexico
9.3 Europe
9.3.1 Restraint
9.3.1.1 Increasing Raw Material Costs & Decreasing Animal Feed Production Slackens Animal Palatability Enhancers & Modifiers Market in Europe
9.3.2 Germany
9.3.2.1 Rising Health Awareness Linked to Meat Among Consumers Promotes the Growth
9.3.3 France
9.3.3.1 Prevailing Pedv Bans Animal Feed Containing Pork in France
9.3.4 U.K.
9.3.4.1 Animal Diseases Hamper Growth of the Animal Palatability Enhancers & Modifiers Market in the U.K.
9.3.5 Italy
9.3.5.1 Decreasing Number of Pigs & Cattle Weaken Italian Feed industry
9.3.6 Spain
9.3.6.1 Rising Demand for Bovine Meat Drives the Palatability Enhancers & Modifiers Market in Spain
9.3.7 Rest of Europe
9.4 Asia-Pacific
9.4.1 Driver
9.4.1.1 Rise in Demand for Meat Products to Lead Growth
9.4.2 China
9.4.2.1 Rise in Economic Development Spurs the Growth
9.4.3 Japan
9.4.3.1 Increasing Demand for Compound Feed Leads to Increased Demand for Palatability Enhancers & Modifiers
9.4.4 India
9.4.4.1 Increasing Per Capita Consumption of Animal Products Influences Animal Palatability Enhancers & Modifiers Market
9.4.5 Thailand
9.4.6 Vietnam
9.4.7 Indonesia
9.4.8 Rest of Asia-Pacific
9.5 Rest of the World
9.5.1 Driver
9.5.1.1 Increasing Disposable Income Drives Steady Growth in Palatability Enhancers in ROW Region
9.5.2 Brazil
9.5.2.1 Bovine Meat Export Demand Promotes Growth of Animal Palatability Enhancers & Modifiers
9.5.3 Argentina
9.5.3.1 Increasing Meat Production Encourages the Growth of the Palatability Enhancers & Modifiers Market
9.5.4 South Africa
9.5.5 Egypt
9.5.6 Other Countries in ROW
10 Competitive Landscape (Page No. - 196)
10.1 Introduction
10.1.1 Key Market Strategies
10.2 Mergers & Acquisitions
10.3 Expansions
10.4 New Product Developments & Other Developments
11 Company Profiles (Page No. - 206)
(Company At A Glance, Recent Financials, Products & Services, Strategies & Insights, & Recent Developments)*
11.1 Associated British Foods PLC
11.2 Diana Group
11.3 E. I. Dupont
11.4 Eli Lilly and Company
11.5 Ensign-Bickford Industries Inc.
11.6 Ferrer
11.7 Kemin Europa
11.8 Kent Feeds Inc.
11.9 Kerry Group PLC
11.1 Tanke International Group
*Details on Company At A Glance, Recent Financials, Products & Services, Strategies & Insights, & Recent Developments Might Not Be Captured in Case of Unlisted Companies.
List of Tables (126 Tables)
Table 1 Animal Palatability Enhancers & Modifiers Market Estimation
Table 2 Taste Buds In Animals
Table 3 Palatability Enhancers & Modifiers Market Size, By Category, 2012-2019 ($Million)
Table 4 Feed Flavors Market Size, By Type, 2012-2019 ($Million)
Table 5 Feed Sweeteners Market Size, By Type, 2012-2019 ($Million)
Table 6 Feed Texturants Market Size, By Type, 2012-2019 ($Million)
Table 7 Animal Palatability Enhancers & Modifiers Market Size, By Livestock, 2012-2019 ($Million)
Table 8 Swine Animal Palatability Enhancers & Modifiers Market Size, By Geography, 2012-2019 ($Million)
Table 9 Poultry Animal Palatability Enhancers & Modifiers Market Size, By Geography, 2012-2019 ($Million)
Table 10 Cattle Feed: Palatability Enhancers & Modifiers Market Size, By Geography, 2012-2019 ($Million)
Table 11 Aquaculture: Animal Palatability Enhancers & Modifiers Market Size, By Geography, 2012-2019 ($Million)
Table 12 Pet Feed: Palatability Enhancers & Modifiers Market Size, By Geography, 2012-2019 ($Million)
Table 13 Other Feed: Palatability Enhancers Market Size, By Geography, 2012-2019 ($Million)
Table 14 Animal Palatability Enhancers & Modifiers Market Size, By Geography, 2012-2019 ($Million)
Table 15 Feed Flavors Market Size, By Geography, 2012-2019 ($Million)
Table 16 Feed Sweeteners Market Size, By Geography, 2012-2019 ($Million)
Table 17 Feed Texturants Market Size, By Geography, 2012-2019 ($Million)
Table 18 North America: Animal Palatability Enhancers & Modifiers Market Size, By Category, 2012-2019 ($Million)
Table 19 North America: Animal Palatability Enhancers & Modifiers, By Type, 2012-2019 ($Million)
Table 20 North America: Animal Palatability Enhancers & Modifiers Market Size, By Country, 2012-2019 ($Million)
Table 21 North America: Feed Flavors Market Size, By Type, 2012-2019 ($Million)
Table 22 North America: Feed Flavors Market Size, By Country 2012-2019 ($Million)
Table 23 North America: Feed Sweeteners Market Size, By Type, 2012-2019 ($Million)
Table 24 North America: Feed Sweeteners Market Size, By Country, 2012-2019 ($Million)
Table 25 North America: Feed Texturants Market Size, By Type, 2012-2019 ($Million)
Table 26 North America: Feed Texturants Market Size, By Country, 2012-2019 ($Million)
Table 27 North America: Animal Palatability Enhancers & Modifiers Market Size, By Livestock, 2012-2019 ($Million)
Table 28 U.S.: Feed Flavors Market Size, By Type, 2012-2019 ($Million)
Table 29 U.S.: Feed Sweeteners Market Size, By Type, 2012-2019 ($Million)
Table 30 U.S.: Feed Texturants Market Size, By Type, 2012-2019 ($Million)
Table 31 Canada: Feed Flavors Market Size, By Type, 2012-2019 ($Million)
Table 32 Canada: Feed Sweeteners Market Size, By Type, 2012-2019 ($Million)
Table 33 Canada: Feed Texturants Market Size, By Type, 2012-2019 ($Million)
Table 34 Mexico: Feed Flavors Market Size, By Type, 2012-2019 ($Million)
Table 35 Mexico: Feed Sweeteners Market Size, By Type, 2012-2019 ($Million)
Table 36 Mexico: Feed Texturants Market Size, By Type, 2012-2019 ($Million)
Table 37 Europe: Animal Palatability Enhancers & Modifiers Market Size, By Category, 2012-2019 ($Million)
Table 38 Europe: Animal Palatability Enhancers & Modifiers Market Size, By Type, 2012-2019 ($Million)
Table 39 Europe: Animal Palatability Enhancers & Modifiers Market Size, By Country, 2012-2019 ($Million)
Table 40 Europe: Feed Flavors Market Size, By Type, 2012-2019 ($Million)
Table 41 Europe: Feed Flavors Market Size, By Country, 2012-2019 ($Million)
Table 42 Europe: Feed Sweeteners Market Size, By Type, 2012-2019 ($Million)
Table 43 Europe: Feed Sweeteners Market Size, By Country, 2012-2019 ($Million)
Table 44 Europe: Feed Texturants Market Size, By Type, 2012-2019 ($Million)
Table 45 Europe: Feed Texturants Market Size, By Country, 2012-2019 ($Million)
Table 46 Europe: Animal Palatability Enhancers & Modifiers Market Size, By Livestock, 2012-2019 ($Million)
Table 47 Germany: Feed Flavors Market Size, By Type, 2012-2019 ($Million)
Table 48 Germany: Feed Sweeteners Market Size, By Type, 2012-2019 ($Million)
Table 49 Germany: Feed Texturants Market Size, By Type, 2012-2019 ($Million)
Table 50 France: Feed Flavors Market Size, By Type, 2012-2019 ($Million)
Table 51 France: Feed Sweeteners Market Size, By Type, 2012-2019 ($Million)
Table 52 France: Feed Texturants Market Size, By Type, 2012-2019 ($Million)
Table 53 U.K.: Feed Flavors Market Size, By Type, 2012-2019 ($Million)
Table 54 U.K.: Feed Sweeteners Market Size, By Type, 2012-2019 ($Million)
Table 55 U.K.: Feed Texturants Market Size, By Type, 2012-2019 ($Million)
Table 56 Italy: Feed Flavors Market Size, By Type, 2012-2019 ($Million)
Table 57 Italy: Feed Sweeteners Market Size, By Type, 2012-2019 ($Million)
Table 58 Italy: Feed Texturants Market Size, By Type, 2012-2019 ($Million)
Table 59 Spain: Feed Flavors Market Size, By Type, 2012-2019 ($Million)
Table 60 Spain: Feed Sweeteners Market Size, By Type, 2012-2019 ($Million)
Table 61 Spain: Feed Texturants Market Size, By Type, 2012-2019 ($Million)
Table 62 Rest of Europe: Feed Flavors Market Size, By Type, 2012-2019 ($Million)
Table 63 Rest of Europe: Feed Sweeteners Market Size, By Type, 2012-2019 ($Million)
Table 64 Rest of Europe: Feed Texturants Market Size, By Type, 2012-2019 ($Million)
Table 65 Asia-Pacific: Animal Palatability Enhancers & Modifiers Market Size, By Category, 2012-2019 ($Million)
Table 66 Asia-Pacific: Market Size, By Type, 2012-2019 ($Million)
Table 67 Asia-Pacific: Market Size, By Country, 2012-2019 ($Million)
Table 68 Asia-Pacific: Market Size, By Livestock, 2012-2019 ($Million)
Table 69 China: Feed Flavors Market Size, By Type, 2012-2019 ($Million)
Table 70 China: Feed Sweeteners Market Size, By Type, 2012-2019 ($Million)
Table 71 China: Feed Texturants Market Size, By Type, 2012-2019 ($Million)
Table 72 Japan: Feed Flavors Market Size, By Type, 2012-2019 ($Million)
Table 73 Japan: Feed Sweeteners Market Size, By Type, 2012-2019 ($Million)
Table 74 Japan: Feed Texturants Market Size, By Type, 2012-2019 ($Million)
Table 75 India: Feed Flavors Market Size, By Type, 2012-2019 ($Million)
Table 76 India: Feed Sweeteners Market Size, By Type, 2012-2019 ($Million)
Table 77 India: Feed Texturants Market Size, By Type, 2012-2019 ($Million)
Table 78 Thailand: Feed Flavors Market Size, By Type, 2012-2019 ($Million)
Table 79 Thailand: Feed Sweeteners Market Size, By Type, 2012-2019 ($Million)
Table 80 Thailand: Feed Texturants Market Size, By Type, 2012-2019 ($Million)
Table 81 Vietnam: Feed Flavors Market Size, By Type, 2012-2019 ($Million)
Table 82 Vietnam: Feed Sweeteners Market Size, By Type, 2012-2019 ($Million)
Table 83 Vietnam: Feed Texturants Market Size, By Type, 2012-2019 ($Million)
Table 84 Indonesia: Feed Flavors Market Size, By Type, 2012-2019 ($Million)
Table 85 Indonesia: Feed Sweeteners Market Size, By Type, 2012-2019 ($Million)
Table 86 Indonesia: Feed Texturants Market Size, By Type, 2012-2019 ($Million)
Table 87 *Rest of Asia-Pacific: Feed Flavors Market Size, By Type, 2012-2019 ($Million)
Table 88 Rest of Asia-Pacific: Feed Sweeteners Market Size, By Type, 2012-2019 ($Million)
Table 89 Rest of Asia-Pacific: Feed Texturants Market Size, By Type, 2012-2019 ($Million)
Table 90 ROW: Animal Palatability Enhancers & Modifiers Market Size, By Category, 2012-2019 ($Million)
Table 91 ROW: Animal Palatability Enhancers & Modifiers Market Size, By Type, 2012-2019 ($Million)
Table 92 ROW: Market Size, By Country, 2012-2019 ($Million)
Table 93 ROW: Feed Flavors Market Size, By Type, 2012-2019 ($Million)
Table 94 ROW: Feed Flavors Market Size, By Country, 2012-2019 ($Million)
Table 95 ROW: Feed Sweeteners Market Size, By Type, 2012-2019 ($Million)
Table 96 ROW: Feed Sweeteners Market Size, By Country, 2012-2019 ($Million)
Table 97 ROW: Feed Texturants Market Size, By Type, 2012-2019 ($Million)
Table 98 ROW: Feed Texturants Market Size, By Country, 2012-2019 ($Million)
Table 99 ROW: Animal Palatability Enhancers & Modifiers Market Size, By Livestock, 2012-2019 ($Million)
Table 100 Brazil: Feed Flavors Market Size, By Type, 2012-2019 ($Million)
Table 101 Brazil: Feed Sweeteners Market Size, By Type, 2012-2019 ($Million)
Table 102 Brazil: Feed Texturants Market Size, By Type, 2012-2019 ($Million)
Table 103 Argentina: Feed Flavors Market Size, By Type, 2012-2019 ($Million)
Table 104 Argentina: Feed Sweeteners Market Size, By Type, 2012-2019 ($Million)
Table 105 Argentina: Feed Texturants Market Size, By Type, 2012-2019 ($Million)
Table 106 South Africa: Feed Flavors Market Size, By Type, 2012-2019 ($Million)
Table 107 South Africa: Feed Sweeteners Market Size, By Type, 2012-2019 ($Million)
Table 108 South Africa: Feed Texturants Market Size, By Type, 2012-2019 ($Million)
Table 109 Egypt: Feed Flavors Market Size, By Type, 2012-2019 ($Million)
Table 110 Egypt: Feed Sweeteners Market Size, By Type, 2012-2019 ($Million)
Table 111 Egypt: Feed Texturants Market Size, By Type, 2012-2019 ($Million)
Table 112 Other Countries in ROW: Feed Flavors Market Size, By Type, 2012-2019 ($Million)
Table 113 Other Countries in ROW: Feed Sweeteners Market Size, By Type, 2012-2019 ($Million)
Table 114 Other Countries in ROW: Feed Texturants Market Size, By Type, 2012-2019 ($Million)
Table 115 Mergers & Acquisitions, 2010-2014
Table 116 Expansion, 2011-2014
Table 117 New Product Developments & Other Developments, 2011-2014
Table 118 ABF: Products &their Description
Table 119 Diana: Products &Their Description
Table 120 Dupont: Product & Its Description
Table 121 Eli Lilly and Company: Products & Their Description
Table 122 Ferrer: Products & Their Description
Table 123 Kemin: Products & Their Description
Table 124 Kent Feeds: Products & Their Description
Table 125 Kerry: Products & Their Description
Table 126 Tanke: Products & Their Description
List of Figures (20 Figures)
Figure 1 Research Methodology
Figure 2 Animal Palatability Enhancers & Modifiers: Market Size Estimation Methodology
Figure 3 Market Share (By Value), 2013
Figure 4 Market Segmentation
Figure 5 Market Size, 2013 ($Million)
Figure 6 Asia-Pacific: Animal Palatability Enhancers & Modifiers Market Share, 2013 ($Million)
Figure 7 Market Share, By Geography, 2013 ($Million)
Figure 8 Animal Palatability Enhancers & Modifiers Market Size, By Country, 2013 ($Million)
Figure 9 Market Size, By Livestock, 2013 ($Million)
Figure 10 Animal Feed Market Size, By Livestock 2013 (Million Metric tons)
Figure 11 Animal Feed Market Share, By Livestock, (Volume), 2013
Figure 12 Types of Palatability Enhancers
Figure 13 Animal Palatability Enhancers: Manufacturing & Distribution Channels
Figure 14 Animal Palatability Enhancers & Modifiers: Market Share Analysis, By Company, 2013
Figure 15 Sensory & Metabolic Inputs for Palatability Perception
Figure 16 Schematic Diagram of the Response of the Senses to Feed Characteristics
Figure 17 Impact Analysis of Drivers & Restraints in Animal Palatability Enhancers & Modifiers Market
Figure 18 Animal Palatability Enhancers & Modifiers: Porter�s Five forces Model
Figure 19 Market Share (Value), By Growth Strategy, 2009-2014
Figure 20 Animal Palatability & Modifieres Enhancers, Key Developments, 2009-2014


Growth opportunities and latent adjacency in Feed Palatability Enhancers & Modifiers Market