Fertigation & Chemigation Market by Agri Inputs (Fertilizers, Herbicides, Insecticides, & Fungicides), Application (Agriculture, Landscape, & Greenhouse), Crop Type, Irrigation Systems, & by Region - Global Trends and Forecast to 2020


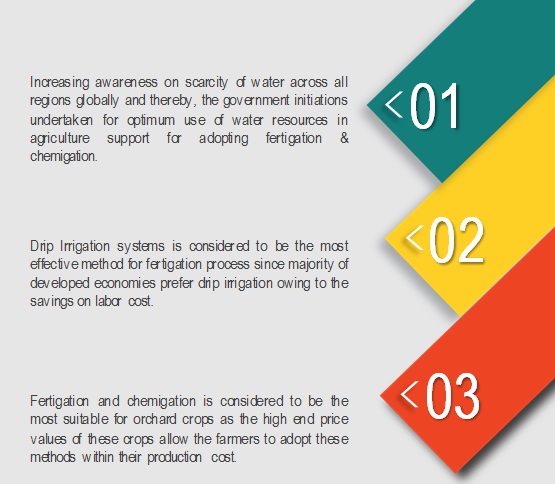
The overall fertigation & chemigation market is projected to grow from USD 31.06 billion in 2015 to USD 42.18 billion by 2020, at a CAGR of 6.3% from 2015 to 2020. Fertigation & chemigation is the slow application of nutrients and water on or below the soil by surface drip, subsurface drip, bubbler, and micro-sprinkler systems. Fertigation & chemigations offer several advantages, such as minimum wastage of water, minimal labor requirement, and ability to provide protection against drought conditions, which, in turn, help in the growth of the market. The fertigation & chemigation market has been expanding with the increasing scarcity of water across the globe and strong progress and initiatives taken by emerging economies through water replenishment and programs. Government initiatives for optimum use of water resources in agriculture and further support for adopting fertigation & chemigation in the form of subsidies would put the market on a strong growth curve in the coming years. The base year considered for the study is 2014, and the forecast has been provided for the period between 2015 and 2020.
Market Dynamics
Drivers
- Efficiency of nutrient utilization
- Nutrient leaching losses are minimized
- Improved plant growth, yield, and quality of crops
- Increasing demand for quality food products
Restraints
- Critical nutrient application doses
- High initial investments
Opportunities
- Strong progress in new and emerging markets
Challenges
- Improving efficiency
The high efficiency in nutrient utilization drives the global fertigation & chemigation market
Fertigation is a method of fertilizer application where the nutrients are added into the irrigation water and supplied through the drip system. Fertigation and microirrigation offer the potential for specific control of nutrients as well as water. A main benefit of fertigation is that it provides greater flexibility and control over the applied nutrients as compared to conventional broadcast applications. Fertilizers are applied when required and in small doses. In fertigation, fertilizer solution is distributed through the irrigation system. The efficiency of this method increases due to the very high availability of the nutrients. In this method, both liquid fertilizers as well as water-soluble fertilizers are used, and their efficiency increases by 80 to 90% as the nutrients are supplied near the active root zone through fertigation which results in greater absorption by the crops.
The following are the major objectives of the study.
- To define, segment, and project the size of the fertigation & chemigation market, in terms of value, based on the agricultural input used, crop type, application, irrigation system, and region
- To provide detailed information regarding the crucial factors influencing the growth of the market (drivers, restraints, opportunities, and industry-specific challenges)
- To strategically analyze the micromarkets with respect to individual growth trends, prospects, and contribution to the total market
- To analyze opportunities in the market for stakeholders and provide details of the competitive landscape for market leaders
- To project the size of the market, in terms of value (USD million) in the four main regions, namely, North America, Europe, Asia Pacific, and Rest of the World (RoW) along with their respective countries
- To strategically profile the key players and comprehensively analyze their market share and core competencies
- To analyze strategic approaches such as new product launches, acquisitions, investments, expansions, partnerships, agreements, joint ventures, and collaborations in the fertigation & chemigation market
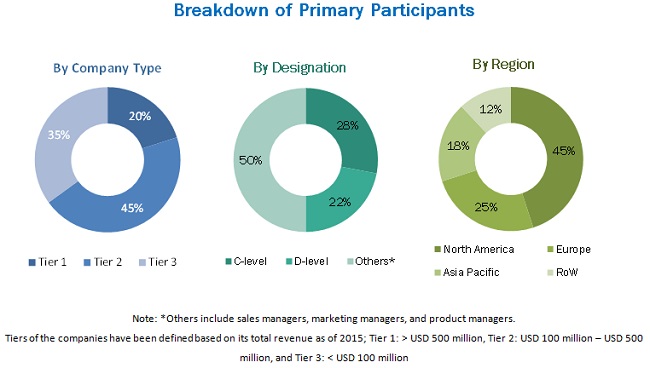
During this research study, major players operating in the fertigation & chemigation market in various regions have been identified, and their offerings, regional presence, and distribution channels have been analyzed through in-depth discussions. Top-down and bottom-up approaches have been used to determine the overall market size. Sizes of the other individual markets have been estimated using the percentage splits obtained through secondary sources such as Hoovers, Bloomberg BusinessWeek, and Factiva, along with primary respondents. The entire procedure includes the study of the annual and financial reports of the top market players and extensive interviews with industry experts such as CEOs, VPs, directors, and marketing executives for key insights (both qualitative and quantitative) pertaining to the market. The figure below shows the breakdown of the primaries on the basis of the company type, designation, and region considered during the research study.
To know about the assumptions considered for the study, download the pdf brochure
The fertigation & chemigation market comprises a network of players involved in the research and product development; raw material supply; component manufacturing; distribution and sale; and post-sales services. Key players considered in the analysis of the fertigation & chemigation market are The Toro Company (US), Jain Irrigation Systems Ltd. (India), Lindsay Corporation (US), Valmont Industries, Inc. (US), and Rain Bird Corporation (US), EPC Industries Limited (India), Netafim (Israel), Nelson Irrigation Corporation (US), Rivulis Irrigation (Israel), and T-L Irrigation Co. (US).
Major Market Developments
- In February 2015, Jain Irrigation Systems Ltd. acquired the assets of PureSense Environmental Inc., (US). The acquisition combined PureSense’s field monitoring and irrigation management technology with Jain’s global irrigation manufacturing and food production platform to provide farmers with more access and capability to increase crop yields.
- In September 2014, Toro released the Aqua-Clear fiberglass sand media filter product line designed for drip irrigation systems operating up to 75 psi, and available in 18-, 24-, 30-, and 36-inch systems.
- In January 2015, Lindsay Corporation completed the acquisition of Elecsys Corporation (US), a provider of machine-to-machine (M2M) technology solutions and custom electronic systems. The acquisition has led to an addition to Lindsay Corporation’s long-term strategy of leading the market in advanced technologies for managing water use efficiency.
- In September 2014, Toro released the Aqua-Clear fiberglass sand media filter product line designed for drip irrigation systems operating up to 75 psi, and available in 18-, 24-, 30-, and 36-inch systems.
Target Audience
- Raw material suppliers
- End users, which include the following:
- Agricultural producers
- Companies (manufacturers/suppliers) involved in the agricultural input sector
- Research centers, laboratories, and scientific institutes
- Retailers
- Commercial research & development (R&D) institutions and financial institutions
- Importers and exporters of agricultural inputs
- Irrigation system providers, traders, distributors, and suppliers
- Government and research organizations
- Trade associations and industry bodies
Report Scope
By Crop Type
- Field crops
- Plantation crop
- Orchard crops
- Forage & turf grasses
By Agricultural Input
- Fertilizers
- Insecticides
- Fungicides
- Herbicides
- Others (includes acaricides, nematicides, and micronutrients)
By Application:
- Agriculture irrigation
- Landscape irrigation
- Greenhouse irrigation
- Others (includes soilless culture)
By Irrigation System:
- Drip
- Sprinkler
By Region
- North America
- Europe
- Asia Pacific
- Rest of the World (RoW)
Critical questions which the report answers
- What are the application areas that the fertigation & chemigation companies have been exploring?
- Which are the key players in the market and how intense is the competition?
Available Customizations
Based on the given market data, MarketsandMarkets offers customizations in the reports as per the client’s specific requirements. The available customization options are as follows:
Regional Analysis
- Further breakdown of the Rest of Europe fertigation & chemigation market into Turkey, Poland, the Netherlands, and Greece.
- Further breakdown of the Rest of Asia Pacific fertigation & chemigation market into Indonesia, Myanmar, and Vietnam.
- Further breakdown of the Rest of the World fertigation & chemigation market into Paraguay, Uruguay, and Bolivia.
Company Information
- Detailed analysis and profiling of additional market players (up to five)
The overall fertigation & chemigation market is projected to grow from USD 31.06 billion in 2015 to USD 42.18 billion by 2020, at a CAGR of 6.3% from 2015 to 2020. Water-scarce regions and agriculture-based countries are the primary targets of the industry. Factors such as increasing population, resultant food demand, and increasing water scarcity are the major driving factors for this market. Moreover, fertigation & chemigation help in increasing crop production as well as its quality.
With the rapid increase in population and industrialization, the pressure on the available water resources has increased in terms of both the quantity of water required and the quality standard. Fertigation & chemigation is the slow application of nutrients and water on or below the soil by surface drip, subsurface drip, bubbler, and microsprinkler systems. In the areas with a scarcity of labor need to be irrigated precisely and frequently with minimum wastage of time and water, it is better to invest in fertigation & chemigation. It has been gaining significance as it helps in the protection against droughts and it is a low-cost irrigation technique. On the other hand, increasing water scarcity and improvement in crop yield &quality are also some other factors that help in the growth of the market.
The fertigation & chemigation market has been segmented, on the basis of agricultural input, into fertilizer, insecticide, fungicide, herbicide, and others. The market for fertilizers is expected to grow at the highest CAGR between 2015 and 2020. Not only is the segment projected to grow the fastest, but fertilizers are also the inputs that are most commonly applied through irrigation systems. Owing to the high demand for crop inputs for nutrition, fertilizers are projected to grow at a faster rate in comparison to pesticides.
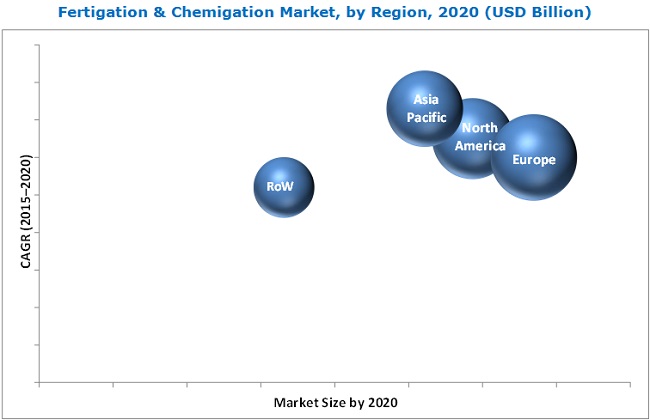
The fertigation & chemigation market in Asia Pacific is projected to grow at the highest CAGR during the forecast period. Fertigation & chemigation have a huge market potential in the Asia Pacific region due to the increased need for efficient use of fertilizers for all crop types. The increasing penetration of fertigation & chemigation processes through subsidies has limited the production cost and also the influx of global players, along with the emergence of regional players, have been contributing to the growth of the market.
Application of fertilizers and pesticides through irrigation systems are witnessed to be an effective method which can drive the market growth
Agriculture Irrigation
Agriculture irrigation is the technique to applying water into land or soil, and has various uses such as agricultural crop growth, maintenance of landscapes, and revitalization of dryland area. The use of fertigation & chemigation as an application for agriculture irrigation has favorable results of equal nutrient and water distribution to crops so that the absorption of nutrients and water is at an optimum level. Irrigation in agriculture has been gaining pace in the Asian countries in accordance with the changing climatic conditions and growing economies.
Landscape Irrigation
Landscape irrigation is mainly adapted to provide water supplements when rainfall has not been sufficient, to maintain large landscapes such as lawns and gardens. Moreover, landscape irrigation makes use of efficient distribution of water to preserve plant health in the process of protecting the environment and the water resources. Landscape irrigation is cost-efficient and sensitive to the environment which makes it sustainable to maintain the functionality of landscapes as well as maximize water levels wherever required.
Greenhouse Irrigation
Greenhouse irrigation is adopted for crops that require a regulated climatic conditioning. The various methods that can be used are drip tubing, overhead watering, mat irrigation, perimeter irrigation, and sprinkler irrigation. Drip irrigation is an effective method as it allows water to drip slowly to the roots of the crops through various networks, such as pipes, emitters, and valves. Due to this, the loss of fertilizers and nutrients is reduced to a minimum, and the moisture content in crops can be sustained.
Critical questions the report answers:
- What are the strategies adopted by players in the irrigation industry to cope with the developments in fertigation & chemigation market?
- What are the upcoming technology trends for fertigation & chemigation?
To speak to our analyst for a discussion on the above findings, click Speak to Analyst
The high initial investments are a major factor restraining the growth of the market. Generally, fertigation systems and water-soluble fertilizers are considered most suitable for cost-intensive agriculture such as orchards, nurseries, greenhouses, and vineyards. The initial investment cost for installing fertigation systems for water-soluble fertilizer application is high and is hence less suitable for low-value crops considering that the returns on investments may be low. Also, the nutrient application is one of the important factors in addition to fertilizer dose amongst different agronomic practices, which influence the growth and yield of crops. The nutrient application in fertigation is critical, as overdosage may cause the yield losses.
Key players in the market include Valmont Industries (US), The Toro Company (US), Jain Irrigation Systems Ltd. (India), Lindsay Corporation (US), Rivulis Irrigation (Israel), Rain Bird Corporation (US), Netafim Limited (Israel), EPC Industrie Limited (India), T-L Irrigation (US), and Nelson Irrigation Corporation (US). These players are increasingly collaborating and partnering with SMEs to develop and introduce new technologies and products in the market.
 Exclusive indicates content/data unique to MarketsandMarkets and not available with any competitors.
Table of Contents
1 Introduction (Page No. - 12)
1.1 Objectives of the Study
1.2 Market Definition
1.3 Study Scope
1.3.1 Years Considered for the Study
1.4 Currency
1.5 Stakeholders
2 Research Methodology (Page No. - 16)
2.1 Research Data
2.1.1 Secondary Data
2.1.1.1 Key Data From Secondary Sources
2.1.2 Primary Data
2.1.2.1 Key Data From Primary Sources
2.1.2.2 Key Industry Insights
2.1.2.2.1 Breakdown of Primaries
2.2 Factor Analysis
2.2.1 Introduction
2.2.2 Demand-Side Analysis
2.2.2.1 Rising Population and Shrinking Arable Land
2.2.2.2 Growing Population and Declining Workforce in Farms
2.2.2.3 Water Scarcity: Major Cause to Improved Efficiency in Irrigation Systems
2.2.3 Supply-Side Analysis
2.2.3.1 Parent Market Analysis: Government Initiatives to Promote Irrigation Equipment Industry
2.3 Market Size Estimation
2.4 Market Breakdown & Data Triangulation
2.5 Research Assumptions
2.5.1 Assumptions
2.5.2 Limitations
3 Executive Summary (Page No. - 29)
4 Premium Insights (Page No. - 34)
4.1 Attractive Opportunities in Fertigation & Chemigation Market
4.2 Fertilizers: Leading Segment, By Agri Input
4.3 Orchard Crops: Largest Market for Next Five Years
4.4 India & China: Fastest-Growing Fertigation & Chemigation Market in Asia-Pacific
4.5 Life Cycle Analysis, By Region
5 Market Overview (Page No. - 40)
Key Findings
5.1 Introduction
5.2 History & Evolution
5.3 Market Segmentation
5.3.1 Fertigation & Chemigation Market, By Agri Inputs
5.3.2 Market, By Crop Type
5.3.3 Market, By Application
5.3.4 Market, By Irrigation Systems
5.4 Market Dynamics
5.4.1 Drivers
5.4.1.1 Efficiency of Nutrient Utilization is Excellent
5.4.1.2 Nutrient Leaching Losses are Minimized
5.4.1.3 Improved Plant Growth, Yield, and Quality of Crops
5.4.1.4 Rising Population and Increasing Demand
5.4.2 Restraints
5.4.2.1 Critical Nutrient Application Doses
5.4.2.2 High Initial Investments
5.4.3 Opportunities
5.4.3.1 Strong Progress in New and Emerging Markets
5.4.4 Challenges
5.4.4.1 Improving Efficiency
6 Industry Trends (Page No. - 48)
6.1 Introduction
6.2 Market Trends & Insights
6.2.1 Orchard Crops is the Fastest-Growing Segment for Fertigation & Chemigation Market
6.2.2 Drip Irrigation Segment Dominated the Fertigation & Chemigation Market in 2014
6.3 Value Chain Analysis
6.4 Supply Chain Analysis
6.5 Porter’s Five Forces Analysis
6.5.1 Intensity of Competitive Rivalry
6.5.2 Bargaining Power of Suppliers
6.5.3 Bargaining Power of Buyers
6.5.4 Threat of New Entrants
6.5.5 Threat of Substitutes
7 Fertigation & Chemigation Market, By Agri Input (Page No. - 57)
7.1 Introduction
7.2 Fertilizer
7.3 Insecticide
7.4 Fungicide
7.5 Herbicide
7.6 Others
8 Fertigation & Chemigation Market, By Crop Type (Page No. - 65)
8.1 Introduction
8.2 Field Crops
8.3 Plantation Crops
8.4 Orchard Crops
8.5 Forage & Turf Grasses
9 Fertigation and Chemigation Market, By Application (Page No. - 72)
9.1 Introduction
9.2 Agriculture Irrigation
9.3 Landscape Irrigation
9.4 Greenhouse Irrigation
9.5 Others
10 Fertigation & Chemigation Market, By Irrigation System (Page No. - 79)
10.1 Introduction
10.2 Sprinkler Irrigation
10.3 Drip Irrigation
11 Fertigation & Chemigation Market, By Region (Page No. - 83)
11.1 Introduction
11.2 North America
11.2.1 U.S.
11.2.2 Canada
11.2.3 Mexico
11.2.4 Rest of North America
11.3 Europe
11.3.1 Russia
11.3.2 Spain
11.3.3 Italy
11.3.4 France
11.3.5 Ukraine
11.3.6 Germany
11.3.7 Romania
11.3.8 U.K.
11.3.9 Rest of Europe
11.4 Asia-Pacific
11.4.1 China
11.4.2 India
11.4.3 Iran
11.4.4 Australia
11.4.5 Japan
11.4.6 Israel
11.4.7 Rest of Asia-Pacific
11.5 Rest of the World (RoW)
11.5.1 Brazil
11.5.2 South Africa
11.5.3 Saudi Arabia
11.5.4 Korea
11.5.5 Egypt
11.5.6 Others in RoW
12 Regulatory Framework & Government Policies (Page No. - 123)
12.1 Introduction
12.2 U.S.
12.3 Canada
12.4 European Union
12.5 U.K.
12.6 Japan
12.7 China
12.8 South Korea
12.9 India
13 Competitive Landscape (Page No. - 126)
13.1 Overview
13.2 Fertigation & Chemigation: Growth Strategies, By Company
13.3 Competitive Situation & Trends
13.4 New Product Launches
13.5 Acquisitions
13.6 Agreements, Collaborations & Partnerships
13.7 Expansions & Investments
14 Company Profiles (Page No. - 143)
14.1 Introduction
14.2 Valmont Industries, Inc.
14.3 The Toro Company
14.4 Jain Irrigation Systems Limited
14.5 Lindsay Corporation
14.6 Rivulis Irrigation
14.7 Netafim
14.8 Rain Bird Corporation
14.9 T-L Irrigation Co.
14.10 Nelson Irrigation Corporation
14.11 EPC Industrie Limited
15 Appendix (Page No. - 177)
15.1 Industry Insights From Experts
15.2 Discussion Guide
15.3 Introducing RT: Real-Time Market Intelligence
15.4 Available Customizations
15.5 Related Reports
List of Tables (71 Tables)
Table 1 Fertilizer Use Efficiency (%) of Various Application Methods
Table 2 Global: Fertigation & Chemigation Market Size, By Agri Input, 2013–2020 (USD Million)
Table 3 Fertilizers Market Size, By Region, 2013–2020 (USD Million)
Table 4 Insecticide Market Size, By Region, 2013–2020 (USD Million)
Table 5 Fungicide Market Size, By Region, 2013–2020 (USD Million)
Table 6 Herbicide Market Size, By Region, 2013–2020 (USD Million)
Table 7 Others Market Size, By Region, 2013–2020 (USD Million)
Table 8 Global: Fertigation & Chemigation Market Size, By Crop Type, 2013–2020 (USD Million)
Table 9 Fertigation & Chemigation in Field Cropsmarket Size, By Region, 2013–2020 (USD Million)
Table 10 Fertigation & Chemigation in Plantation Cropsmarket Size, By Region, 2013–2020 (USD Million)
Table 11 Fertigation & Chemigation in Orchard Cropsmarket Size, By Region, 2013–2020 (USD Million)
Table 12 Fertigation & Chemigation in Forage & Turf Grassesmarket Size, By Region, 2013–2020 (USD Million)
Table 13 Global: Fertigation & Chemigation Market Size, By Application, 2013-2020 (USD Million)
Table 14 Agriculture Irrigation: Market Size For Fertigation & Chemigation, By Region, 2013-2020 (USD Million)
Table 15 Landscape Irrigation: Market Size For Fertigation & Chemigation, By Region, 2013-2020 (USD Million)
Table 16 Greenhouse Irrigation: Market Size For Fertigation & Chemigation, By Region, 2013-2020 (USD Million)
Table 17 Others: Market Size For Fertigation & Chemigation, By Region, 2013-2020 (USD Million)
Table 18 Fertigation & Chemigation Market Size, By Irrigation System, 2013–2020 (USD Million)
Table 19 Sprinkler Irrigation Market Size, By Region, 2013–2020 (USD Million)
Table 20 Drip Irrigation Market Size, By Region, 2013–2020 (USD Million)
Table 21 Market Size For Fertigation & Chemigation, By Region, 2013-2020 (USD Million)
Table 22 North America: Fertigation & Chemigation Market Size For Fertigation & Chemigation, By Country, 2013-2020 (USD Million)
Table 23 North America: Market Size, By Agri Input, 2013-2020 (USD Million)
Table 24 North America: Market Size For Fertigation & Chemigation, By Crop Type, 2013-2020 (USD Million)
Table 25 North America: Market Size For Fertigation & Chemigation, By Application, 2013-2020 (USD Million)
Table 26 North America: Market Size For Fertigation & Chemigation, By Irrigation System, 2013-2020 (USD Million)
Table 27 U.S.: Fertigation & Chemigation Market Size, By Agri Input, 2013-2020 (USD Million)
Table 28 Canada: Market Size For Fertigation & Chemigation, By Agri Input, 2013-2020 (USD Million)
Table 29 Mexico: Market Size For Fertigation & Chemigation, By Agri Input, 2013-2020 (USD Million)
Table 30 Rest of North America: Market Size For Fertigation & Chemigation, By Agri Input, 2013-2020 (USD Million)
Table 31 Europe: Fertigation & Chemigation Market Size, By Country, 2013-2020 (USD Million)
Table 32 Europe: Market Size For Fertigation & Chemigation, By Agri Input, 2013-2020 (USD Million)
Table 33 Europe: Market Size For Fertigation & Chemigation, By Crop Type, 2013-2020 (USD Million)
Table 34 Europe: Market Size For Fertigation & Chemigation, By Application, 2013-2020 (USD Million)
Table 35 Europe: Market Size For Fertigation & Chemigation, By Irrigation System, 2013-2020 (USD Million)
Table 36 Russia: Fertigation & Chemigation Market Size For Fertigation & Chemigation, By Agri Input, 2013-2020 (USD Million)
Table 37 Spain: Market Size For Fertigation & Chemigation, By Agri Input, 2013-2020 (USD Million)
Table 38 Italy: Market Size For Fertigation & Chemigation, By Agri Input, 2013-2020 (USD Million)
Table 39 France: Market Size For Fertigation & Chemigation, By Agri Input, 2013-2020 (USD Million)
Table 40 Ukraine: Market Size For Fertigation & Chemigation For Fertigation & Chemigation, By Agri Input, 2013-2020 (USD Million)
Table 41 Germany: Fertigation & Chemigation Market Size For Fertigation & Chemigation, By Agri Input, 2013-2020 (USD Million)
Table 42 Romania: Market Size For Fertigation & Chemigation, By Agri Input, 2013-2020 (USD Million)
Table 43 U.K.: Market Size For Fertigation & Chemigation, By Agri Input, 2013-2020 (USD Million)
Table 44 Rest of Europe: Market Size For Fertigation & Chemigation, By Agri Input, 2013-2020 (USD Million)
Table 45 Asia-Pacific: Fertigation & Chemigation Market Size, By Country, 2013-2020 (USD Million)
Table 46 Asia-Pacific: Market Size For Fertigation & Chemigation, By Agri Input, 2013-2020 (USD Million)
Table 47 Asia-Pacific: Market Size For Fertigation & Chemigation, By Crop Type, 2013-2020 (USD Million)
Table 48 Asia-Pacific: Market Size For Fertigation & Chemigation, By Application, 2013-2020 (USD Million)
Table 49 Asia-Pacific: Fertigation & ChemigationMarket Size, By Irrigation System, 2013-2020 (USD Million)
Table 50 China: Market Size For Fertigation & Chemigation, By Agri Input, 2013-2020 (USD Million)
Table 51 India: Fertigation & Chemigation Market Size, By Agri Input, 2013-2020 (USD Million)
Table 52 Iran: Market Size For Fertigation & Chemigation, By Agri Input, 2013-2020 (USD Million)
Table 53 Australia: Market Size For Fertigation & Chemigation, By Agri Input, 2013-2020 (USD Million)
Table 54 Japan: Market Size For Fertigation & Chemigation, By Agri Input, 2013-2020 (USD Million)
Table 55 Israel: Market Size For Fertigation & Chemigation For Fertigation & Chemigation, By Agri Input, 2013-2020 (USD Million)
Table 56 Rest of Asia-Pacific: Fertigation & Chemigation Market Size, By Agri Input, 2013-2020 (USD Million)
Table 57 RoW: Market Size For Fertigation & Chemigation, By Country, 2013-2020 (USD Million)
Table 58 RoW: Fertigation & Chemigation Market Size, By Agri Input, 2013-2020 (USD Million)
Table 59 RoW: Market Size For Fertigation & Chemigation, By Crop Type, 2013-2020 (USD Million)
Table 60 RoW: Market Size For Fertigation & Chemigation, By Application, 2013-2020 (USD Million)
Table 61 RoW: Market Size For Fertigation & Chemigation, By Irrigation System, 2013-2020 (USD Million)
Table 62 Brazil: Fertigation & Chemigation Market Size, By Agri Input, 2013-2020 (USD Million)
Table 63 South Africa: Market Size For Fertigation & Chemigation, By Agri Input, 2013-2020 (USD Million)
Table 64 Saudi Arabia: Market Size For Fertigation & Chemigation, By Agri Input, 2013-2020 (USD Million)
Table 65 Korea: Fertigation & Chemigation Market Size For Fertigation & Chemigation, By Agri Input, 2013-2020 (USD Million)
Table 66 Egypt: Fertigation & Chemigation Market Size For Fertigation & Chemigation, By Agri Input, 2013-2020 (USD Million)
Table 67 Others in RoW: Fertigation & Chemigation Market Size For Fertigation & Chemigation, By Agri Input, 2013-2020 (USD Million)
Table 68 New Product Launches, 2011–2015
Table 69 Acquisitions, 2011-2015
Table 70 Agreements & Collaborations, 2011-2015
Table 71 Expansions & Investments, 2011-2015
List of Figures (52 Figures)
Figure 1 Fertigation & Chemigation Market Segmentation
Figure 2 Research Design
Figure 3 Global Population is Projected to Reach ~9.5 Billion By 2050
Figure 4 Global Population Dynamics: Rising Urban Population, 1950–2030 (Percent)
Figure 5 Market Size Estimation Methodology: Bottom-Up Approach
Figure 6 Market Size Estimation Methodology: Top-Down Approach
Figure 7 Data Triangulation Methodology
Figure 8 Fertigation & Chemigation Market Growth Trend (2015 vs. 2020)
Figure 9 Fertigation & Chemigation Market Snapshot (2015 vs. 2020): Drip Irrigation Segment is Projected to Grow Rapidly During Forecast Period
Figure 10 Market Size For Fertigation & Chemigation, By Region
Figure 11 Fertigation & Chemigation Market Share (Value), By Region, 2014
Figure 12 Fertigation & Chemigation in Orchard Crops Projected to Be the Largest Market By 2020
Figure 13 Attractive Opportunities in this Market
Figure 14 Fertilizers Projected to Be the Largest Segment (2015-2020)
Figure 15 Orchard Crops Segment is Projected to Be Fastest Growing From 2015 to 2020
Figure 16 Drip Irrigation Segment Accounted for Largest Share in the Asia-Pacific Fertigation & Chemigation Market, 2014
Figure 17 Europe Holds Highest Share of Fertigation & Chemigation Market
Figure 18 History & Evolution of Fertigation & Chemigation Market
Figure 19 Fertigation & Chemigation Market Segmentation
Figure 20 Improving Nutrient Utilization Efficiency Drives this Market
Figure 21 Orchard Crops Segment to Dominate this Market (2015-2020)
Figure 22 Drip Irrigation Segment Accounted for the Maximum Share of the Fertigation & Chemigation Market in 2014
Figure 23 Fertigation & Chemigation Supply Chain Analysis
Figure 24 Porter’s Five Forces Analysis of Fertigation & Chemigation Market
Figure 25 Fertilizer Segment to See the Highest Growth
Figure 26 Orchard Crops to Lead the Market By 2020
Figure 27 Fertigation & Chemigation Market , By Application, 2015 vs. 2020 (USD Million)
Figure 28 Drip Irrigation Market to Be the Market Leader By 2020
Figure 29 Asia-Pacific to See Fastest Growth Between 2015 and 2020 (USD Million)
Figure 30 Regional Snapshot: Asia-Pacific to Be the Most Attractive Fertigation & Chemigation Market
Figure 31 North America Fertigation & Chemigation Market Snapshot: U.S. Accounting for the Largest Share
Figure 32 Europe Fertigation & Chemigation Market: Russia Accounting for the Largest Share
Figure 33 Asia-Pacific Fertigation & Chemigation Market Snapshot: India Accounting for the Largest Market Share
Figure 34 New Product Launches and Acquisitions: Preferred Growth Strategies By Key Companies
Figure 35 Fertigation & Chemigation: Market Share (Development), By Company, 2010–2015
Figure 36 Expanding Revenue Base Through New Product Launches, 2013–2015
Figure 37 New Product Launches: the Key Strategy, 2010–2015
Figure 38 Geographic Revenue Mix of Top Fertigation & Chemigation Systems Manufacturers
Figure 39 Valmont Industries, Inc.: Company Snapshot
Figure 40 Valmont Industries, Inc.: SWOT Analysis
Figure 41 The Toro Company: Company Snapshot
Figure 42 The Toro Company: SWOT Analysis
Figure 43 Jain Irrigation Systems Limited: Company Snapshot
Figure 44 Jain Irrigation Systems Ltd.: SWOT Analysis
Figure 45 Lindsay Corporation: Company Snapshot
Figure 46 Lindsay Corporation: SWOT Analysis
Figure 47 Rivulis Irrigation: Company Snapshot
Figure 48 Rivulis Irrigation: SWOT Analysis
Figure 49 Netafim: Company Snapshot
Figure 50 Rain Bird Corporation: Company Snapshot
Figure 51 Nelson Irrigation Corporation: Company Snapshot
Figure 52 EPC Industrie Ltd: Company Snapshot


Growth opportunities and latent adjacency in Fertigation & Chemigation Market