
Flame Retardants Market

Flame Retardants Market by Type (Aluminum Trihydrate, Antimony Oxide, Brominated), Application (Epoxy, Polyolefin, Unsaturated Polyester), End-Use Industry (Building & Construction, Electronics & Appliances), and Region - Global Forecast to 2030


OVERVIEW
Source: Secondary Research, Interviews with Experts, MarketsandMarkets Analysis
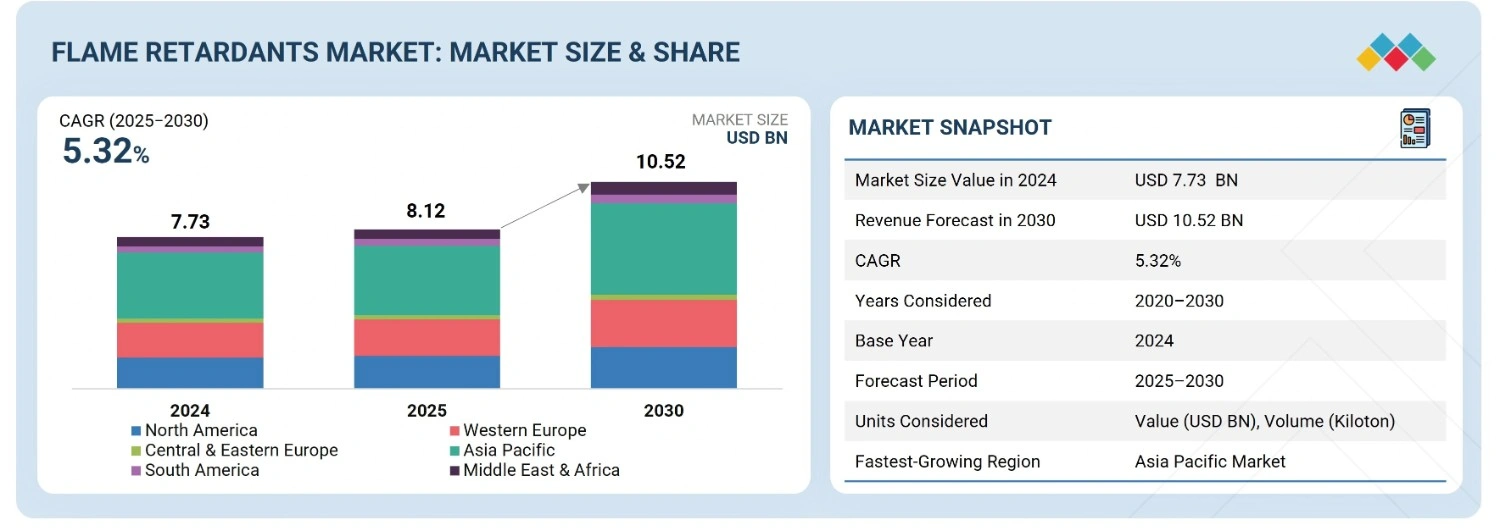
The flame retardants market is projected to reach USD 10.52 billion by 2030 from USD 8.12 million in 2025, at a CAGR of 5.32%. Flame retardants are key components in reducing the devastating effects of fire mishaps on people, property, and the environment. The most common elements used as flame retardants are bromine, chlorine, and phosphorus. The compounds of these elements are added to treat potentially flammable materials. Flame retardants stop the fire by interacting with the fire cycle in the gaseous phase and stopping the chemical chain reaction. They act in two ways - they either prevent the fire from starting or slow it down significantly. They do not alter the properties of the parent material. The global flame retardants market is growing rapidly due to increasing fire safety regulations, rising demand from electronics, construction, automotive, and textile industries, and the shift toward sustainable, halogen-free solutions
KEY TAKEAWAYS
-
BY TYPEPhosphorus-based flame retardants are growing at a CAGR of 5.77% and are gaining traction as they efficiently deliver char formation and thermal stability across diverse polymers, offer halogen-free compliance, and meet regulatory demands, particularly in electronics, construction, and transportation industries, thereby supporting sustainability goals.
-
BY APPLICATIONPolyolefins are the fastest-growing application in the flame retardants market at a CAGR of 5.66% this growth is majorly driven by their extensive use in automotive, electrical, and construction industries.
-
BY END-USE INDUSTRYElectronics & appliances industry is expected to lead the market in growth rate, growing at a 5.84% CAGR due to the rapid growth in consumer electronics, miniaturization, higher power densities (including batteries and IoT devices), stricter fire-safety regulations, and the shift to halogen-free retardants increase demand for reliable, low-toxicity solutions.
-
BY REGIONAsia Pacific is growing at a CAGR of 5.52% in the flame retardants market due to expanding manufacturing hubs in electronics, automotive, and construction, rising urbanization, stringent regional fire safety standards, and increasing adoption of sustainable materials.
-
COMPETITIVE LANDSCAPEThe major market players have adopted both organic and inorganic strategies including expansion, collaborations, acquisitions, and investments. For instance, J.M. Huber Corporation acquired The R.J. Marshall Company’s ATH, antimony-free flame retardant, and molybdate-based smoke suppressant assets, integrating them into its Huber Advanced Materials unit to strengthen its product portfolio and leadership in the North American flame retardant market.
The growth of flame retardants market is led by rising demand for products that improve fire protection, thermal insulation, and conformance with stringent building and product safety regulations across various industries. Flame retardants are crucial to decrease fire hazards, enhance material performance when exposed to high temperatures, and comply with changing safety regulations. Key end-use industries such as construction, electronics, transportation, and textiles are fueling market expansion due to the critical need for fire-retardant solutions in structural components, wiring systems, and consumer products. Additionally, producers are embracing next-generation flame retardant technologies to enhance performance, minimize environmental footprint, and align with global regulatory systems. The move towards halogen-free and environment-friendly flame retardants is gaining momentum. Increased infrastructure development, electrification, and public safety modernization drive product demand. Increased emphasis on occupant protection, sustainability, and material longevity motivates industries to apply high-performance flame retardants, thus driving the global market to key manufacturing economies.
TRENDS & DISRUPTIONS IMPACTING CUSTOMERS' CUSTOMERS
The megatrends, such as sustainability mandates, electrification, and circular economy principles, will reshape revenue models across industries. In the flame retardants market, emerging technologies and innovations include bio-based and halogen-free formulations, nanocomposite-enhanced retardants, reactive flame retardants, and AI-enabled material design and testing. The market is expected to experience robust growth during the forecast period, driven by rising demand from sectors such as construction, electronics, automotive, and textiles, all of which require high-performance, regulation-compliant fire protection solutions to meet safety and environmental standards.

Source: Secondary Research, Interviews with Experts, MarketsandMarkets Analysis
MARKET DYNAMICS
Level
-
Increasing number of fire accidents

-
Strict fire safety guidelines

Level
-
Stringent regulations regarding use of conventional flame retardants

-
High loading levels of mineral-based flame retardants alter properties of final products

Level
-
Development of more effective synergist compounds

-
Rising demand for wire & cables

Level
-
Supply challenges from Asia Pacific

-
Growing emphasis on environmental protection and sustainability

Source: Secondary Research, Interviews with Experts, MarketsandMarkets Analysis
Driver: Strict fire safety guidelines
Stringent fire safety regulations and guidelines across key end-use industries such as construction, electronics, automotive, and transportation remain primary drivers in the global flame retardants market. Governments and regulatory authorities worldwide are making using flame retardants in materials more compulsory to increase protection against fire and reduce loss of properties and life. Building codes in regions such as North America and Western Europe require flame retardant compliance for insulation, wiring, and interior materials, while similar safety standards apply to public infrastructure and commercial properties. In the electronics industry, manufacturers are being compelled to include flame retardants in circuit boards, connectors, and casings due to the increased risk of overheating and short circuits caused by the widespread use of compact, high-performing devices. Similarly, flame retardants are crucial for compliance with fire safety protocols in the automotive and transportation sectors, especially with the rising adoption of electric vehicles where battery and cable protection is critical. This regulatory push ensures market stability and encourages innovation in flame retardant technologies, including the development of low-toxicity and environmentally compliant alternatives. The need for efficient, legally compliant flame retardant solutions is anticipated to continue to be strong and consistent as safety regulations in international markets become more stringent.
Restraint: Stringent regulations regarding use of conventional flame retardants
The expansion of the worldwide flame retardants industry is severely hampered by environmental and health issues related to halogenated flame retardants, especially those containing brominated and chlorinated chemicals. These chemicals have come under increasing regulatory and public scrutiny due to their environmental persistence, potential to bioaccumulate, and links to adverse health effects such as endocrine disruption and developmental toxicity. Consequently, under frameworks such as REACH, RoHS, and the Stockholm Convention, several regions, including Europe and North America, have imposed strong limitations or outright prohibitions on specific halogenated flame retardants. This regulatory landscape has compelled manufacturers to reformulate products and shift toward safer, non-halogenated alternatives. However, the transition is often cost-intensive, involving significant investment in R&D, compliance testing, and reformulation of end-use applications without compromising fire performance. In addition, non-halogenated solutions may not always give equal performance or processing characteristics, limiting adoption, particularly in high-spec industries such as aerospace & automotive.
Opportunity: Development of more effective synergist compounds
Development of more effective synergist compounds is growing the demand for non-halogenated and sustainable flame retardants, which presents a substantial opportunity in the global market, particularly led by environmental regulations and corporate sustainability goals. End users are avoiding halogenated compounds because of their toxicological profile and regulatory restrictions, while end-use industries including construction, automotive, electronics, and textiles place a greater emphasis on eco-friendly materials. Due to greater recyclability, reduced emissions of smoke, and fewer harmful environmental effects, non-halogenated flame retardants are becoming crucial in end-use industries.
Challenge: Supply challenges from Asia Pacific
The flame retardants market continues to experience supply chain challenges in Asia Pacific, particularly related to phosphorus-based flame retardants. China is one of the leading suppliers of critical raw materials, including white and yellow phosphorus (P4), which are produced within a limited number of countries. Any changes to local regulations, energy restrictions, or logistical bottlenecks can significantly impact the availability and cost of phosphorus-based flame retardants. As P4 is employed in most halogen-free flame retardants, changes in Asian Pacific supply continue to influence the global market. These disruptions impact producers' cost structures and push production schedules of end-use industries like automotive, construction, and electronics. Furthermore, the absence of diversified sources outside Asia Pacific exposes downstream consumers to material shortages and price volatility. The demand for non-halogenated flame retardants is rising along with global fire safety and sustainability standards, but supply chains are also under pressure. To reduce these risks and ensure long-term supply security and cost stability in a more unstable global context, industry players invest in backward integration, localizing supply networks, and exploring alternative raw materials
Flame Retardants Market: COMMERCIAL USE CASES ACROSS INDUSTRIES
| COMPANY | USE CASE DESCRIPTION | BENEFITS |
|---|---|---|
 |
Use of flame-retardant plastics in interior panels, seats, and wiring | Enhances passenger safety by reducing fire risks in vehicles |
 |
Incorporation of flame-retardant components in appliances and circuit boards | Protects devices from fire hazards, ensuring consumer safety and regulatory compliance |
 |
Flame-retardant coatings and plastics in industrial equipment and electrical panels | Prevents fire incidents, enhances equipment safety, and extends lifespan |
 |
Flame-retardant fabrics and polymers in vehicle interiors and wiring harnesses | Improves safety of passengers by minimizing fire risk in case of accidents |
 |
Use of flame-retardant plastics and PCB materials in consumer electronics | Reduces risk of device fires, ensures product safety, and meets regulatory requirements |
Logos and trademarks shown above are the property of their respective owners. Their use here is for informational and illustrative purposes only.
MARKET ECOSYSTEM
The flame retardants market ecosystem involves identifying and analyzing interconnected relationships among various stakeholders, including raw material suppliers, manufacturers, distributors, and end users. The raw material suppliers provide the key inputs, which are the fundamental raw materials required to manufacture the flame retardants which further enables the manufacturers to develop flame retardants using various specialized technologies. The distributors and suppliers are the ones who establish contact between the manufacturing companies and end users to concentrate on the supply chain, increasing operational efficiency and profitability.

Logos and trademarks shown above are the property of their respective owners. Their use here is for informational and illustrative purposes only.
MARKET SEGMENTS

Source: Secondary Research, Interviews with Experts, MarketsandMarkets Analysis
Flame Retardants Market, by Type
The phosphorus-based flame retardants segment holds the largest share in the market, due to their wide range of applicability, regulatory acceptability, and excellent fire safety performance. Phosphorus compounds have been preferred in various end-use industries like electronics, building and construction, transportation, and textiles because they perform well in both gas-phase and condensed-phase flame retardation. These materials offer low smoke release, lower toxicity, and compatibility with many polymer systems, making them a desirable choice compared to halogenated flame retardants in the face of increasing environmental and health hazards. The increasing regulatory limits on halogenated materials have hastened the movement toward less-regulated and environmentally acceptable alternatives as indicated by the use of phosphorus-related mixtures due to their desirable consequences for the environment and societal well-being. The growing need for lightweight and high-performance thermoplastics in automobile and electronic uses has provided a conducive growth climate for phosphorus flame retardants, which are suited for engineering plastics.
Flame Retardants Market, by Application
In the global flame retardants market by application segment, the polyolefins segment has the biggest market share and is expanding at the highest growth rate. The versatility, durability, and affordability of polyolefins, such as polyethylene (PE) and polypropylene (PP), make them popular in a variety of industries, including packaging, automotive, construction, textiles, and electrical and electronics. But because of their high flammability, flame retardants are being used more often to improve safety and ensure that strict fire safety regulations are followed. The use of flame retardants is being fueled by the growing need for high-performance, lightweight materials in automotive and electrical applications, as well as the expanding use of polyolefin-based plastics in emerging economies.
Flame Retardants Market, by End-use Industry
The building & construction industry is expected to hold the largest share of the global flame retardants market. This is primarily because of the growing demand for fire-resistant materials for residential, commercial, and infrastructure applications. With increasing urbanization, strict fire safety standards, and increasing awareness about the dangers of fire, construction firms and raw material suppliers are increasingly incorporating flame retardants in a vast array of products like insulation, structural polymers, electrical cables, sealants, and coatings. Non-halogen flame retardants, particularly phosphorus and nitrogen-based, are gaining popularity with the changing regulatory environments supporting low-toxicity and environmentally friendly substances. The industry's drive toward sustainable buildings and green construction encourages the trend in the same direction. Additionally, Asia Pacific, Middle Eastern, and certain European government-supported infrastructure development initiatives have strengthened the demand for materials enhanced with flame retardants.
REGION
Asia Pacific is expected to be the largest flame retardants market during the forecast period.
Asia Pacific is anticipated to be the largest market for flame retardants during the forecast period, driven by rapid industrialization, urban expansion, and strong growth in key end-use sectors such as building & construction, electrical & electronics, automotive, and textiles. Nations such as China, India, Japan, and South Korea are witnessing increased infrastructure development, rising manufacturing output, and higher investments in housing and commercial real estate, all generating significant demand for flame-retardant materials to meet fire safety standards. Increasing government regulations in the region are more forcefully requiring the incorporation of flame retardants in building materials, electrical components, and transport systems. Moreover, consumer awareness of fire safety is rising, while increasing use of energy-efficient appliances and electric cars further facilitates market growth.

Flame Retardants Market: COMPANY EVALUATION MATRIX
The Albemarle Corporation (Star) leads with a strong market presence and wide product portfolio, driving large-scale adoption across industry. BASF SE (Emerging Leader) is gaining traction due to its diversified product portfolio, continuous investment in R&D, and focus on high-performance solutions. While Albemarle Corporation dominates with scale, BASF SE shows strong growth potential to advance toward the leaders’ quadrant.

Source: Secondary Research, Interviews with Experts, MarketsandMarkets Analysis
KEY MARKET PLAYERS
MARKET SCOPE
| REPORT METRIC | DETAILS |
|---|---|
| Market Size Value in 2024 | USD 7,727.0 MN |
| Revenue Forecast in 2030 | USD 10,519.0 MN |
| Growth Rate | CAGR of 5.32% from 2025-2030 |
| Actual Data | 2020−2030 |
| Base Year | 2024 |
| Forecast Period | 2025−2030 |
| Units Considered | Value (USD Billion), Volume (Kiloton) |
| Report Coverage | Revenue forecast, company ranking, competitive landscape, growth factors, and trends |
| Segments Covered |
|
| Regional Scope | North America, Western Europe, Central & Eastern Europe, Asia Pacific, South America, Middle East & Africa |
WHAT IS IN IT FOR YOU: Flame Retardants Market REPORT CONTENT GUIDE

DELIVERED CUSTOMIZATIONS
We have successfully delivered the following deep-dive customizations:
| CLIENT REQUEST | CUSTOMIZATION DELIVERED | VALUE ADDS |
|---|---|---|
| Europe -based Flame Retardants Market Manufacturer |
|
|
| Asia Pacific-Based Flame Retardants Market Manufacturer |
|
|
RECENT DEVELOPMENTS
- May 2025 : J.M. Huber Corporation acquired The R.J. Marshall Company’s ATH, antimony-free flame retardant, and molybdate-based smoke suppressant assets, integrating them into its Huber Advanced Materials unit to strengthen its product portfolio and leadership in the North American flame retardant market.
- December 2024 : ICL Group Ltd. launched a new flame retardant, VeriQuel R100. This innovative, phosphorus-based flame retardant is designed for rigid polyurethane insulation in applications like wall sheathing and PIR roofing.
- October 2023 : Clariant AG inaugurated a new flame retardant production plant in Daya Bay, China, to meet growing demand in Asia Pacific. The facility produces halogen-free Exolit OP flame retardants, which are widely used in sectors such as e-mobility, electronics, and construction.
- November 2020 : BASF SE formed a joint venture with Idemitsu Co. Ltd. in Chiba, Japan, to optimize the global production of chemicals and product structures.
- March 2020 : Clariant AG collaborated with Floreon-Transforming Packaging Ltd. to expand its high-performance biopolymer applications to additional markets
Table of Contents
 Exclusive indicates content/data unique to MarketsandMarkets and not available with any competitors.
Methodology
The study involved four major activities in estimating the market size for flame retardants market. Exhaustive secondary research was done to collect information on the market, the peer market, and the parent market. The next step was to validate these findings, assumptions, and sizing with industry experts across the value chain through primary research. Both top-down and bottom-up approaches were employed to estimate the complete market size. After that, the market breakdown and data triangulation procedures were used to estimate the market size of the segments and subsegments.
Secondary Research
Secondary sources used in this study included annual reports, press releases, and investor presentations of companies; white papers; certified publications; articles from recognized authors; and gold standard & silver standard websites such as Factiva, ICIS, Bloomberg, and others. The findings of this study were verified through primary research by conducting extensive interviews with key officials such as CEOs, VPs, directors, and other executives. The breakdown of profiles of the primary interviewees is illustrated in the figure below:
Primary Research
The flame retardants market comprises several stakeholders, such as raw material suppliers, end-product manufacturers, and regulatory organizations in the supply chain. The demand side of this market is characterized by key opinion leaders in various applications for the flame retardants market. The supply side is characterized by advancements in technology and diverse application industries. Various primary sources from both the supply and demand sides of the market were interviewed to obtain qualitative and quantitative information.
The following is a breakdown of the primary respondents:

Note: Tier 1, Tier 2, and Tier 3 companies are classified based on their market revenue in 2023/2024, available in the public domain, product portfolios, and geographical presence.
Other designations include consultants and sales, marketing, and procurement managers.
To know about the assumptions considered for the study, download the pdf brochure
| COMPANY NAME | DESIGNATION | |
|---|---|---|
| Albemarle Corporation | Senior Manager | |
| ICL Group Ltd. | Innovation Manager | |
| LANXESS AG | Vice-President | |
| J.M. Huber Corporation | Production Supervisor | |
| Nabaltec AG | Sales Manager | |
Market Size Estimation
Both top-down and bottom-up approaches were used to estimate and validate the total size of the flame retardants market. These methods were also used extensively to estimate the size of various subsegments in the market. The research methodology used to estimate the market size includes the following:
- The key players in the industry have been identified through extensive secondary research.
- The supply chain of the industry has been determined through primary and secondary research.
- All percentage shares, splits, and breakdowns have been determined using secondary sources and verified through primary sources.
- All possible parameters that affect the markets covered in this research study have been accounted for, viewed in extensive detail, verified through primary research, and analyzed to obtain the final quantitative and qualitative data.

Data Triangulation
After arriving at the overall market size—using the market size estimation processes as explained above—the market was split into several segments and subsegments. To complete the overall market engineering process and arrive at the exact statistics of each market segment and subsegment, data triangulation, and market breakdown procedures were employed, wherever applicable. The data was triangulated by studying various factors and trends from both the demand and supply sides in the flame retardants industry.
Market Definition
According to the PINFA (Phosphorus, Inorganic, and Nitrogen Flame Retardant) Association, “Flame retardants are key components in reducing the devastating effect of fire mishaps on people, property, and the environment. The most common elements used as flame retardants are bromine, chlorine, and phosphorus. The compounds of these elements are added to treat potentially flammable materials. Flame retardants stop the fire by interacting with the fire cycle in the gaseous phase and stop the chemical chain reaction. They act in two ways - they either prevent the fire from starting or slow it down significantly. They are added to plastics, among other materials, and do not alter the properties of the parent material.”
Stakeholders
- Flame retardant manufacturers
- Flame retardant distributors
- Raw material suppliers
- Government and research organizations
- Investment banks and private equity firms
Report Objectives
- To analyze and forecast the size of the global flame retardants market in terms of value and volume
- To provide detailed information about the important drivers, restraints, challenges, and opportunities influencing market growth
- To define, describe, and segment the market based on type, application, end-use industry, and region
- To forecast the size of the market segments based on regions such as Asia Pacific, North America, Western Europe, Central & Eastern Europe, the Middle East & Africa, and South America
- To strategically analyze the segmented markets with respect to individual growth trends, prospects, and contributions to the overall market
- To identify and analyze opportunities for stakeholders in the market
- To analyze competitive developments such as expansions, partnerships & collaborations, mergers & acquisitions, agreements, and product launches in the market
- To strategically profile the key companies and comprehensively analyze their core competencies
Key Questions Addressed by the Report
Who are the major players in the flame retardants market?
The key players in the flame retardants market include Albemarle Corporation (US), ICL Group Ltd. (Israel), LANXESS AG (Germany), J.M. Huber Corporation (US), Nabaltec AG (Germany), BASF SE (Germany), ADEKA Corporation (Japan), Avient Corporation (US), Clariant AG (Switzerland), and Italmatch Chemicals S.p.A. (Italy).
What are the drivers and opportunities for the flame retardants market?
The increasing number of fire accidents, stringent fire safety regulations, and growth of end-use industries are the major drivers of the flame retardants market. Development of more effective synergist compounds, rising demand for wires and cables, and rising demand for non-halogenated and sustainable flame retardants are expected to create new opportunities for the market.
Which strategies are the key players focusing upon in the flame retardants market?
Product launches, partnerships, mergers and acquisitions, agreements, and expansions are the strategies adopted by the top players to expand their global presence.
What is the expected growth rate of the flame retardants market between 2024 and 2030?
The flame retardants market is projected to grow at a CAGR of 5.32% in terms of value during the forecast period.
Which major factors are expected to restrain the growth of the flame retardants market during the forecast period?
Stringent regulations regarding the use of conventional flame retardants, high loading levels of mineral-based flame retardants altering the properties of final products, and the use of harmful chemicals in flame retardants are expected to restrict market growth during the forecast period.
Need a Tailored Report?
Customize this report to your needs
Get 10% FREE Customization
Customize This ReportPersonalize This Research
- Triangulate with your Own Data
- Get Data as per your Format and Definition
- Gain a Deeper Dive on a Specific Application, Geography, Customer or Competitor
- Any level of Personalization
Let Us Help You
- What are the Known and Unknown Adjacencies Impacting the Flame Retardants Market
- What will your New Revenue Sources be?
- Who will be your Top Customer; what will make them switch?
- Defend your Market Share or Win Competitors
- Get a Scorecard for Target Partners

Custom Market Research Services
We Will Customise The Research For You, In Case The Report Listed Above Does Not Meet With Your Requirements
Get 10% Free CustomisationTESTIMONIALS

We at Nissan Chemicals Corporation have been clients of MarketsandMarkets for more than a year now. We recently consulted MarketsandMarkets for a study, the team at MarketsandMarkets was extremely professional and organized. The business insights were very detailed and aligned well with our expectations that really helped us formulate the Business Plans and device new strategies for development themes. MarketsandMarkets offers a unique combination of expertise and dedicated engagement model. Their research findings have helped us in designing our Pricing Strategy which will make it easier for us to predict the future sales and profits for the next ten years. We look forward to working with MarketsandMarkets in the future.
VP of Strategy & New Business Development
Leading Specialty Chemical Company
The MarketsandMarkets Engagement Model, composed of both the Knowledge Store and advisory custom research, has greatly helped us in understanding our markets and making strategic decisions. The Knowledge Store is a fast way to allow everyone in our organization to understand more about most any market they are interested in. The ability to then get custom research done and get answers to specific strategic questions and market insight has been spectacular. The Markets and Markets team feel more like colleagues than vendors and their services have helped us change our culture where statements of things like growth opportunities and competitive position are always backed by industry research.

Rich Gibson,
Director, Corporate Strategy
Milliken & Company,
Leading Industrial Manufacturer of specialty chemical, floor covering, performance and protective textile materials, and healthcaremilliken.com
MarketsandMarkets is a trusted resource that helps us to better understand markets that are near-adjacencies-whether its technology, value chain or geography. Their Knowledge Store platform provides a dashboard of markets and their characteristics which is easy to use and saves us time.
Adam Shaw,
Market Development and Strategy Manager
AdvanSix Inc. USA,
An American Leader in Chemicalswww.advansix.com
The Knowledge Store from MarketsandMarkets is a valuable tool which has helped my team acquire greater insight in to the end markets that our business serves. This has enabled us to help our company build stronger strategies throughout our planning process.
TOSHIO KINOSHITA
Senior Chif Consultion Research & Consulting Division
Mitsubishi Chemical Research Corporation,
Leading Manufacturer of Chemical Productswww.mitsubishichem-res.co.jp/en/

We recently engaged with MarketsandMarkets for a study, the team not only clearly understood our business objectives but was also extremely professional in the way they handled the entire project. The study was efficiently conducted in a phase-wise manner, and the engagement model furnished us with high-quality business insights that far exceeded our expectations at each phase. We were especially happy that MarketsandMarkets could provide us with both, an English as well as a Japanese version of the study. A special thanks to the Analyst Team and Client Services Team, whose fluency in Japanese enhanced our comfort level, as we could converse with them in our preferred language.
Independent entrepreneurs
Arrow Precision
We approached MarketsandMarkets for study on Proppants Market, and their work exceeded our expectations. The study conducted was comprehensive and enabled us to view the market through the various dimensions. In addition, the team was extraordinarily responsive throughout the process and resolved our queries on time. I strongly recommend MarketsandMarkets and will certainly consider them for additional market assessments we will need in the future.
Global engineering company, Japan
Deputy Manager,
Strategic Planning OfficeThe high-quality insights shared by the MarketsandMarkets team helped us understand the pharmaceutical plant designers in a specific geography. It also captured the risks that we may likely face in communicating with our potential partners. The study would enable us identify partners, which would impact our future growth.
Growth opportunities and latent adjacency in Flame Retardants Market


John
Apr, 2016
Interest in FR applications going into polymer compounding - specifically W&C, construction. Also interested in reports on NHFRs..
Genna
Mar, 2015
Flame retardant supply and demand by region.
Dong
Mar, 2019
Market demand, current market trends, and key drivers of flame retardants market.
Tage
Apr, 2018
Generic idea on FRs an their uses.
Vivi
Jun, 2015
Information on global Wire and Cable market for Low Voltage and forFlame retardant cable.
Vivi
Jun, 2015
Interested in Wire and Cable global market for Low Voltage and forFlame retardant cable (telecom cables and power cables)..
Matthew
Jun, 2016
Interested in Flame Retardants market with Ceramics segment.
Teguh
Sep, 2014
Enquiry on dispatch and Research Methodology.
Indika
Oct, 2014
Brominated flame retardant contains of polybrominated dibenzo-p-dioxins / dibenzofurans..
Dubravka
Jun, 2019
Looking for market share of flame retardant.
An
Jan, 2019
Flame retardant market by type, end-use industry, and global forecast.
ISABEL
Dec, 2019
Information regarding the market size, trends and regulations, and key players in LA..
Claudio
Nov, 2018
DecaBDE market.
Fernando
Sep, 2018
Global forest fire retardants demand.
Gary
Jul, 2017
Looking for report on FR market for the U.S. and Canada.
Gary
Jul, 2017
Specific information on flame retardant market in US and Canada .
RAVI
Jun, 2019
Flam retardants market of India.
Peter
May, 2019
Weather resistant fire retardant gelcoat for Building applications according highest standards such as EN 13501 and ASTM E 84.