Flow Chemistry Market by reactor (Tabular Reactors, Microreactors, Oscillatory Flow Rectors, Droplet-Based Reactors, Photochemical Reactors), Purification Method( Chromatography, Liquid-Liquid Extraction), Application, & Region - Global Forecast 2028
Updated on : November 11, 2025
Flow Chemistry Market
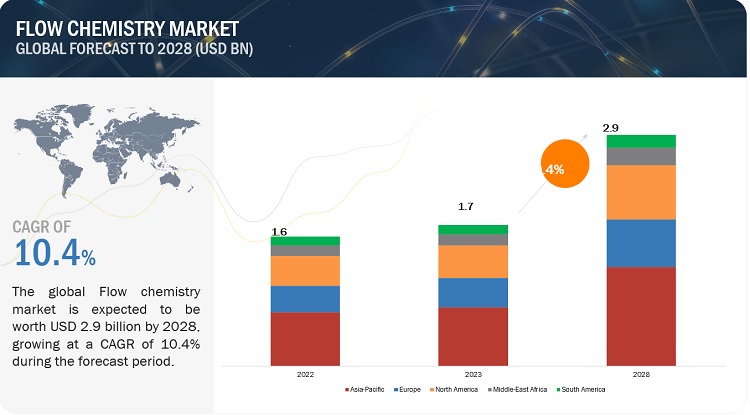
The global flow chemistry market is projected to grow from USD 1.7 billion in 2023 to reach USD 2.9 billion by 2028, at a CAGR of 10.4%. Chemical synthesis is one of the major applications of the flow chemistry and offers market growth opportunities. The Tabular reactor by reactor segment is experiencing high growth rates in emerging regions such as Asia Pacific and North America.
Flow Chemistry Market Forecast & Trends
To know about the assumptions considered for the study, Request for Free Sample Report
Attractive Opportunities in the Flow Chemistry Market
Flow Chemistry Market Dynamics
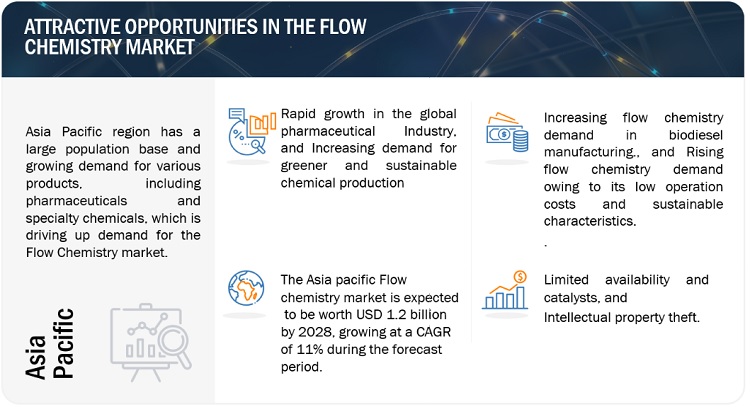
Driver: Rapid growth in the global pharmaceutical Industry
The pharmaceutical industry is propelled by advancements in medicine and bioscience. Furthermore, rising consumer health awareness in Asia-Pacific, particularly in developing nations like China and India, as well as rising disposable income, are expected to drive pharmaceutical sector growth over the projection period. Over the last decade, the United States, the United Kingdom, and Europe have dominated the pharmaceutical market; however, they now face major competition from growing economies such as Brazil, India, and China. Emerging economies such as China, India, and Brazil have seen dramatic changes in healthcare infrastructure. As a result, the one-size-fits-all approach cannot be used in emerging markets. Even within the main market clusters--the BRICMT economies of Brazil, Russia, India, China, Turkey, and Mexico, as well as the second-tier countries in Southeast Asia and Africa--local differences necessitate tailored approaches to these markets. Continuous flow technology reduces the number of stages necessary for manufacturing, which contributes to cost savings. .
Restraint: Competition forms alternative technologies
The expansion of the flow chemistry market may be constrained by competition from competing technologies. Standard batch-wise methods, microwave-assisted chemistry, and ultrasound-assisted chemistry are only a few of the various technologies that are employed in chemical synthesis. Comparing these technologies to flow chemistry, they each have different benefits and drawbacks, and some may be better suited for particular uses. For instance, conventional batch-wise methods, which are well-known and frequently used in the chemical industry, may be selected for applications requiring just a tiny amount of a certain chemical. On the other hand, microwave-assisted chemistry and ultrasound-assisted chemistry may be more appropriate for some types of reactions as they can give quicker reaction times and higher yields. Microwave chemistry, another competing technology, enables quick heating and efficient energy transfer in chemical reactions. While microwave chemistry offers the advantage of speed, it is limited in its application to particular types of reactions and may not provide the same level of control and selectivity as flow chemistry.
Opportunities: Increasing flow chemistry demand in biodiesel manufacturing
The Increased demand for chemicals forms numerous end-use applications boosts new capital investment in the chemical industry. The production capacity of chemicals is anticipated to rise because of the setting up of new chemical facilities. The production capacity of chemicals is anticipated to rise because of the setting up of new chemicals facilities. The significant reasons encouraging the growth of the chemical industry in various economies across the globe include supportive government initiatives and investments, stringent environmental regulations, high fragmentation in the industry, and the growing importance of specialty chemicals. Major players in the chemical industry are continuously engaged in expanding their production facilities to meet the increasing demand for chemicals across various applications. The chemical industry is a significant end-user of continuous flow chemistry flow technology as multiple sectors such as fertilizer and food & beverage require bulk chemicals. Flow chemistry makes bulk processing economical and easy, due to which various chemical manufacturers adopt this technology across the globe.
Challenges: Limited availability and catalysts
A challenge for the market for flow chemistry might undoubtedly be the limited supply of reagents and catalysts. Compared to batch processing, flow chemistry has many benefits, including increased safety, efficiency, and scalability. This field of chemical synthesis is currently seeing tremendous growth. The availability of dependable and top-notch reagents and catalysts is essential for the success of flow chemistry, nevertheless. The flow chemistry industry has been significantly disrupted recently as a result of numerous instances of reagent and catalyst shortages. The global supply chain for chemicals and laboratory supplies, such as reagents and catalysts, was affected by the COVID-19 pandemic in 2020, for instance. Critical reagents and catalysts became scarce as a result, slowing or stopping research initiatives and manufacturing procedures that depend on flow chemistry.
Flow Chemistry Market Ecosystem
Prominent companies in this market include well-established, financially stable manufacturers of lignosulfonates. These companies have been operating in the market for several years and possess a diversified product portfolio and strong global sales and marketing networks. Prominent companies in this market include Thermo Fisher Scientific Inc (US), Corning Incorporated (US), Lonza (Switzerland), PerkinElmer Inc (US), Biotage (Sweden), Milestone Srl(Italy), Velocys plc (UK) , THALESNANO INC (Hungary) , CEM Corporation (US) , Parr Instrument Company (US).
The Tabular reactor segment, by reactor, is expected to be the largest market during the forecast period
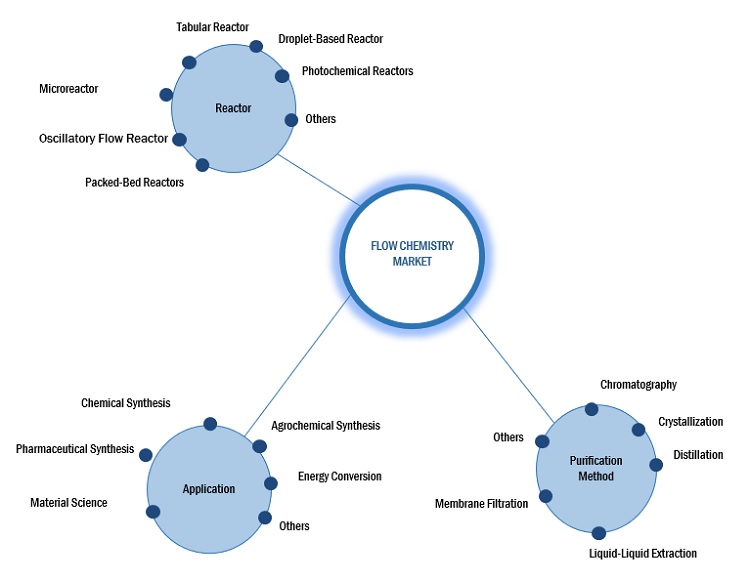
Based on the reactor, tubular reactor, microreactor, oscillatory flow reactor, packed-bed reactor, droplet-based reactor, photochemical reactor, and others. Globally, tubular reactors dominated the Flow chemistry market. Tubular reactor chemistry is projected to reach USD 0.4 billion by 2028 from USD 0.7 billion in 2023 and is expected to register a CAGR of 10.4% during the forecast period. They are commonly used in various industries, including pharmaceuticals, chemicals, petrochemicals, and specialty chemicals. Tabular reactors are suitable for a wide array of reactions, such as hydrogenation, oxidation, nitration, and polymerization. Furthermore, tabular reactors are easily scalable from lab-scale to commercial production.
Based on application, the chemical synthesis segment accounts for the largest share of the overall market.
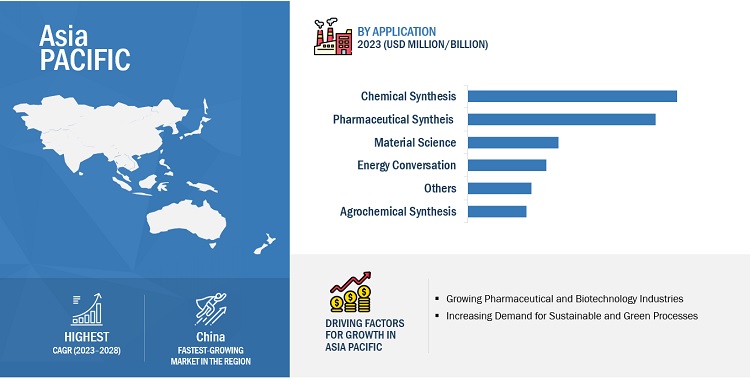
Based on application, The majority of the market share for flow chemistry is held by the chemical synthesis, chemical synthesis, pharmaceutical synthesis, material science, agrochemical syntheis, energy conversion, and others are all essential segments. Polymer is a common material for Flow chemistry due to its durability, low cost, and ease of installation. The primary reason for the dominance of chemical synthesis in the flow chemistry industry is the extensive demand for efficient and scalable manufacturing processes. Flow chemistry offers precise control over reaction parameters, enhanced mixing, and improved heat transfer, resulting in higher yields, improved selectivity, and better overall process efficiency. These benefits are particularly valuable in chemical synthesis, where the production of complex compounds requires careful control of reaction conditions and optimized process parameters.
Asia Pacific is expected to account for the largest share of the global market during the forecast period.
Based on the region, Asia Pacific region is experiencing the largest market share in the flow chemistry market due to the region has been witnessing significant economic growth and industrial development in countries such as China, India, Japan, South Korea, and Singapore. Asia Pacific region is home to a large number of pharmaceutical, chemical, and petrochemical companies, which are major consumers of flow chemistry systems.
To know about the assumptions considered for the study, download the pdf brochure
Flow Chemistry Market Players
The Flow chemistry market is dominated by a few major players that have a wide regional presence. The key players in the Flow chemistry market are Thermo Fisher Scientific Inc (US), Corning Incorporated (US), Lonza (Switzerland), PerkinElmer Inc (US), Biotage (Sweden), Milestone Srl(Italy), Velocys plc (UK) , THALESNANO INC (Hungary) , CEM Corporation (US) , Parr Instrument Company (US). In the last few years, the companies have adopted growth strategies such as acquisitions, new product launch, partnership, contract, and agreement to capture a larger share of the Flow chemistry market.
Flow Chemistry Market Report Scope
|
Report Metric |
Details |
|
Market Size Value in 2023 |
USD 1.7 billion |
|
Revenue Forecast in 2028 |
USD 2.9 billion |
|
CAGR |
10.4% |
|
Years considered for the study |
2019-2028 |
|
Base Year |
2022 |
|
Forecast period |
2023–2028 |
|
Units considered |
Value (USD Million/Billion) |
|
Segments |
Reactor,Purification Method, Application, and Region |
|
Regions |
Asia Pacific, North America, Europe, Middle East & Africa, and South America |
|
Companies |
Thermo Fisher Scientific Inc (US), Corning Incorporated (US), Lonza (Switzerland), PerkinElmer Inc (US), Biotage (Sweden), Milestone Srl(Italy), Velocys plc (UK) , THALESNANO INC (Hungary) , CEM Corporation (US) , Parr Instrument Company (US) |
This report categorizes the global flow chemistry market based on reactor, purification method, application, and region.
Based on By Reactor, the flow chemistry market has been segmented as follows:
- Tabular Reactor
- Microreactor
- Oscillatory Flow Reactor
- Packed-Bed Reactors
- Droplet-Based Reactor
- Photochemical Reactors
- Others
Based on By Purification Method, the flow chemistry market has been segmented as follows:
- Chromatography
- Crystallization
- Distillation
- Liquid-Liquid Extraction
- Membrane Filtration
- Others
Based on Application, the flow chemistry market has been segmented as follows:
- Chemical Synthesis
- Pharmaceutical Synthesis
- Material Science
- Agrochemical Syntheis
- Energy Conversion
- Others
Based on the Region, the flow chemistry market has been segmented as follows:
- North America
- Asia Pacific
- Europe
- Middle East & Africa
- South America
Recent Developments
- In May 2021 Lonza (Switzerland), has partnered with Codexis (USA) , a prominent enzyme engineering business, to develop and commercialize flow chemistry-based enzymatic methods for synthesizing a partnership with Codexis, a prominent enzyme engineering business, to develop and commercialize flow chemistry-based enzymatic methods for the synthesis of pharmaceutical intermediates and APIs..
- In March 2021 Thermo Fisher Scientific (US) announced the acquisition of Qiagen N.V.,(Netherland) a major provider of sample and assay technology for molecular diagnostics, application testing, and academic research. The acquisition will strengthen Thermo Fisher Scientific's position in the fast-expanding molecular diagnostics sector.
- In August 2021 Lonza (Switzerland) announced the acquisition of Parchem Fine & speciality Chemicals (USA), a top provider of speciality chemicals and specialized production services. The purchase is a part of Lonza's plan to broaden its selection of specialty chemicals and use its knowledge of flow chemistry technology to offer its clients more effective and environmentally friendly options.
- In October 2020, PerkinElmer (US) agreed to supply automation solutions for the research and manufacture of small molecules and biotherapeutics, including flow chemistry, to the UK-based Medicines Manufacturing Innovation Centre (UK).
Frequently Asked Questions (FAQ):
What is the current size of the Flow chemistry market?
The current market size of the global Flow chemistry market is 1.7 Billion in 2023.
What are the major drivers for the Flow chemistry market?
Rapid growth in the global pharmaceutical Industry, Increasing demand for greener and sustainable chemical production.
Which is the fastest-growing region during the forecasted period in the Flow chemistry market?
North America is expected to be the fastest-growing region for the global Flow chemistry market between 2023–2028. North America also has a well-established regulatory framework that supports innovation and the adoption of new technologies in the pharmaceutical and chemical industries.
Which is the fastest-growing segment, by reactor during the forecasted period in the Flow chemistry market?
By reactor, the Flow chemistry market has been segmented into the microreactor segment and is anticipated to be the fastest-growing flow chemistry segment by reactor during the forecast period.
Which is the fastest growing segment by purification method during the forecasted period in the Flow chemistry market?
By purification method, the crystallization segment is anticipated to be the fastest growing in the flow chemistry market. .
To speak to our analyst for a discussion on the above findings, click Speak to Analyst


- 5.1 INTRODUCTION
-
5.2 MARKET DYNAMICSDRIVERS- Growing use of flow chemistry in chemical & pharmaceutical industries- Increasing demand for green and sustainable chemical production- Safety of production process and low emissionsRESTRAINTS- Cost and procedural complexity- Competition from alternative technologies- Need for high R&D investments and capital expenditureOPPORTUNITIES- Increasing demand in biodiesel manufacturing- Growing adoption of flow chemistry in agrochemical production- High potential for growth in Asian chemical sectorCHALLENGES- Limited availability of reagents and catalysts- Intellectual property theft
-
5.3 PORTER’S FIVE FORCES ANALYSISTHREAT OF NEW ENTRANTSTHREAT OF SUBSTITUTESBARGAINING POWER OF SUPPLIERSBARGAINING POWER OF BUYERSINTENSITY OF COMPETITIVE RIVALRY
- 6.1 COVID-19 IMPACT
-
6.2 VALUE CHAIN ANALYSISRAW MATERIAL SUPPLIERSMANUFACTURERSDISTRIBUTORSEND USERS
-
6.3 MACROECONOMIC INDICATORSGDP TRENDS AND FORECASTS OF MAJOR ECONOMIES
-
6.4 FLOW CHEMISTRY MARKET REGULATIONSREGULATORY BODIES, GOVERNMENT AGENCIES, AND OTHER ORGANIZATIONS
-
6.5 TRADE ANALYSISEXPORT SCENARIOIMPORT SCENARIO
-
6.6 PATENT ANALYSISINSIGHTSLEGAL STATUS OF PATENTSJURISDICTION ANALYSISAPPLICANT ANALYSIS
-
6.7 TRENDS/DISRUPTIONS IMPACTING CUSTOMERS’ BUSINESSES
-
6.8 ECOSYSTEM MARKET MAP
-
6.9 TECHNOLOGY ANALYSISGAS-BASED FLOW CHEMISTRYPHOTOCHEMISTRY-BASED FLOW CHEMISTRY
-
6.10 KEY STAKEHOLDERS AND BUYING CRITERIAKEY STAKEHOLDERS IN BUYING PROCESSBUYING CRITERIA
- 7.1 INTRODUCTION
-
7.2 TUBULAR REACTORSGROWTH OF PHARMA & CHEMICAL SYNTHESIS SECTORS TO DRIVE DEMAND
-
7.3 MICROREACTORSVERSATILITY OF MICROREACTORS TO BOOST END-USER ADOPTION
-
7.4 OSCILLATORY FLOW REACTORSENHANCED MIXING, SUPERIOR HEAT & MASS TRANSFER TO DRIVE PROPEL MARKET
-
7.5 PACKED-BED REACTORSINCREASING DEMAND FOR PBR TO DRIVE MARKET
-
7.6 DROPLET-BASED REACTORSHIGH UTILITY IN CATALYST SCREENING AND OPTIMIZATION INVESTIGATIONS TO SUPPORT DEMAND
-
7.7 PHOTOCHEMICAL REACTORSABILITY TO MAXIMIZE ATOM ECONOMY AND PERFORM CLEAN CHEMISTRY TO BOOST GROWTH
-
7.8 OTHER REACTORSCONTINUOUS STIRRED-TANK REACTORSMULTISTEP CONTINUOUS FLOW REACTORS
- 8.1 INTRODUCTION
-
8.2 CHROMATOGRAPHYCHROMATOGRAPHY TO DOMINATE PURIFICATION METHODS MARKET
-
8.3 CRYSTALLIZATIONCRYSTALLIZATION TO SHOW HIGHEST GROWTH RATE
-
8.4 DISTILLATIONVERSATILITY OF DISTILLATION TO BOOST DEMAND
-
8.5 LIQUID-LIQUID EXTRACTIONWIDE USAGE ACROSS MULTIPLE APPLICATIONS TO SUPPORT MARKET
-
8.6 MEMBRANE FILTRATIONHIGH PRODUCT PURITY AND STREAMLINED PRODUCTION TO PROPEL USAGE
-
8.7 OTHER PURIFICATION METHODSELECTROPHORESIS
- 9.1 INTRODUCTION
-
9.2 CHEMICAL SYNTHESISCHEMICAL SYNTHESIS TO DOMINATE APPLICATIONS MARKET
-
9.3 PHARMACEUTICAL SYNTHESISIMPROVED SAFETY AND SUSTAINABILITY TO DRIVE FLOW CHEMISTRY USAGE
-
9.4 MATERIALS SCIENCENEED TO DESIGN BETTER, STRONGER, AND MORE EFFECTIVE EQUIPMENT TO BOOST GROWTH
-
9.5 AGROCHEMICAL SYNTHESISGROWING NEED FOR AGROCHEMICALS TO PROPEL MARKET
-
9.6 ENERGY CONVERSIONEFFICIENT AND CONTINUOUS PROCESSING OF ENERGY SOURCES INTO USABLE FORMS TO SUPPORT MARKET
-
9.7 OTHER APPLICATIONSPETROCHEMICALS
- 10.1 INTRODUCTION
-
10.2 ASIA PACIFICASIA PACIFIC: RECESSION IMPACTCHINA- Increased investment in chemical synthesis to drive demandINDIA- Government initiatives and policies toward green chemistry to fuel demand for flow chemistrySOUTH KOREA- Aid for flow chemistry adoption and growth to propel marketJAPAN- Supportive government initiatives and projects to favor market growthREST OF ASIA PACIFIC
-
10.3 NORTH AMERICANORTH AMERICA: RECESSION IMPACTUS- US to dominate North American flow chemistry marketCANADA- Developments in agricultural synthesis and energy conversion to drive need for flow chemistryMEXICO- Growing awareness of sustainability to drive demand for flow chemistry
-
10.4 EUROPEEUROPE: RECESSION IMPACTGERMANY- Germany to dominate flow chemistry market in europeUK- Stringent government regulations regarding chemical synthesis to drive demand for flow chemistryFRANCE- Increased focus on conservation and sustainability to support growthSPAIN- Robust infrastructure and technological advancement to drive focus on sustainable water managementITALY- Increasing awareness of green chemistry to support demand for flow chemistryREST OF EUROPE
-
10.5 MIDDLE EAST & AFRICAMIDDLE EAST & AFRICA: RECESSION IMPACTSAUDI ARABIA- Saudi Arabia to hold largest market shareSOUTH AFRICA- Growing interest in implementing flow chemistry to support marketREST OF MIDDLE EAST & AFRICA
-
10.6 SOUTH AMERICASOUTH AMERICA: RECESSION IMPACTBRAZIL- Rising investment in oil production and pharma industry to drive demand for flow chemistryARGENTINA- Rising awareness of flow chemicals and applications to enhance adoptionREST OF SOUTH AMERICA

- 11.1 OVERVIEW
- 11.2 MARKET SHARE ANALYSIS, 2022
- 11.3 MARKET EVALUATION FRAMEWORK
-
11.4 RECENT DEVELOPMENTSFLOW CHEMISTRY MARKET: PRODUCT LAUNCHES, 2019–2022FLOW CHEMISTRY MARKET: DEALS, 2019–2022
-
11.5 COMPANY EVALUATION QUADRANT, 2022STARSEMERGING LEADERSPERVASIVE PLAYERSPARTICIPANTS
-
11.6 COMPANY EVALUATION QUADRANT FOR STARTUPS/SMES, 2022PROGRESSIVE COMPANIESRESPONSIVE COMPANIESDYNAMIC COMPANIESSTARTING BLOCKS
-
12.1 KEY PLAYERSTHERMO FISHER SCIENTIFIC, INC.- Business overview- Products/Services/Solutions offered- Recent developments- MnM viewLONZA- Business overview- Products/Services/Solutions offered- Recent developments- MnM viewCORNING INCORPORATED- Business overview- Products/Services/Solutions offered- Recent developments- MnM viewPERKINELMER, INC.- Business overview- Products/Services/Solutions offered- Recent developments- MnM viewBIOTAGE- Business overview- Products/Services/Solutions offered- Recent developments- MnM viewMILESTONE SRL- Business overview- Products/Services/Solutions offered- Recent developments- MnM viewVELOCYS PLC- Business overview- Products/Services/Solutions offered- Recent developments- MnM viewTHALESNANO, INC.- Business overview- Products/Services/Solutions offered- Recent developmentsCEM CORPORATION- Business overview- Products/Services/Solutions offered- Recent developmentsPARR INSTRUMENT COMPANY- Business overview- Products/Services/Solutions offered- Recent developments
-
12.2 OTHER KEY PLAYERSSYRRIS LTD.BÜCHIZAIPUTEHRFELD MIKROTECHNIK GMBHCHEMTRIXYMC AMERICAADVION, INC.PDC MACHINESUNIQSIS LTD.H.E.L GROUPCAMBRIDGE REACTOR DESIGN LTD.AM TECHNOLOGYFLOWID BVASYNT LTD.FUTURECHEMISTRY HOLDING B.V.
- 13.1 INSIGHTS OF INDUSTRY EXPERTS
- 13.2 DISCUSSION GUIDE
- 13.3 KNOWLEDGESTORE: MARKETSANDMARKETS’ SUBSCRIPTION PORTAL
- 13.4 CUSTOMIZATION OPTIONS
- 13.5 RELATED REPORTS
- 13.6 AUTHOR DETAILS
- TABLE 1 FLOW CHEMISTRY MARKET SNAPSHOT
- TABLE 2 FLOW CHEMISTRY MARKET: PORTER’S FIVE FORCES ANALYSIS
- TABLE 3 GDP TRENDS AND FORECASTS, BY KEY COUNTRY, 2019–2027
- TABLE 4 NORTH AMERICA: LIST OF REGULATORY BODIES, GOVERNMENT AGENCIES, AND OTHER ORGANIZATIONS
- TABLE 5 EUROPE: LIST OF REGULATORY BODIES, GOVERNMENT AGENCIES, AND OTHER ORGANIZATIONS
- TABLE 6 ASIA PACIFIC: LIST OF REGULATORY BODIES, GOVERNMENT AGENCIES, AND OTHER ORGANIZATIONS
- TABLE 7 GRANTED PATENTS ACCOUNT FOR 37% OF TOTAL COUNT IN LAST TEN YEARS
- TABLE 8 ADVANTAGES OF GAS-BASED FLOW CHEMISTRY
- TABLE 9 ADVANTAGES OF PHOTOCHEMISTRY-BASED FLOW CHEMISTRY
- TABLE 10 INFLUENCE OF STAKEHOLDERS ON BUYING PROCESS FOR TOP FIVE APPLICATIONS
- TABLE 11 KEY BUYING CRITERIA FOR END-USER INDUSTRIES
- TABLE 12 FLOW CHEMISTRY MARKET, BY REACTOR, 2019–2022 (USD MILLION)
- TABLE 13 FLOW CHEMISTRY MARKET, BY REACTOR, 2023–2028 (USD MILLION)
- TABLE 14 FLOW CHEMISTRY MARKET, BY PURIFICATION METHOD, 2019–2022 (USD MILLION)
- TABLE 15 FLOW CHEMISTRY MARKET, BY PURIFICATION METHOD, 2023–2028 (USD MILLION)
- TABLE 16 FLOW CHEMISTRY MARKET, BY APPLICATION, 2019–2022 (USD MILLION)
- TABLE 17 FLOW CHEMISTRY MARKET, BY APPLICATION, 2023–2028 (USD MILLION)
- TABLE 18 FLOW CHEMISTRY MARKET, BY REGION, 2019–2022 (USD MILLION)
- TABLE 19 FLOW CHEMISTRY MARKET, BY REGION, 2023–2028 (USD MILLION)
- TABLE 20 ASIA PACIFIC: FLOW CHEMISTRY MARKET, BY COUNTRY, 2019–2022 (USD MILLION)
- TABLE 21 ASIA PACIFIC: FLOW CHEMISTRY MARKET, BY COUNTRY, 2023–2028 (USD MILLION)
- TABLE 22 ASIA PACIFIC: FLOW CHEMISTRY MARKET, BY REACTOR, 2019–2022 (USD MILLION)
- TABLE 23 ASIA PACIFIC: FLOW CHEMISTRY MARKET, BY REACTOR, 2023–2028 (USD MILLION)
- TABLE 24 ASIA PACIFIC: FLOW CHEMISTRY MARKET, BY PURIFICATION METHOD, 2019–2022 (USD MILLION)
- TABLE 25 ASIA PACIFIC: FLOW CHEMISTRY MARKET, BY PURIFICATION METHOD, 2023–2028 (USD MILLION)
- TABLE 26 ASIA PACIFIC: FLOW CHEMISTRY MARKET, BY APPLICATION, 2019–2022 (USD MILLION)
- TABLE 27 ASIA PACIFIC: FLOW CHEMISTRY MARKET, BY APPLICATION, 2023–2028 (USD MILLION)
- TABLE 28 CHINA: FLOW CHEMISTRY MARKET, BY REACTOR, 2019–2022 (USD MILLION)
- TABLE 29 CHINA: FLOW CHEMISTRY MARKET, BY REACTOR, 2023–2028 (USD MILLION)
- TABLE 30 CHINA: FLOW CHEMISTRY MARKET, BY PURIFICATION METHOD, 2019–2022 (USD MILLION)
- TABLE 31 CHINA: FLOW CHEMISTRY MARKET, BY PURIFICATION METHOD, 2023–2028 (USD MILLION)
- TABLE 32 CHINA: FLOW CHEMISTRY MARKET, BY APPLICATION, 2019–2022 (USD MILLION)
- TABLE 33 CHINA: FLOW CHEMISTRY MARKET, BY APPLICATION, 2023–2028 (USD MILLION)
- TABLE 34 INDIA: FLOW CHEMISTRY MARKET, BY REACTOR, 2019–2022 (USD MILLION)
- TABLE 35 INDIA: FLOW CHEMISTRY MARKET, BY REACTOR, 2023–2028 (USD MILLION)
- TABLE 36 INDIA: FLOW CHEMISTRY MARKET, BY PURIFICATION METHOD, 2019–2022 (USD MILLION)
- TABLE 37 INDIA: FLOW CHEMISTRY MARKET, BY PURIFICATION METHOD, 2023–2028 (USD MILLION)
- TABLE 38 INDIA: FLOW CHEMISTRY MARKET, BY APPLICATION, 2019–2022 (USD MILLION)
- TABLE 39 INDIA: FLOW CHEMISTRY MARKET, BY APPLICATION, 2023–2028 (USD MILLION)
- TABLE 40 SOUTH KOREA: FLOW CHEMISTRY MARKET, BY REACTOR, 2019–2022 (USD MILLION)
- TABLE 41 SOUTH KOREA: FLOW CHEMISTRY MARKET, BY REACTOR, 2023–2028 (USD MILLION)
- TABLE 42 SOUTH KOREA: FLOW CHEMISTRY MARKET, BY PURIFICATION METHOD, 2019–2022 (USD MILLION)
- TABLE 43 SOUTH KOREA: FLOW CHEMISTRY MARKET, BY PURIFICATION METHOD, 2023–2028 (USD MILLION)
- TABLE 44 SOUTH KOREA: FLOW CHEMISTRY MARKET, BY APPLICATION, 2019–2022 (USD MILLION)
- TABLE 45 SOUTH KOREA: FLOW CHEMISTRY MARKET, BY APPLICATION, 2023–2028 (USD MILLION)
- TABLE 46 JAPAN: FLOW CHEMISTRY MARKET, BY REACTOR, 2019–2022 (USD MILLION)
- TABLE 47 JAPAN: FLOW CHEMISTRY MARKET, BY REACTOR, 2023–2028 (USD MILLION)
- TABLE 48 JAPAN: FLOW CHEMISTRY MARKET, BY PURIFICATION METHOD, 2019–2022 (USD MILLION)
- TABLE 49 JAPAN: FLOW CHEMISTRY MARKET, BY PURIFICATION METHOD, 2023–2028 (USD MILLION)
- TABLE 50 JAPAN: FLOW CHEMISTRY MARKET, BY APPLICATION, 2019–2022 (USD MILLION)
- TABLE 51 JAPAN: FLOW CHEMISTRY MARKET, BY APPLICATION, 2023–2028 (USD MILLION)
- TABLE 52 REST OF ASIA PACIFIC: FLOW CHEMISTRY MARKET, BY REACTOR, 2019–2022 (USD MILLION)
- TABLE 53 REST OF ASIA PACIFIC: FLOW CHEMISTRY MARKET, BY REACTOR, 2023–2028 (USD MILLION)
- TABLE 54 REST OF ASIA PACIFIC: FLOW CHEMISTRY MARKET, BY PURIFICATION METHOD, 2019–2022 (USD MILLION)
- TABLE 55 REST OF ASIA PACIFIC: FLOW CHEMISTRY MARKET, BY PURIFICATION METHOD, 2023–2028 (USD MILLION)
- TABLE 56 REST OF ASIA PACIFIC: FLOW CHEMISTRY MARKET, BY APPLICATION, 2019–2022 (USD MILLION)
- TABLE 57 REST OF ASIA PACIFIC: FLOW CHEMISTRY MARKET, BY APPLICATION, 2023–2028 (USD MILLION)
- TABLE 58 NORTH AMERICA: FLOW CHEMISTRY MARKET, BY COUNTRY, 2019–2022 (USD MILLION)
- TABLE 59 NORTH AMERICA: FLOW CHEMISTRY MARKET, BY COUNTRY, 2023–2028 (USD MILLION)
- TABLE 60 NORTH AMERICA: FLOW CHEMISTRY MARKET, BY REACTOR, 2019–2022 (USD MILLION)
- TABLE 61 NORTH AMERICA: FLOW CHEMISTRY MARKET, BY REACTOR, 2023–2028 (USD MILLION)
- TABLE 62 NORTH AMERICA: FLOW CHEMISTRY MARKET, BY PURIFICATION METHOD, 2019–2022 (USD MILLION)
- TABLE 63 NORTH AMERICA: FLOW CHEMISTRY MARKET, BY PURIFICATION METHOD, 2023–2028 (USD MILLION)
- TABLE 64 NORTH AMERICA: FLOW CHEMISTRY MARKET, BY APPLICATION, 2019–2022 (USD MILLION)
- TABLE 65 NORTH AMERICA: FLOW CHEMISTRY MARKET, BY APPLICATION, 2023–2028 (USD MILLION)
- TABLE 66 US: FLOW CHEMISTRY MARKET, BY REACTOR, 2019–2022 (USD MILLION)
- TABLE 67 US: FLOW CHEMISTRY MARKET, BY REACTOR, 2023–2028 (USD MILLION)
- TABLE 68 US: FLOW CHEMISTRY MARKET, BY PURIFICATION METHOD, 2019–2022 (USD MILLION)
- TABLE 69 US: FLOW CHEMISTRY MARKET, BY PURIFICATION METHOD, 2023–2028 (USD MILLION)
- TABLE 70 US: FLOW CHEMISTRY MARKET, BY APPLICATION, 2019–2022 (USD MILLION)
- TABLE 71 US: FLOW CHEMISTRY MARKET, BY APPLICATION, 2023–2028 (USD MILLION)
- TABLE 72 CANADA: FLOW CHEMISTRY MARKET, BY REACTOR, 2019–2022 (USD MILLION)
- TABLE 73 CANADA: FLOW CHEMISTRY MARKET, BY REACTOR, 2023–2028 (USD MILLION)
- TABLE 74 CANADA: FLOW CHEMISTRY MARKET, BY PURIFICATION METHOD, 2019–2022 (USD MILLION)
- TABLE 75 CANADA: FLOW CHEMISTRY MARKET, BY PURIFICATION METHOD, 2023–2028 (USD MILLION)
- TABLE 76 CANADA: FLOW CHEMISTRY MARKET, BY APPLICATION, 2019–2022 (USD MILLION)
- TABLE 77 CANADA: FLOW CHEMISTRY MARKET, BY APPLICATION, 2023–2028 (USD MILLION)
- TABLE 78 MEXICO: FLOW CHEMISTRY MARKET, BY REACTOR, 2019–2022 (USD MILLION)
- TABLE 79 MEXICO: FLOW CHEMISTRY MARKET, BY REACTOR, 2023–2028 (USD MILLION)
- TABLE 80 MEXICO: FLOW CHEMISTRY MARKET, BY PURIFICATION METHOD, 2019–2022 (USD MILLION)
- TABLE 81 MEXICO: FLOW CHEMISTRY MARKET, BY PURIFICATION METHOD, 2023–2028 (USD MILLION)
- TABLE 82 MEXICO: FLOW CHEMISTRY MARKET, BY APPLICATION, 2019–2022 (USD MILLION)
- TABLE 83 MEXICO: FLOW CHEMISTRY MARKET, BY APPLICATION, 2023–2028 (USD MILLION)
- TABLE 84 EUROPE: FLOW CHEMISTRY MARKET, BY COUNTRY, 2019–2022 (USD MILLION)
- TABLE 85 EUROPE: FLOW CHEMISTRY MARKET, BY COUNTRY, 2023–2028 (USD MILLION)
- TABLE 86 EUROPE: FLOW CHEMISTRY MARKET, BY REACTOR, 2019–2022 (USD MILLION)
- TABLE 87 EUROPE: FLOW CHEMISTRY MARKET, BY REACTOR, 2023–2028 (USD MILLION)
- TABLE 88 EUROPE: FLOW CHEMISTRY MARKET, BY PURIFICATION METHOD, 2019–2022 (USD MILLION)
- TABLE 89 EUROPE: FLOW CHEMISTRY MARKET, BY PURIFICATION METHOD, 2023–2028 (USD MILLION)
- TABLE 90 EUROPE: FLOW CHEMISTRY MARKET, BY APPLICATION, 2019–2022 (USD MILLION)
- TABLE 91 EUROPE: FLOW CHEMISTRY MARKET, BY APPLICATION, 2023–2028 (USD MILLION)
- TABLE 92 GERMANY: FLOW CHEMISTRY MARKET, BY REACTOR, 2019–2022 (USD MILLION)
- TABLE 93 GERMANY: FLOW CHEMISTRY MARKET, BY REACTOR, 2023–2028 (USD MILLION)
- TABLE 94 GERMANY: FLOW CHEMISTRY MARKET, BY PURIFICATION METHOD, 2019–2022 (USD MILLION)
- TABLE 95 GERMANY: FLOW CHEMISTRY MARKET, BY PURIFICATION METHOD, 2023–2028 (USD MILLION)
- TABLE 96 GERMANY: FLOW CHEMISTRY MARKET, BY APPLICATION, 2019–2022 (USD MILLION)
- TABLE 97 GERMANY: FLOW CHEMISTRY MARKET, BY APPLICATION, 2023–2028 (USD MILLION)
- TABLE 98 UK: FLOW CHEMISTRY MARKET, BY REACTOR, 2019–2022 (USD MILLION)
- TABLE 99 UK: FLOW CHEMISTRY MARKET, BY REACTOR, 2023–2028 (USD MILLION)
- TABLE 100 UK: FLOW CHEMISTRY MARKET, BY PURIFICATION METHOD, 2019–2022 (USD MILLION)
- TABLE 101 UK: FLOW CHEMISTRY MARKET, BY PURIFICATION METHOD, 2023–2028 (USD MILLION)
- TABLE 102 UK: FLOW CHEMISTRY MARKET, BY APPLICATION, 2019–2022 (USD MILLION)
- TABLE 103 UK: FLOW CHEMISTRY MARKET, BY APPLICATION, 2023–2028 (USD MILLION)
- TABLE 104 FRANCE: FLOW CHEMISTRY MARKET, BY REACTOR, 2019–2022 (USD MILLION)
- TABLE 105 FRANCE: FLOW CHEMISTRY MARKET, BY REACTOR, 2023–2028 (USD MILLION)
- TABLE 106 FRANCE: FLOW CHEMISTRY MARKET, BY PURIFICATION METHOD, 2019–2022 (USD MILLION)
- TABLE 107 FRANCE: FLOW CHEMISTRY MARKET, BY PURIFICATION METHOD, 2023–2028 (USD MILLION)
- TABLE 108 FRANCE: FLOW CHEMISTRY MARKET, BY APPLICATION, 2019–2022 (USD MILLION)
- TABLE 109 FRANCE: FLOW CHEMISTRY MARKET, BY APPLICATION, 2023–2028 (USD MILLION)
- TABLE 110 SPAIN: FLOW CHEMISTRY MARKET, BY REACTOR, 2019–2022 (USD MILLION)
- TABLE 111 SPAIN: FLOW CHEMISTRY MARKET, BY REACTOR, 2023–2028 (USD MILLION)
- TABLE 112 SPAIN: FLOW CHEMISTRY MARKET, BY PURIFICATION METHOD, 2019–2022 (USD MILLION)
- TABLE 113 SPAIN: FLOW CHEMISTRY MARKET, BY PURIFICATION METHOD, 2023–2028 (USD MILLION)
- TABLE 114 SPAIN: FLOW CHEMISTRY MARKET, BY APPLICATION, 2019–2022 (USD MILLION)
- TABLE 115 SPAIN: FLOW CHEMISTRY MARKET, BY APPLICATION, 2023–2028 (USD MILLION)
- TABLE 116 ITALY: FLOW CHEMISTRY MARKET, BY REACTOR, 2019–2022 (USD MILLION)
- TABLE 117 ITALY: FLOW CHEMISTRY MARKET, BY REACTOR, 2023–2028 (USD MILLION)
- TABLE 118 ITALY: FLOW CHEMISTRY MARKET, BY PURIFICATION METHOD, 2019–2022 (USD MILLION)
- TABLE 119 ITALY: FLOW CHEMISTRY MARKET, BY PURIFICATION METHOD, 2023–2028 (USD MILLION)
- TABLE 120 ITALY: FLOW CHEMISTRY MARKET, BY APPLICATION, 2019–2022 (USD MILLION)
- TABLE 121 ITALY: FLOW CHEMISTRY MARKET, BY APPLICATION, 2023–2028 (USD MILLION)
- TABLE 122 REST OF EUROPE: FLOW CHEMISTRY MARKET, BY REACTOR, 2019–2022 (USD MILLION)
- TABLE 123 REST OF EUROPE: FLOW CHEMISTRY MARKET, BY REACTOR, 2023–2028 (USD MILLION)
- TABLE 124 REST OF EUROPE: FLOW CHEMISTRY MARKET, BY PURIFICATION METHOD, 2019–2022 (USD MILLION)
- TABLE 125 REST OF EUROPE: FLOW CHEMISTRY MARKET, BY PURIFICATION METHOD, 2023–2028 (USD MILLION)
- TABLE 126 REST OF EUROPE: FLOW CHEMISTRY MARKET, BY APPLICATION, 2019–2022 (USD MILLION)
- TABLE 127 REST OF EUROPE: FLOW CHEMISTRY MARKET, BY APPLICATION, 2023–2028 (USD MILLION)
- TABLE 128 MIDDLE EAST & AFRICA: FLOW CHEMISTRY MARKET, BY COUNTRY, 2019–2022 (USD MILLION)
- TABLE 129 MIDDLE EAST & AFRICA: FLOW CHEMISTRY MARKET, BY COUNTRY, 2023–2028 (USD MILLION)
- TABLE 130 MIDDLE EAST & AFRICA: FLOW CHEMISTRY MARKET, BY REACTOR, 2019–2022 (USD MILLION)
- TABLE 131 MIDDLE EAST & AFRICA: FLOW CHEMISTRY MARKET, BY REACTOR, 2023–2028 (USD MILLION)
- TABLE 132 MIDDLE EAST & AFRICA: FLOW CHEMISTRY MARKET, BY PURIFICATION METHOD, 2019–2022 (USD MILLION)
- TABLE 133 MIDDLE EAST & AFRICA: FLOW CHEMISTRY MARKET, BY PURIFICATION METHOD, 2023–2028 (USD MILLION)
- TABLE 134 MIDDLE EAST & AFRICA: FLOW CHEMISTRY MARKET, BY APPLICATION, 2019–2022 (USD MILLION)
- TABLE 135 MIDDLE EAST & AFRICA: FLOW CHEMISTRY MARKET, BY APPLICATION, 2023–2028 (USD MILLION)
- TABLE 136 SAUDI ARABIA: FLOW CHEMISTRY MARKET, BY REACTOR, 2019–2022 (USD MILLION)
- TABLE 137 SAUDI ARABIA: FLOW CHEMISTRY MARKET, BY REACTOR, 2023–2028 (USD MILLION)
- TABLE 138 SAUDI ARABIA: FLOW CHEMISTRY MARKET, BY PURIFICATION METHOD, 2019–2022 (USD MILLION)
- TABLE 139 SAUDI ARABIA: FLOW CHEMISTRY MARKET, BY PURIFICATION METHOD, 2023–2028 (USD MILLION)
- TABLE 140 SAUDI ARABIA: FLOW CHEMISTRY MARKET, BY APPLICATION, 2019–2022 (USD MILLION)
- TABLE 141 SAUDI ARABIA: FLOW CHEMISTRY MARKET, BY APPLICATION, 2023–2028 (USD MILLION)
- TABLE 142 SOUTH AFRICA: FLOW CHEMISTRY MARKET, BY REACTOR, 2019–2022 (USD MILLION)
- TABLE 143 SOUTH AFRICA: FLOW CHEMISTRY MARKET, BY REACTOR, 2023–2028 (USD MILLION)
- TABLE 144 SOUTH AFRICA: FLOW CHEMISTRY MARKET, BY PURIFICATION METHOD, 2019–2022 (USD MILLION)
- TABLE 145 SOUTH AFRICA: FLOW CHEMISTRY MARKET, BY PURIFICATION METHOD, 2023–2028 (USD MILLION)
- TABLE 146 SOUTH AFRICA: FLOW CHEMISTRY MARKET, BY APPLICATION, 2019–2022 (USD MILLION)
- TABLE 147 SOUTH AFRICA: FLOW CHEMISTRY MARKET, BY APPLICATION, 2023–2028 (USD MILLION)
- TABLE 148 REST OF MIDDLE EAST & AFRICA: FLOW CHEMISTRY MARKET, BY REACTOR, 2019–2022 (USD MILLION)
- TABLE 149 REST OF MIDDLE EAST & AFRICA: FLOW CHEMISTRY MARKET, BY REACTOR, 2023–2028 (USD MILLION)
- TABLE 150 REST OF MIDDLE EAST & AFRICA: FLOW CHEMISTRY MARKET, BY PURIFICATION METHOD, 2019–2022 (USD MILLION)
- TABLE 151 REST OF MIDDLE EAST & AFRICA: FLOW CHEMISTRY MARKET, BY PURIFICATION METHOD, 2023–2028 (USD MILLION)
- TABLE 152 REST OF MIDDLE EAST & AFRICA: FLOW CHEMISTRY MARKET, BY APPLICATION, 2019–2022 (USD MILLION)
- TABLE 153 REST OF MIDDLE EAST & AFRICA: FLOW CHEMISTRY MARKET, BY APPLICATION, 2023–2028 (USD MILLION)
- TABLE 154 SOUTH AMERICA: FLOW CHEMISTRY MARKET, BY COUNTRY, 2019–2022 (USD MILLION)
- TABLE 155 SOUTH AMERICA: FLOW CHEMISTRY MARKET, BY COUNTRY, 2023–2028 (USD MILLION)
- TABLE 156 SOUTH AMERICA: FLOW CHEMISTRY MARKET, BY REACTOR, 2019–2022 (USD MILLION)
- TABLE 157 SOUTH AMERICA: FLOW CHEMISTRY MARKET, BY REACTOR, 2023–2028 (USD MILLION)
- TABLE 158 SOUTH AMERICA: FLOW CHEMISTRY MARKET, BY PURIFICATION METHOD, 2019–2022 (USD MILLION)
- TABLE 159 SOUTH AMERICA: FLOW CHEMISTRY MARKET, BY PURIFICATION METHOD, 2023–2028 (USD MILLION)
- TABLE 160 SOUTH AMERICA: FLOW CHEMISTRY MARKET, BY APPLICATION, 2019–2022 (USD MILLION)
- TABLE 161 SOUTH AMERICA: FLOW CHEMISTRY MARKET, BY APPLICATION, 2023–2028 (VALUE)
- TABLE 162 BRAZIL: FLOW CHEMISTRY MARKET, BY REACTOR, 2019–2022 (USD MILLION)
- TABLE 163 BRAZIL: FLOW CHEMISTRY MARKET, BY REACTOR, 2023–2028 (USD MILLION)
- TABLE 164 BRAZIL: FLOW CHEMISTRY MARKET, BY PURIFICATION METHOD, 2019–2022 (USD MILLION)
- TABLE 165 BRAZIL: FLOW CHEMISTRY MARKET, BY PURIFICATION METHOD, 2023–2028 (USD MILLION)
- TABLE 166 BRAZIL: FLOW CHEMISTRY MARKET, BY APPLICATION, 2019–2022 (USD MILLION)
- TABLE 167 BRAZIL: FLOW CHEMISTRY MARKET, BY APPLICATION, 2023–2028 (USD MILLION)
- TABLE 168 ARGENTINA: FLOW CHEMISTRY MARKET, BY REACTOR, 2019–2022 (USD MILLION)
- TABLE 169 ARGENTINA: FLOW CHEMISTRY MARKET, BY REACTOR, 2023–2028 (USD MILLION)
- TABLE 170 ARGENTINA: FLOW CHEMISTRY MARKET, BY PURIFICATION METHOD, 2019–2022 (USD MILLION)
- TABLE 171 ARGENTINA: FLOW CHEMISTRY MARKET, BY PURIFICATION METHOD, 2023–2028 (USD MILLION)
- TABLE 172 ARGENTINA: FLOW CHEMISTRY MARKET, BY APPLICATION, 2019–2022 (USD MILLION)
- TABLE 173 ARGENTINA: FLOW CHEMISTRY MARKET, BY APPLICATION, 2023–2028 (USD MILLION)
- TABLE 174 REST OF SOUTH AMERICA: FLOW CHEMISTRY MARKET, BY REACTOR, 2019–2022 (USD MILLION)
- TABLE 175 REST OF SOUTH AMERICA: FLOW CHEMISTRY MARKET, BY REACTOR, 2023–2028 (USD MILLION)
- TABLE 176 REST OF SOUTH AMERICA: FLOW CHEMISTRY MARKET, BY PURIFICATION METHOD, 2019–2022 (USD MILLION)
- TABLE 177 REST OF SOUTH AMERICA: FLOW CHEMISTRY MARKET, BY PURIFICATION METHOD, 2023–2028 (USD MILLION)
- TABLE 178 REST OF SOUTH AMERICA: FLOW CHEMISTRY MARKET, BY APPLICATION, 2019–2022 (USD MILLION)
- TABLE 179 REST OF SOUTH AMERICA: FLOW CHEMISTRY MARKET, BY APPLICATION, 2023–2028 (USD MILLION)
- TABLE 180 FLOW CHEMISTRY MARKET: STRATEGIES ADOPTED BY KEY MANUFACTURERS
- TABLE 181 FLOW CHEMISTRY MARKET: DEGREE OF COMPETITION
- TABLE 182 MARKET EVALUATION FRAMEWORK, 2019–2022
- TABLE 183 PRODUCT LAUNCHES, 2019–2022
- TABLE 184 DEALS, 2019–2022
- TABLE 185 COMPANY FOOTPRINT ANALYSIS, BY REACTOR
- TABLE 186 COMPANY FOOTPRINT ANALYSIS, BY APPLICATION
- TABLE 187 COMPANY FOOTPRINT ANALYSIS, BY PURIFICATION METHOD
- TABLE 188 COMPANY FOOTPRINT ANALYSIS, BY REGION
- TABLE 189 SME FOOTPRINT ANALYSIS, BY REACTOR
- TABLE 190 SME FOOTPRINT ANALYSIS, BY APPLICATION
- TABLE 191 SME FOOTPRINT ANALYSIS, BY PURIFICATION METHOD
- TABLE 192 SME FOOTPRINT ANALYSIS, BY REGION
- TABLE 193 THERMO FISHER SCIENTIFIC: BUSINESS OVERVIEW
- TABLE 194 THERMO FISHER SCIENTIFIC: PRODUCTS/SERVICES/SOLUTIONS OFFERED
- TABLE 195 THERMO FISHER SCIENTIFIC: PRODUCT LAUNCHES
- TABLE 196 THERMO FISHER SCIENTIFIC: DEALS
- TABLE 197 LONZA: BUSINESS OVERVIEW
- TABLE 198 LONZA: PRODUCTS/SERVICES/SOLUTIONS OFFERED
- TABLE 199 LONZA: DEALS
- TABLE 200 CORNING INCORPORATED: BUSINESS OVERVIEW
- TABLE 201 CORNING INCORPORATED: PRODUCTS/SERVICES/SOLUTIONS OFFERED
- TABLE 202 CORNING INCORPORATED: PRODUCT LAUNCHES
- TABLE 203 CORNING INCORPORATED: DEALS
- TABLE 204 CORNING INCORPORATED: OTHERS
- TABLE 205 PERKINELMER: BUSINESS OVERVIEW
- TABLE 206 PERKINELMER: PRODUCTS/SERVICES/SOLUTIONS OFFERED
- TABLE 207 PERKINELMER: PRODUCT LAUNCHES
- TABLE 208 PERKINELMER: DEALS
- TABLE 209 BIOTAGE: BUSINESS OVERVIEW
- TABLE 210 BIOTAGE: PRODUCTS/SERVICES/SOLUTIONS OFFERED
- TABLE 211 BIOTAGE: PRODUCT LAUNCHES
- TABLE 212 BIOTAGE: DEALS
- TABLE 213 MILESTONE SRL: BUSINESS OVERVIEW
- TABLE 214 MILESTONE SRL: PRODUCTS/SERVICES/SOLUTIONS OFFERED
- TABLE 215 MILESTONE SRL: PRODUCT LAUNCHES
- TABLE 216 MILESTONE SRL: DEALS
- TABLE 217 VELOCYS PLC: BUSINESS OVERVIEW
- TABLE 218 VELOCYS PLC: PRODUCTS/SERVICES/SOLUTIONS OFFERED
- TABLE 219 VELOCYS PLC: DEALS
- TABLE 220 THALESNANO: BUSINESS OVERVIEW
- TABLE 221 THALESNANO: PRODUCTS/SERVICES/SOLUTIONS OFFERED
- TABLE 222 THALESNANO: PRODUCT LAUNCHES
- TABLE 223 THALESNANO: DEALS
- TABLE 224 CEM CORPORATION: BUSINESS OVERVIEW
- TABLE 225 CEM CORPORATION: PRODUCTS/SERVICES/SOLUTIONS OFFERED
- TABLE 226 CEM CORPORATION: DEALS
- TABLE 227 PARR INSTRUMENT COMPANY: BUSINESS OVERVIEW
- TABLE 228 PARR INSTRUMENT COMPANY: PRODUCTS/SERVICES/SOLUTIONS OFFERED
- TABLE 229 PARR INSTRUMENT COMPANY: PRODUCT LAUNCHES
- TABLE 230 PARR INSTRUMENT COMPANY: DEALS
- FIGURE 1 FLOW CHEMISTRY MARKET: RESEARCH DESIGN
- FIGURE 2 KEY INDUSTRY INSIGHTS
- FIGURE 3 BREAKDOWN OF PRIMARY INTERVIEWS: BY COMPANY TYPE, DESIGNATION, AND REGION
- FIGURE 4 DATA TRIANGULATION
- FIGURE 5 MARKET SIZE ESTIMATION METHODOLOGY: BOTTOM-UP APPROACH
- FIGURE 6 MARKET SIZE ESTIMATION METHODOLOGY: TOP-DOWN APPROACH
- FIGURE 7 DEMAND-SIDE CALCULATION
- FIGURE 8 METRICS CONSIDERED FOR ANALYZING AND ASSESSING DEMAND FOR FLOW CHEMISTRY
- FIGURE 9 ASIA PACIFIC TO DOMINATE FLOW CHEMISTRY MARKET IN 2023
- FIGURE 10 TABULAR REACTORS TO ACCOUNT FOR LARGEST SHARE OVER FORECAST PERIOD
- FIGURE 11 CHROMATOGRAPHY TO DOMINATE PURIFICATION METHODS MARKET OVER FORECAST PERIOD
- FIGURE 12 CHEMICAL SYNTHESIS SEGMENT TO COMMAND LARGEST MARKET SHARE
- FIGURE 13 INCREASING AWARENESS OF SUSTAINABLE TECHNOLOGY TO BOOST MARKET
- FIGURE 14 ASIA PACIFIC TO GROW AT HIGHEST CAGR DURING FORECAST PERIOD
- FIGURE 15 TABULAR REACTORS TO ACCOUNT FOR LARGEST SHARE BY 2028
- FIGURE 16 CHEMICAL SYNTHESIS SEGMENT TO ACCOUNT FOR LARGEST SHARE IN 2028
- FIGURE 17 CHROMATOGRAPHY AND CRYSTALLIZATION TO HOLD DOMINANT SHARES BY 2028
- FIGURE 18 CHEMICAL SYNTHESIS AND CHINA ACCOUNTED TO HOLD LARGE SHARES IN 2023
- FIGURE 19 FLOW CHEMISTRY MARKET: DRIVERS, RESTRAINTS, OPPORTUNITIES, AND CHALLENGES
- FIGURE 20 PORTER’S FIVE FORCES ANALYSIS: FLOW CHEMISTRY MARKET
- FIGURE 21 FLOW CHEMISTRY MARKET: VALUE CHAIN
- FIGURE 22 EXPORT SCENARIO FOR HS CODE 841989, BY COUNTRY, (2019–2022)
- FIGURE 23 EXPORT SCENARIO FOR HS CODE 3811900, BY COUNTRY, (2019–2022)
- FIGURE 24 IMPORT SCENARIO FOR HS CODE 841989, BY COUNTRY, (2019–2022)
- FIGURE 25 IMPORT SCENARIO FOR HS CODE 3811900, BY COUNTRY, (2019–2022)
- FIGURE 26 PUBLICATION TRENDS OVER LAST TEN YEARS
- FIGURE 27 LEGAL STATUS OF PATENTS FILED FOR FLOW CHEMISTRY
- FIGURE 28 TOP JURISDICTIONS, BY DOCUMENT
- FIGURE 29 TOP APPLICANTS
- FIGURE 30 REVENUE SHIFT OF FLOW CHEMISTRY PROVIDERS
- FIGURE 31 FLOW CHEMISTRY MARKET: ECOSYSTEM
- FIGURE 32 INFLUENCE OF STAKEHOLDERS ON BUYING PROCESS FOR TOP FIVE APPLICATIONS
- FIGURE 33 KEY BUYING CRITERIA FOR END-USER INDUSTRIES
- FIGURE 34 FLOW CHEMISTRY MARKET, BY REACTOR, 2023 VS. 2028
- FIGURE 35 FLOW CHEMISTRY MARKET, BY PURIFICATION METHOD, 2023 VS. 2028
- FIGURE 36 FLOW CHEMISTRY MARKET, BY APPLICATION, 2023 VS. 2028
- FIGURE 37 FLOW CHEMISTRY MARKET: GEOGRAPHIC SNAPSHOT
- FIGURE 38 ASIA PACIFIC: FLOW CHEMISTRY MARKET SNAPSHOT
- FIGURE 39 NORTH AMERICA: FLOW CHEMISTRY MARKET SNAPSHOT
- FIGURE 40 EUROPE: FLOW CHEMISTRY MARKET SNAPSHOT
- FIGURE 41 MIDDLE EAST & AFRICA: FLOW CHEMISTRY MARKET SNAPSHOT
- FIGURE 42 SOUTH AMERICA: FLOW CHEMISTRY MARKET SNAPSHOT
- FIGURE 43 MARKET SHARE ANALYSIS OF TOP FIVE PLAYERS, 2022
- FIGURE 44 MARKET SHARE ANALYSIS, 2022
- FIGURE 45 FLOW CHEMISTRY MARKET: COMPANY EVALUATION QUADRANT, 2022
- FIGURE 46 FLOW CHEMISTRY MARKET: STARTUP/SME EVALUATION QUADRANT, 2022
- FIGURE 47 THERMO FISHER SCIENTIFIC: COMPANY SNAPSHOT
- FIGURE 48 LONZA: COMPANY SNAPSHOT
- FIGURE 49 CORNING INCORPORATED: COMPANY SNAPSHOT
- FIGURE 50 PERKINELMER: COMPANY SNAPSHOT
- FIGURE 51 BIOTAGE: COMPANY SNAPSHOT
The study involved four major activities in estimating the market size of the Flow chemistry market. Exhaustive secondary research was done to collect information on the market, the peer market, and the parent market. The next step was to validate these findings, assumptions, and sizing with industry experts across the value chain through primary research. Both top-down and bottom-up approaches were employed to estimate the complete market size. Thereafter, the market breakdown and data triangulation procedures were used to estimate the market size of the segments and subsegments.
Secondary Research
In the secondary research process, various secondary sources have been referred to for identifying and collecting information for this study. These secondary sources include annual reports, press releases, investor presentations of companies, white papers, certified publications, trade directories, certified publications, articles from recognized authors, gold standard and silver standard websites, and databases.
Secondary research has been used to obtain key information about the value chain of the industry, monetary chain of the market, the total pool of key players, market classification and segmentation according to industry trends to the bottom-most level, and regional markets. It was also used to obtain information about the key developments from a market-oriented perspective.
Primary Research
The flow chemistry market comprises several stakeholders in the value chain, which include raw material suppliers, manufacturers, and end users. Various primary sources from the supply and demand sides of the flow chemistry market have been interviewed to obtain qualitative and quantitative information. The primary interviewees from the demand side include key opinion leaders in end-use sectors. The primary sources from the supply side include manufacturers, associations, and institutions involved in the flow chemistry industry.
Primary interviews were conducted to gather insights such as market statistics, data of revenue collected from the products and services, market breakdowns, market size estimations, market forecasting, and data triangulation. Primary research also helped in understanding the various trends related to flow chemistry by reactor, purification method , applications, and region. Stakeholders from the demand side, such as CIOs, CTOs, and CSOs were interviewed to understand the buyer’s perspective on the suppliers, products, component providers, and their current usage of flow chemistry and future outlook of their business which will affect the overall market.
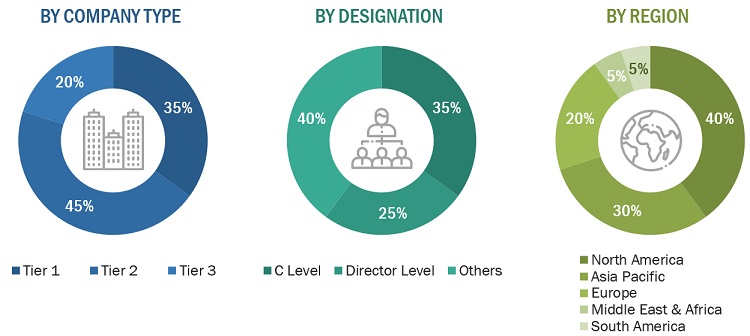
The breakdown of profiles of the primary interviewees is illustrated in the figure below:
To know about the assumptions considered for the study, download the pdf brochure
|
Company Name |
Designation |
|
Thermo Fisher Scientific Inc (US) |
Regional Head |
|
Corning Incorporated (US) |
Sales Manager |
|
Lonza (Switzerland) |
Director |
|
PerkinElmer Inc (US) |
Marketing Manager |
|
Biotage (Sweden) |
R&D Manager |
Market Size Estimation
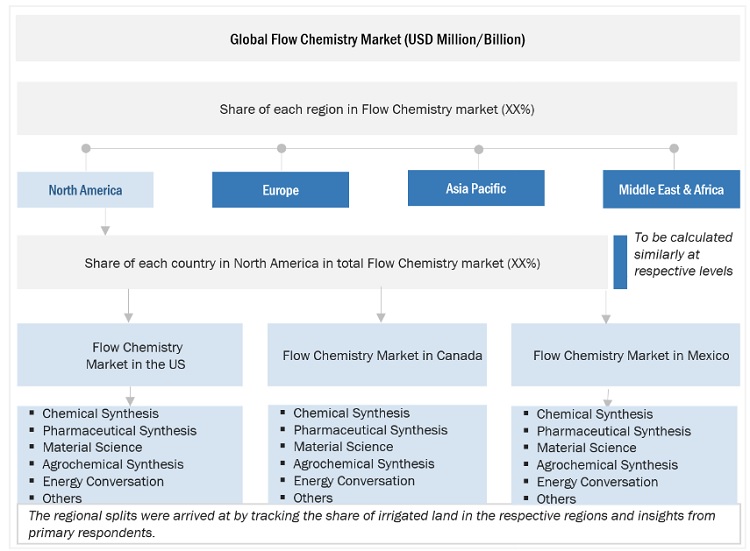
The top-down and bottom-up approaches have been used to estimate and validate the size of the Flow chemistry market.
- The key players in the industry have been identified through extensive secondary research.
- The supply chain of the industry has been determined through primary and secondary research.
- All percentage shares, splits, and breakdowns have been determined using secondary sources and verified through primary sources.
- All possible parameters that affect the markets covered in this research study have been accounted for, viewed in extensive detail, verified through primary research, and analyzed to obtain the final quantitative and qualitative data.
- The research includes the study of reports, reviews, and newsletters of the key market players, along with extensive interviews for opinions with leaders such as directors and marketing executives.
Flow Chemistry Market: Bottum-Up Approach
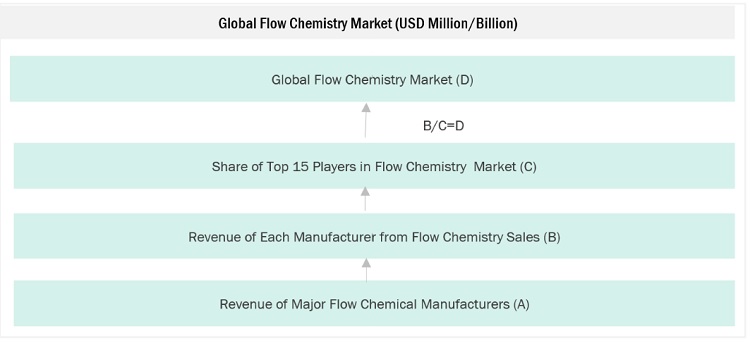
Note: All the shares are based on the global market size.
Source: Secondary Research, Interviews with Experts, and MarketsandMarkets Analysis
To know about the assumptions considered for the study, Request for Free Sample Report
Flow Chemistry Market: Top-Down Approach
Data Triangulation
After arriving at the total market size from the estimation process explained above, the overall market has been split into several segments and sub-segments. To complete the overall market engineering process and arrive at the exact statistics for all the segments and sub-segments, the data triangulation and market breakdown procedures have been employed, wherever applicable. The data has been triangulated by studying various factors and trends from both the demand and supply sides. Along with this, the market size has been validated by using both the top-down and bottom-up approaches and primary interviews. Hence, for every data segment, there have been three sources—top-down approach, bottom-up approach, and expert interviews. The data was assumed correct when the values arrived from the three sources matched.
Market Definition
The fflow chemistry industry refers to the industry and market segment related to the utilization and commercialization of flow chemistry technology. Flow chemistry, also known as continuous flow chemistry or plug flow chemistry, is a chemical manufacturing process that involves the continuous flow of reactants through a reactor system. It is segmented into the by rector, purification method, application and region.
Key Stakeholders
- Senior Management
- End User
- Finance/Procurement Department
- R&D Department
Report Objectives
- To define and describe the flow chemistry market based on reactor, purification method and application, in terms of value.
- To provide detailed information on the major factors influencing the growth of the market (drivers, restraints, opportunities, and challenges)
- To estimate the market size in terms of value.
- To strategically analyze micromarkets1 with respect to individual growth trends, future expansions, and their contributions to the overall Flow chemistry market.
- To provide post-pandemic estimation for the Flow chemistry market and analyze the impact of the pandemic on market growth.
- To analyze market opportunities for stakeholders and the competitive landscape for market leaders.
- To forecast the growth of the Flow chemistry market with respect to five key regions: North America, Europe, Asia Pacific, South America, and the Middle East & Africa, along with their key countries.
- To strategically profile the key players and comprehensively analyze their core competencies2.
- To analyze competitive developments, such as investments & expansions, mergers & acquisitions, product launches, contracts & agreements, and joint ventures & collaborations in the Flow chemistry market
Available Customizations
Along with the given market data, MarketsandMarkets offers customizations according to the company’s specific needs. The following customization options are available for the report:
Regional Analysis
- Further breakdown of a region with respect to a particular country or additional application
Company Information
- Detailed analysis and profiles of additional market players


Growth opportunities and latent adjacency in Flow Chemistry Market