
Membranes Market

Membranes Market by Material (Polymeric, Ceramic), Technology (Reverse Osmosis, Ultrafiltration, Microfiltration, Nanofiltration), Application (Water & Wastewater Treatment, Industrial Processing), and Region - Global Forecast to 2030


MEMBRANES MARKET SIZE & SHARE
Source: Secondary Research, Interviews with Experts, MarketsandMarkets Analysis | Updated on : April 20, 2026
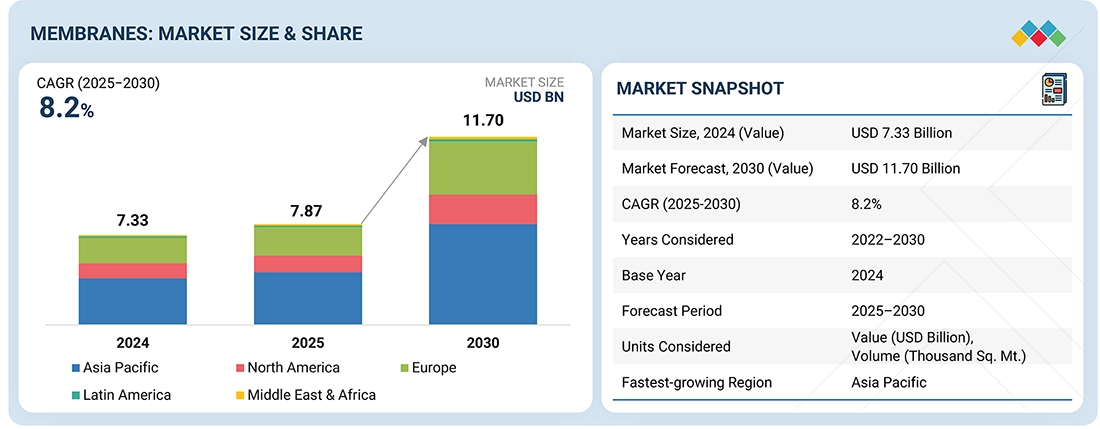
The membranes market size is projected to reach USD 11.70 billion by 2030 from USD 7.87 billion in 2025, at a CAGR of 8.2%. The membrane market size is expanding due to several factors, including the rising demand for clean drinking water, increasing water scarcity, and expanding industrialization. Strict environmental regulations, technological advancements, and the growing applications of membranes in industries such as pharmaceuticals, food & beverage, and chemicals & petrochemicals are also contributing to this growth. Both the materials and technologies associated with membranes are benefiting from these trends.
KEY TAKEAWAYS
-
BY MATERIALThe membranes market includes polymeric, ceramic, and other materials. Polymeric membranes are estimated to account for the largest share and are commercialized and most widely used in water and wastewater treatment applications.
-
BY TECHNOLOGYThe main membrane separation technologies used are reverse osmosis (RO), ultrafiltration (UF), microfiltration (MF), and nanofiltration (NF). Each type of separation technique requires certain specifications, including the material type to be used in membranes, pressure, pore size, and particle size. The market for RO membranes is estimated to lead due to their ability to remove dissolved salts, contaminants, and impurities, making them essential for producing clean and safe drinking water across various applications, thereby addressing global water scarcity and pollution issues.
-
BY APPLICATIONThe application segment of the membranes market is broadly categorized into water & wastewater treatment and industrial processing. Water & wastewater treatment forms the chief application of membranes. Growing demand for sustainable and energy-efficient solutions has accelerated the adoption of membranes over conventional separation technologies, particularly in industries seeking to minimize environmental impact.
-
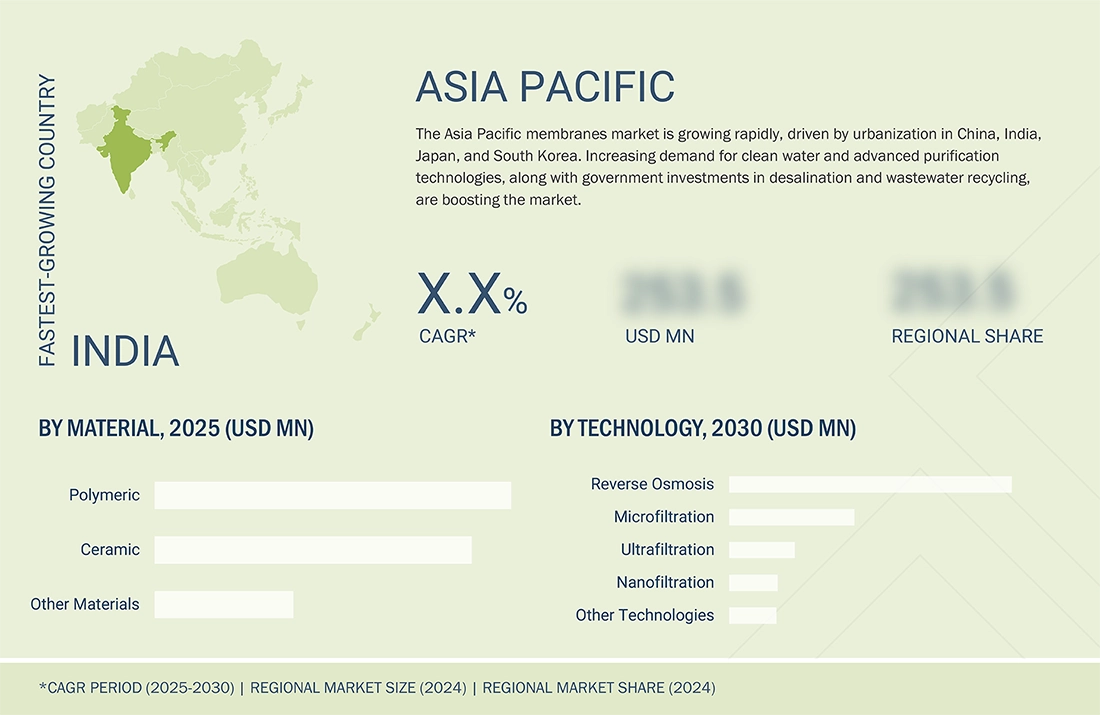
BY REGIONThe membranes market covers Europe, North America, Asia Pacific, South America, the Middle East, and Africa. Asia Pacific is projected to grow fastest, driven by rising population, urbanization, and rapid industrial and infrastructure development, which are, in turn, increasing demand for wastewater treatment plants and membranes.
-
COMPETITIVE LANDSCAPEThe market is driven by strategic collaborations, capacity expansions, and technological innovations from leading players such as DuPont, Toray Industries, Hydranautics, Kovalus Separation Solutions, and Pall Corporation. These companies have strengthened their leadership through strong brand recognition, diverse product offerings, and extensive distribution networks, enabling them to grow alongside the market.
The market growth is propelled by increased awareness regarding water and wastewater treatment, stringent government regulations on water treatment and environmental conservation, and increasing demand for membranes across various end-use industries.
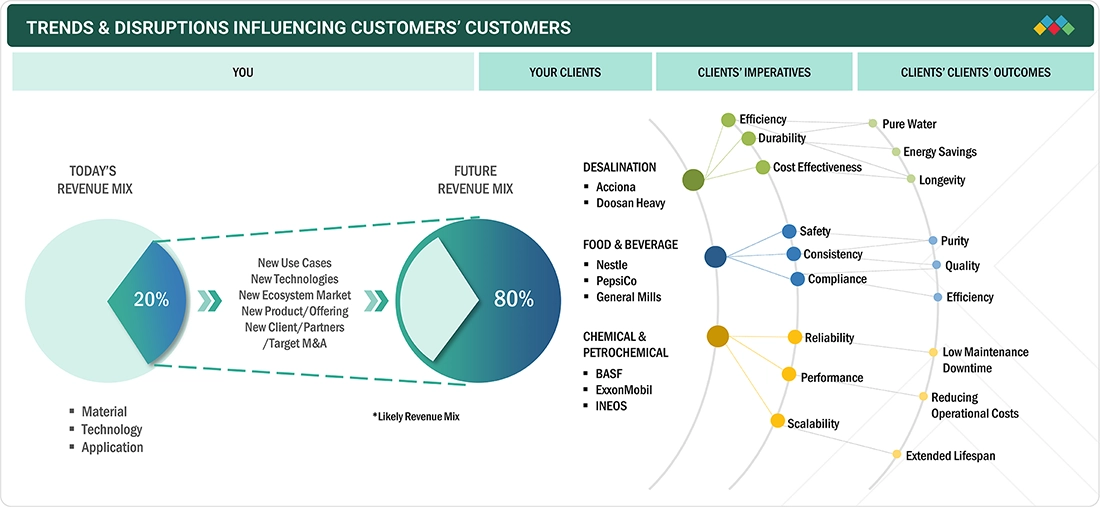
TRENDS & DISRUPTIONS IMPACTING CUSTOMERS' CUSTOMERS
The membranes market is undergoing significant trends and disruptions driven by technological innovation, sustainability goals, and evolving end-user demands. One major trend is the rapid adoption of advanced membrane technologies, such as nanofiltration and forward osmosis, which provide higher selectivity, improved energy efficiency, and longer operational lifespans compared to conventional systems. The market is also seeing a strong push toward sustainable and eco-friendly solutions, including membranes with reduced chemical usage, recyclable materials, and enhanced fouling resistance, aligning with stricter environmental regulations worldwide.
Source: Secondary Research, Interviews with Experts, MarketsandMarkets Analysis
MEMBRANES MARKET DYNAMICS
Level
-
Increasing awareness about water & wastewater treatment

-
Shift from chemical to physical treatment of water

Level
-
Fouling and scaling reduce membrane performance

-
Limited compatibility and high energy consumption

Level
-
Rising demand for water treatment in developing countries

-
Circular economy initiatives

Level
-
Issue related to lifespan and efficiency of membranes

-
Discharge of brine as waste from RO membranes

Source: Secondary Research, Interviews with Experts, MarketsandMarkets Analysis
Driver: Growing awareness regarding water & wastewater treatment
Rising awareness about water and wastewater treatment technology is key to the membranes market. There is growing concern worldwide over water scarcity, pollution, and sustainability. The rapid growth of urbanization and industrialization has increased the demand for safe, clean water, prompting municipalities and industries to adopt new treatment technologies to deliver pure water and meet stricter environmental regulations. Technologies such as reverse osmosis, nanofiltration, ultrafiltration, and microfiltration have made membrane filtration widely accepted in water treatment due to their ability to selectively remove contaminants, pathogens, and dissolved solids, providing potable water and enabling wastewater reuse. There is a strong awareness of the health risks associated with poor water quality, particularly issues related to heavy metals, pesticides, pharmaceuticals, and biological contaminants. This awareness continues to drive investments in next-generation membranes, which are more efficient, reliable, and scalable for municipal and industrial use. Moreover, sustainability is more than just a trend; it supports water reuse and recycling improvements through advanced membrane technologies. The global shortage of freshwater, driven by population growth and climate change, is pushing governments and regulators worldwide to strengthen water quality and discharge standards.
Restraint: Fouling and scaling in membranes reduce performance
Fouling and scaling are key issues in the membranes sector because they directly affect the efficiency, lifespan, and sustainability of membrane-based filtration systems. Fouling occurs when organic matter, microorganisms, colloidal particles, and suspended solids accumulate on the membrane surface or enter through the pores. This buildup reduces permeate flux, increases differential pressure, and degrades membrane permeability, which lowers output and water quality while raising operational costs due to more frequent cleaning and maintenance. Similarly, scaling involves the deposition of inorganic salts (such as calcium carbonate, silica, and magnesium salts) that precipitate when their solubility limits are exceeded, forming a hard, crystalline layer on the membrane surface. Both fouling and scaling increase energy consumption by making it harder to maintain flow rates or requiring operators to raise system pressure, increasing electricity usage and operational expenses. Over time, both issues lead to premature membrane replacement, shorter membrane lifespans, higher costs for anti-scaling or anti-fouling chemicals, and more complex pretreatment procedures.
Opportunity: Rising demand for water treatment in emerging economies
As the demand for water treatment in developing countries rises due to rapid urbanization, growing industrialization, and increased concerns over water availability and pollution, new opportunities for the membranes market emerge. In regions like Asia Pacific, Latin America, the Middle East, and Africa, increasing population, migration to urban areas, and expanding manufacturing bases have strained water infrastructure. For municipal and other interested industries, finding solutions to maintain a clean water supply and manage treated wastewater has become crucial. Recognizing that traditional water sources are becoming scarcer and more polluted in developing economies, municipalities in these regions have heavily invested in advanced treatment technologies, especially membrane filtration, to provide safe drinking water, meet regulatory standards, and support sustainable growth. These membranes offer higher efficiencies in removing contaminants, pathogens, and trace industrial chemicals, supporting the water supply for potable water production and targeted treated water reuse systems, such as reclaim. Emerging economies such as China, India, Indonesia, and Vietnam are working on significant infrastructure improvements and rapidly installing new technologies supported by partnerships and strengthened public-private relationships. Contributing to this rapid deployment of advanced treatment technologies are government programs or international financial aid that specifically support unique treatment processes (for example, desalination, zero-liquid discharge systems) and the use of membranes in municipal and industrial water treatment.
Challenges: Discharge of brine as waste from RO membranes
The release of brine as waste from reverse osmosis (RO) membranes will remain a difficult issue for the membranes sector and industry; future improvements in desalination and water reclamation projects will likely worsen the problem globally. For each RO membrane cycle, 40–60% of the input water is turned into fresh water, while the rest exits as brine (a concentrated saline effluent containing high levels of salt, residual chemicals, antiscalants, and sometimes heavy metals). Discharging RO brine into natural water bodies, especially oceans and coastal zones, alters local salinity, temperature, and chemical balance, which can be harmful to marine environments, as brine tends to cause osmotic stress, affect habitat quality, and be lethal to benthic organisms that may not be able to escape multi-saline zones during discharge.
Membranes Market: COMMERCIAL USE CASES ACROSS INDUSTRIES
| COMPANY | USE CASE DESCRIPTION | BENEFITS |
|---|---|---|
 |
Reverse osmosis and nanofiltration membranes installed at the zero-liquid discharge system | Increase in fouling and chemical resistance, removal of the backwash process, and minimize energy consumption |
 |
Nanofiltration membranes used in a dextrose production plant | Resisting biofouling with energy consumption reduced by 50%, recovered 90% of water for recycling, and increased dextrose yield by 15% |
 |
Nanofiltration membrane system to handle high volumes of saline, oil-contaminated wastewater | Enabled 70% of the treated water to be reused for enhanced oil recovery, reducing freshwater demand by 50% and minimizing brine disposal costs |
 |
An ultrafiltration and reverse osmosis membrane system to treat river water for boiler feed in power station | Eliminated frequent chemical dosing, extended equipment life by reducing downtime 70% and freshwater costs by 55% through recycling concentrate streams |
Logos and trademarks shown above are the property of their respective owners. Their use here is for informational and illustrative purposes only.
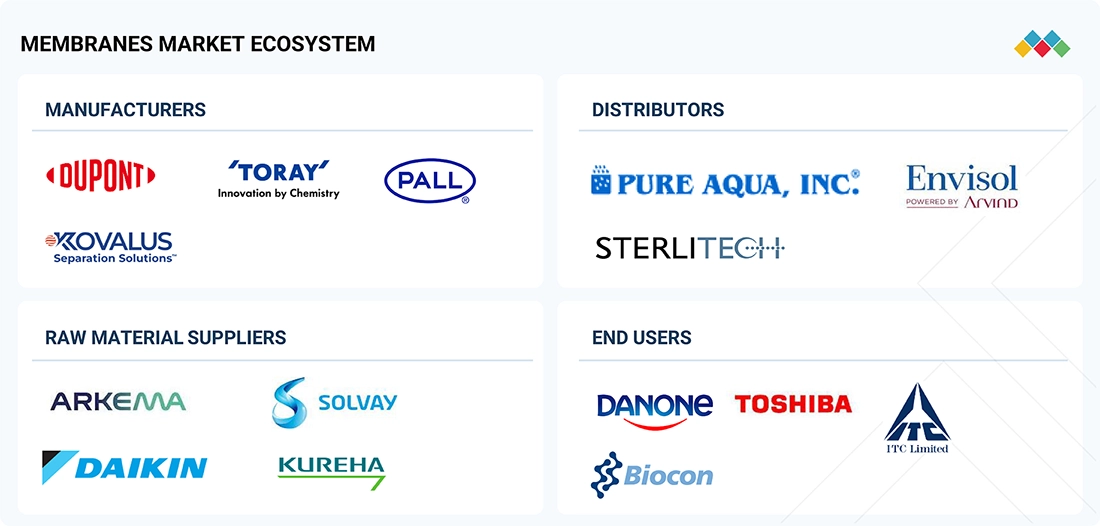
MEMBRANES MARKET ECOSYSTEM
The membranes market ecosystem includes manufacturers, distributors, and end users. The supply chain extends to wholesalers and retailers. Manufacturers focus on specific products and membrane types (microfiltration, ultrafiltration, nanofiltration, and reverse osmosis) and produce a broad range of offerings. Advances in materials, system designs, and fouling mitigation strategies to enhance performance and efficiency—and thus lower operational costs for end users—are essential factors. End users influence the supply chain through their increasing demand for water purification, wastewater recycling and treatment, and adherence to government and environmental regulations worldwide, especially in developing countries experiencing rapid urbanization and industrial growth.
Logos and trademarks shown above are the property of their respective owners. Their use here is for informational and illustrative purposes only.
MEMBRANES MARKET SEGMENTS
Source: Secondary Research, Interviews with Experts, MarketsandMarkets Analysis
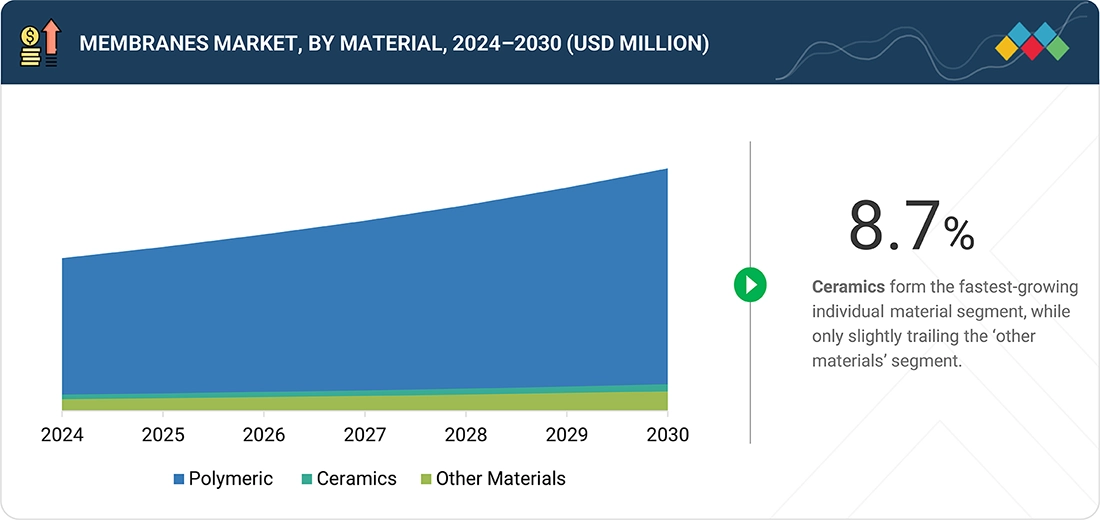
Membranes Market, by Material
Among the standalone material segments, Ceramic materials are rapidly becoming the leading segment in terms of growth in the membranes market due to their advantageous properties. Their inherent durability and resilience set them apart from conventional polymeric membranes, as they offer superior resistance to harsh chemicals, extreme temperatures, and mechanical stress. This makes them ideal for demanding industrial applications. The extended lifespan and lower maintenance costs of ceramic membranes make them a financially prudent choice for industries requiring reliable filtration solutions.
Membranes Market, by Technology
Reverse osmosis (RO) membranes are projected to continue as the largest share of the membranes market within the technology category because of their outstanding ability to remove dissolved salts, contaminants, and impurities, producing clean and safe drinking water from various sources. RO membranes are used in almost all residential, commercial, municipal, and industrial applications for desalination, wastewater treatment, and purification. This helps address global water scarcity and pollution issues. RO membranes can reject a broad range of contaminant classes, making them a dependable option that meets international water quality standards. Moreover, RO processes have become more energy-efficient, and membranes more versatile, durable, and affordable.
Membranes Market, by Application
The membranes market for applications is led by water and wastewater treatment, which holds the largest market share. This growth is primarily driven by the global demand for clean and safe water due to urbanization, industrialization, and stricter environmental regulations. Water and wastewater treatment networks have increasingly relied on membrane technologies such as membrane-based reverse osmosis (RO), ultrafiltration (UF), nanofiltration (NF), and microfiltration (MF). These methods significantly simplify the removal of contaminants, pathogens, and dissolved solids from water and wastewater. As authorities and industries place greater emphasis on water purification and effluent recycling to address global water scarcity, pollution, and sustainability issues, the acceptance of membrane filtration systems has grown in both municipal and industrial sectors.
REGION
Asia Pacific to be fastest-growing region in global Membranes market during forecast period
The membranes market in the Asia Pacific region is experiencing rapid growth compared to other parts of the world. With rapid urbanization and industrialization happening in China, India, Japan, and South Korea, there is an increasing demand for clean water and wastewater treatment solutions. The quick growth in the population of Asia Pacific and the middle class is also driving the demand for technologically advanced water purification technologies. Outside of Australia and New Zealand, governments in the rest of the region are investing heavily in infrastructure development, including desalination, municipal water treatment, and wastewater recycling, where membranes are gaining market traction.
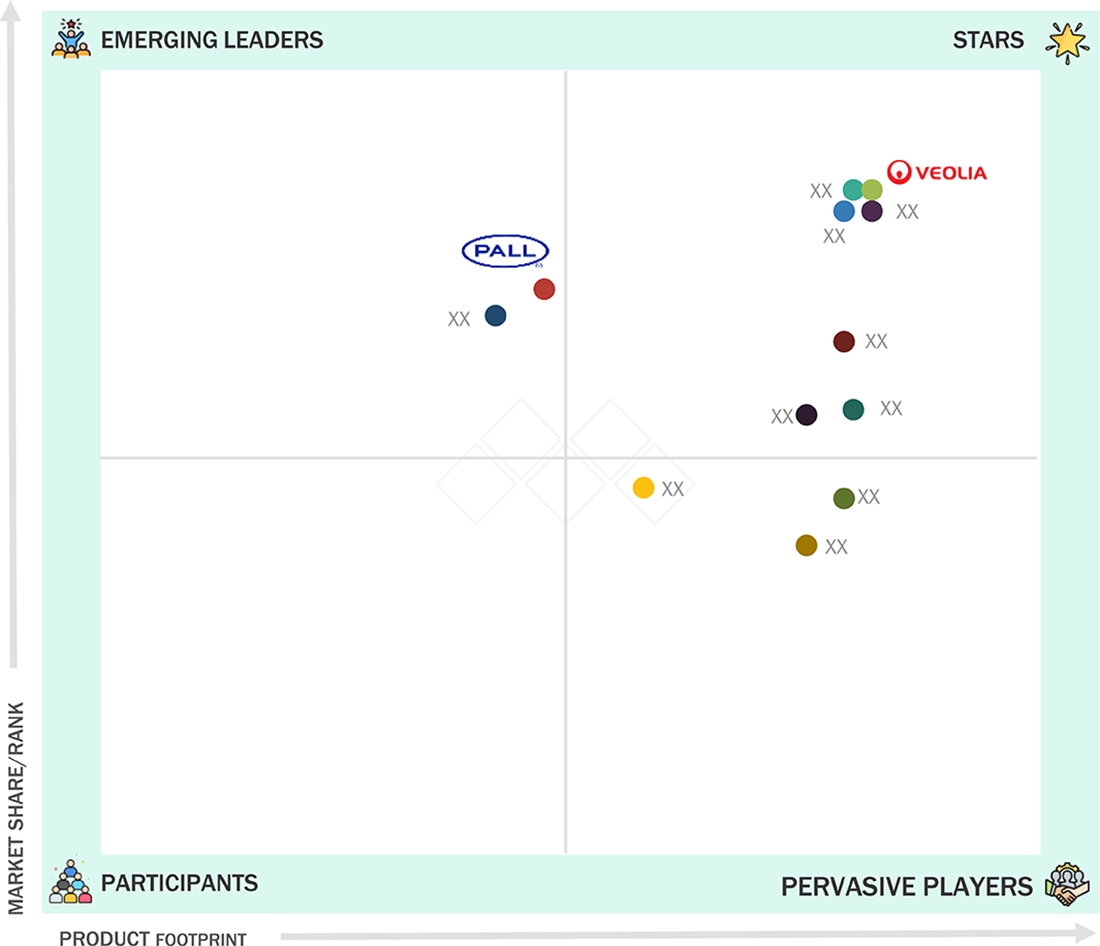
Membranes Market: COMPANY EVALUATION MATRIX
In the membranes market matrix, Veolia (Star) is one of the leading global suppliers of membranes, having a wide product portfolio, strong market presence, and effective business strategies. Pall Corporation (Emerging Leader) is gaining traction with the development of substantial innovative products compared to competitors. It has robust potential to build strong business strategies to expand its business.
Source: Secondary Research, Interviews with Experts, MarketsandMarkets Analysis
KEY MARKET PLAYERS
MARKET SCOPE
| REPORT METRIC | DETAILS |
|---|---|
| Market Size, 2024 (Value) | USD 7.33 Billion |
| Market Forecast, 2030 (Value) | USD 11.70 Billion |
| Growth Rate | CAGR of 8.2% from 2025 to 2030 |
| Years Considered | 2022–2030 |
| Base Year | 2024 |
| Forecast Period | 2025–2030 |
| Units Considered | Value (USD Million/Billion), Volume (Thousand Sq. Mtr.) |
| Report Coverage | Revenue forecast, company ranking, competitive landscape, growth factors, and trends |
| Segments Covered |
|
| Regions Covered | North America, Asia Pacific, Europe, South America, Middle East & Africa |
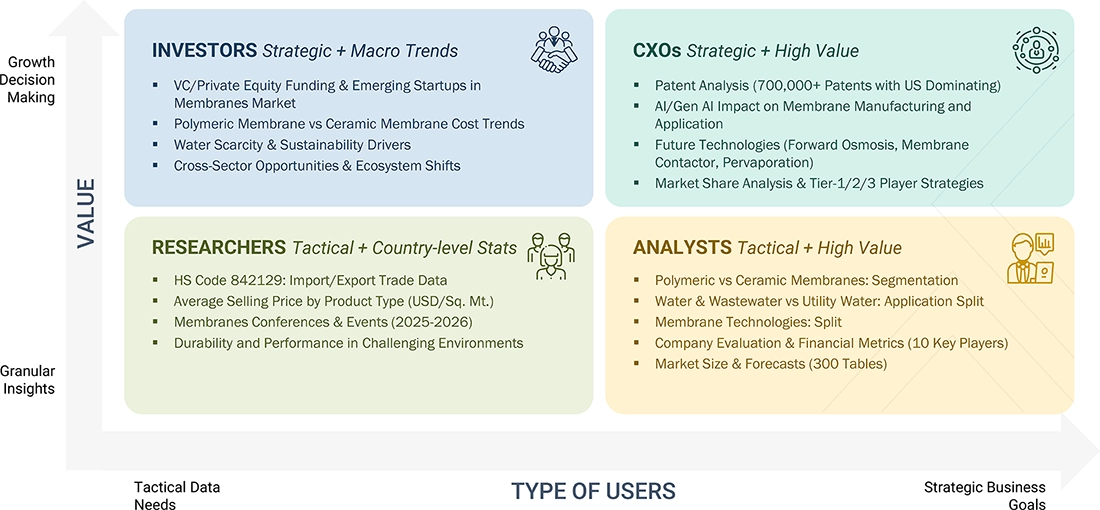
WHAT IS IN IT FOR YOU: Membranes Market REPORT CONTENT GUIDE
DELIVERED CUSTOMIZATIONS
We have successfully delivered the following deep-dive customizations:
| CLIENT REQUEST | CUSTOMIZATION DELIVERED | VALUE ADDS |
|---|---|---|
| US-based Membrane Manufacturers |
|
|
| Food & Beverage Manufacturer |
|
|
| Europe-based Membrane Distributor |
|
|
| China-based Raw Material Supplier |
|
|
RECENT DEVELOPMENTS
- January 2025 : Toray Industries, Inc. introduced a high-efficiency separation membrane module designed for biopharmaceutical manufacturing.
- March 2024 : Toray Industries announced a highly durable reverse osmosis (RO) membrane that is twice as resistant to cleaning chemicals. This innovation aimed to reduce membrane wear and carbon footprints by halving replacement frequency. It was designed for demanding applications like industrial wastewater reuse and desalination.
- December 2021 : DuPont partnered with Water.org, an international nonprofit organization, to expand global access to safe water.
- April 2021 : Kovalus Separation Solutions introduced INDU-COR HD (High Density), an advanced technology for treating various industrial waste streams, as part of its tubular membrane product line.
- October 2020 : Hydranautics partnered with NX Filtration, a manufacturer of innovative hollow fiber membrane solutions. Through this, it transitioned its HYDRAcap™ product line to NX Filtration.
Table of Contents
 Exclusive indicates content/data unique to MarketsandMarkets and not available with any competitors.
Methodology
The study involved four main activities in estimating the market size of the membranes market. Extensive secondary research was conducted to gather information on the market, peer markets, and parent markets. The next step was to validate these findings, assumptions, and sizing with industry experts across the value chain through primary research. Both top-down and bottom-up approaches were used to estimate the total market size. Then, market breakdown and data triangulation procedures were applied to estimate the sizes of segments and subsegments.
Secondary Research
In the secondary research process, various sources were referred to for gathering information for this study. These sources include annual reports, press releases, investor presentations, white papers, certified publications, trade directories, articles by recognized authors, reputable websites, and databases. Secondary research helped gather key details about the industry’s value chain, monetary chain, the number of key players, market classification, and segmentation based on industry trends down to the regional level. It was also used to find important market developments from a market-focused perspective.
Primary Research
The membranes market includes various stakeholders in the value chain, such as manufacturers and end users. Key sources from the supply and demand sides of the market were interviewed to gather qualitative and quantitative information. Demand-side interviewees include notable industry leaders in various sectors. Supply-side sources include manufacturers, associations, and organizations involved in the membranes industry. These primary interviews provided insights into market statistics, revenue data, market segmentation, size estimates, forecasts, and data validation. The research also clarified trends related to materials, technologies, applications, and regions. Stakeholders from the demand side, like CIOs, CTOs, and CSOs, were interviewed to understand their perspective on suppliers, products, current membrane use, and their business outlook, which influences the overall market.
The breakdown of profiles of the primary interviewees is illustrated in the figure below:

Note: Tier 1, Tier 2, and Tier 3 companies are classified based on their market revenue in 2024, available in the public domain, product portfolios, and geographical presence.
Other designations include consultants and sales, marketing, and procurement managers.
To know about the assumptions considered for the study, download the pdf brochure
Market Size Estimation
The top-down and bottom-up approaches have been used to estimate and validate the size of the membranes market.
- The key players in the industry have been identified through extensive secondary research.
- The supply chain of the industry has been mapped out through both primary and secondary research.
- All percentage shares, splits, and breakdowns have been determined using secondary sources and confirmed through primary sources.
- All relevant parameters affecting the markets covered in this study have been thoroughly considered, examined in detail, verified through primary research, and analyzed to produce the final quantitative and qualitative data.
- The research includes the analysis of reports, reviews, and newsletters from key market players, along with comprehensive interviews with leaders such as directors and marketing executives.

Data Triangulation
After estimating the total market size, the market has been divided into several segments and sub-segments. Data triangulation and market breakdown methods have been used where applicable to finalize the overall market analysis and determine precise statistics for all segments and sub-segments. The data was triangulated by examining various factors and trends from both demand and supply sides. Additionally, the market size was validated using both top-down and bottom-up approaches, along with primary interviews. Therefore, each data segment was supported by three sources—the top-down approach, bottom-up approach, and expert interviews. The data was considered accurate when the values from the three sources matched.
Market Definition
Membranes are thin, selective barrier materials that separate particles, microorganisms, and dissolved solids in liquids or gases. Membrane processes are widely used in water and wastewater treatment, industrial processes, and healthcare, employing microfiltration, ultrafiltration, nanofiltration, and reverse osmosis. The demand for clean water, environmental regulations, and advancements in high-performance, long-lasting membrane materials and manufacturing techniques drives the growing membranes market.
Stakeholders
- Senior management
- End users
- Finance/Procurement department
- R&D department
- Manufacturers
- Raw material suppliers
Report Objectives
- To define, describe, and forecast the size of the membranes market, in terms of value and volume
- To provide detailed information regarding the major factors (drivers, opportunities, restraints, and challenges) influencing the growth of the market
- To estimate and forecast the market size based on material, technology, application, and region
- To forecast the size of the market with respect to major regions, namely, Europe, North America, Asia Pacific, the Middle East & Africa, and South America, along with their key countries
- To strategically analyze micro-markets with respect to individual growth trends, prospects, and their contribution to the overall market
- To analyze opportunities in the market for stakeholders and provide a competitive landscape of market leaders
- To track and analyze recent developments such as expansions, new product launches, partnerships & agreements, and acquisitions in the market
- To strategically profile key market players and comprehensively analyze their core competencies
Key Questions Addressed by the Report
What is the current size of the global membranes market?
The membranes market is estimated to reach USD 11.70 billion by 2030 from USD 7.87 billion in 2025, at a CAGR of 8.2% during the forecast period.
Who are the key players in the global membranes market?
Dupont (US), Toray Industries Inc (Japan), Hydranautics (Nitto Denko Group Company) (US), Kovalus Separation Solutions (US), Pall Corporation (US), Veolia (France), Pentair (US), Asahi Kasei Corporation (Japan), LG Chem (South Korea), and Mann+Hummel (Germany).
What are some of the drivers for market growth?
Increasing awareness about water & wastewater treatment and stringent wastewater regulations.
What are the different materials used in membranes?
Polymeric, ceramic, and other materials are widely used in this market.
What are the major applications in the membranes market?
Water & wastewater treatment, industrial processing, and other applications.
Need a Tailored Report?
Customize this report to your needs
Get 10% FREE Customization
Customize This ReportPersonalize This Research
- Triangulate with your Own Data
- Get Data as per your Format and Definition
- Gain a Deeper Dive on a Specific Application, Geography, Customer or Competitor
- Any level of Personalization
Let Us Help You
- What are the Known and Unknown Adjacencies Impacting the Membranes Market
- What will your New Revenue Sources be?
- Who will be your Top Customer; what will make them switch?
- Defend your Market Share or Win Competitors
- Get a Scorecard for Target Partners

Custom Market Research Services
We Will Customise The Research For You, In Case The Report Listed Above Does Not Meet With Your Requirements
Get 10% Free CustomisationTESTIMONIALS

We at Nissan Chemicals Corporation have been clients of MarketsandMarkets for more than a year now. We recently consulted MarketsandMarkets for a study, the team at MarketsandMarkets was extremely professional and organized. The business insights were very detailed and aligned well with our expectations that really helped us formulate the Business Plans and device new strategies for development themes. MarketsandMarkets offers a unique combination of expertise and dedicated engagement model. Their research findings have helped us in designing our Pricing Strategy which will make it easier for us to predict the future sales and profits for the next ten years. We look forward to working with MarketsandMarkets in the future.
VP of Strategy & New Business Development
Leading Specialty Chemical Company
The MarketsandMarkets Engagement Model, composed of both the Knowledge Store and advisory custom research, has greatly helped us in understanding our markets and making strategic decisions. The Knowledge Store is a fast way to allow everyone in our organization to understand more about most any market they are interested in. The ability to then get custom research done and get answers to specific strategic questions and market insight has been spectacular. The Markets and Markets team feel more like colleagues than vendors and their services have helped us change our culture where statements of things like growth opportunities and competitive position are always backed by industry research.

Rich Gibson,
Director, Corporate Strategy
Milliken & Company,
Leading Industrial Manufacturer of specialty chemical, floor covering, performance and protective textile materials, and healthcaremilliken.com
MarketsandMarkets is a trusted resource that helps us to better understand markets that are near-adjacencies-whether its technology, value chain or geography. Their Knowledge Store platform provides a dashboard of markets and their characteristics which is easy to use and saves us time.
Adam Shaw,
Market Development and Strategy Manager
AdvanSix Inc. USA,
An American Leader in Chemicalswww.advansix.com
The Knowledge Store from MarketsandMarkets is a valuable tool which has helped my team acquire greater insight in to the end markets that our business serves. This has enabled us to help our company build stronger strategies throughout our planning process.
TOSHIO KINOSHITA
Senior Chif Consultion Research & Consulting Division
Mitsubishi Chemical Research Corporation,
Leading Manufacturer of Chemical Productswww.mitsubishichem-res.co.jp/en/

We recently engaged with MarketsandMarkets for a study, the team not only clearly understood our business objectives but was also extremely professional in the way they handled the entire project. The study was efficiently conducted in a phase-wise manner, and the engagement model furnished us with high-quality business insights that far exceeded our expectations at each phase. We were especially happy that MarketsandMarkets could provide us with both, an English as well as a Japanese version of the study. A special thanks to the Analyst Team and Client Services Team, whose fluency in Japanese enhanced our comfort level, as we could converse with them in our preferred language.
Independent entrepreneurs
Arrow Precision
We approached MarketsandMarkets for study on Proppants Market, and their work exceeded our expectations. The study conducted was comprehensive and enabled us to view the market through the various dimensions. In addition, the team was extraordinarily responsive throughout the process and resolved our queries on time. I strongly recommend MarketsandMarkets and will certainly consider them for additional market assessments we will need in the future.
Global engineering company, Japan
Deputy Manager,
Strategic Planning OfficeThe high-quality insights shared by the MarketsandMarkets team helped us understand the pharmaceutical plant designers in a specific geography. It also captured the risks that we may likely face in communicating with our potential partners. The study would enable us identify partners, which would impact our future growth.


Growth opportunities and latent adjacency in Membranes Market