Food Service Packaging Market by Material (Plastic, Metal), Packaging Type (Flexible, Rigid, Paper & Paperboard), Application (Alcoholic Beverages, Non-alcoholic Beverages, Fruits & Vegetables, Bakery & Confectionery) - Global Forecast to 2022


[209 Pages Report] The overall food service packaging market is expected to grow from USD 62.57billion in 2016 to USD 84.33 billion by 2021, at a CAGR of 5.23% from 2017 to 2022. Food service packaging is used to package processed and semi-processed food products. It caters to service sectors such as restaurants, fast-food joints, takeaway restaurants, and catering services. It helps in maintaining the hygiene, quality, and safety of food products. It provides heat resistance, prevents the growth of microorganisms, and helps extend the shelf-life of the food product. The base year considered for the study is 2016, and the forecast has been provided for the period between 2017 and 2022.
Market Dynamics
Drivers
- Cost-effectiveness of food service pacakging
- Downsizing of pacakging
- Rising demand for convenience food
- On-the-go lifestyle to impel the growth of the food service packaging technology & equipment
Restraints
- Strigent rules & regulations
Opportunities
- Growing demand for sustainable packaging solutions
- Emphasis on modern technologies in packaging industry
- Emerging markets represent great business expansion opportunities
Challenges
- Rising instances of food wastage
Cost-effectiveness of food service packaging
There has been a gradual shift in consumer choice from traditional methods of preparing food at home to buying packaged products. Food service packaging mediums require less resources and energy as they are manufactured with recycled material; hence, packaged and disposable packs are available at low cost and importantly, occupy 35% less retail shelf space, making it cost-effective. It also offers a perfect alternative for display by creating more options for eye-catching graphics, ultimately increasing the marketability of the product.
The food service packaging market has a positive outlook due to high growth in the food industry and the beverages sector. It is easy to open food service packaging packs as they are available in the form of both rigid as well as flexible, which makes it convenient for handling the product. Due to busy lifestyles, the demand for convenient products has increased, which has led to a rise in the demand for flexible and rigid packs. Due to this, transport and shipping costs are cheaper for food service packaging. Furthermore, it reduces fuel consumption in terms of transportation.
The following are the major objectives of the study.
- To describe and forecast the global food service packaging market on the basis of material, application, packaging type, and region
- To describe and forecast the food service packaging market, in terms of value and volume, by region�Asia Pacific (APAC), Europe, North America, South America, and Middle East & Africa along with their respective countries
- To provide detailed information regarding major factors influencing market growth (drivers, restraints, opportunities, and challenges)
- To strategically analyze micromarkets with respect to individual growth trends, prospects, and contributions to the overall market
- To analyze opportunities in the market for stakeholders by identifying the high-growth segments of the food service packaging ecosystem
- To strategically profile key players and comprehensively analyze their market position in terms of ranking and core competencies, along with detailing competitive landscape for market leaders
- To analyze strategic approaches such as product launches, acquisitions, contracts, agreements, and partnerships in the food service packaging market
During this research study, major players operating in the food service packaging market in various regions have been identified, and their offerings, regional presence, and distribution channels have been analyzed through in-depth discussions. Top-down and bottom-up approaches have been used to determine the overall market size. Sizes of the other individual markets have been estimated using the percentage splits obtained through secondary sources such as Hoovers, Bloomberg BusinessWeek, and Factiva, along with primary respondents. The entire procedure includes the study of the annual and financial reports of the top market players and extensive interviews with industry experts such as CEOs, VPs, directors, and marketing executives for key insights (both qualitative and quantitative) pertaining to the market. The figure below shows the breakdown of the primaries on the basis of the company type, designation, and region considered during the research study.
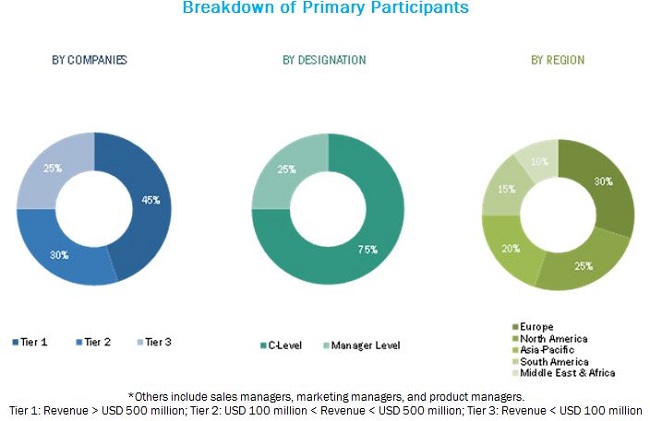
To know about the assumptions considered for the study, download the pdf brochure
The food service packaging market comprises a network of players involved in the research and product development; raw material supply; component manufacturing; distribution and sale; and post-sales services. Key players considered in the analysis of the food service packaging market are as Amcor Limited (Australia), The Dow Chemical Company (U.S.), Bemis Company, Inc (U.S.), Westrock Company (U.S.), Sealed Air Corporation (U.S.), International Paper Company (U.S.), Reynolds Group Holding Limited (New Zealand), DS Smith Plc (U.K), Huhtamaki Oyj (Finland) Berry Plastic Corporation (U.S.), Ball Corporation (U.S.), Genpak, LLC (U.S.), Dart Product Europe Limited (U.K), Anchor Packaging Inc. (U.S.), Vegware (U.K), Sabert Corporation (U.S.), Union packaging (U.S.), Fabri-Kal (U.S.), Excellent Packaging & Supply (U.S.), BSI Biodegradable Solution (Canada), ISAP Packaging SPA (Italy), Landon Bio Packaging (U.K),Hefei Hengxin Environmental Science & Technology Co., Ltd (China),King Yuan Fu Packaging Co., Ltd. (Taiwan) Bionatic GMBH & Co.Kg (Germany).
Major Market Developments
- In September 2016, Amcor�s rigid plastic business group acquired the plastic blow molding operation of Sonoco Product (U.S.). The acquisition strengthened the company�s product portfolio and its position in North American market
- In June 2016, Ball Corporation acquired Rexam PLC (U.K.), a producer of beverage cans. The acquisition transaction was approximately worth USD 6.1 billion. The acquisition helped Ball become the largest manufacturer of beverage cans in Europe.
- In July 2015, Amcor acquired Packaging India Private Limited (PIPL) (India) for approximately USD 40 million. It had four flexible packaging plants in West and North India. The acquisition of PIPL expanded Amcor�s business horizon in India and increased the product portfolio.
Target Audience:
- Raw material suppliers
- Industry bodies
- Food packaging manufacturers
- Industry bodies
- Logistics partners
- Machinery suppliers
- Regulatory bodies
- Food service packaging related technology investors
Report Scope:
By Material:
- Plastic
- Metal
- Others
By Applications:
- Alcoholic beverages
- Non-alcoholic beverages
- Fruits and vegetables
- Dairy products
- Bakery & Confectionery
- Meat & Poultry
- Others
By Packaging type:
- Paper & Paperboard Packaging
- Flexible Packaging
- Rigid Packaging
- Others
By Region:
- North America
- Europe
- Asia-Pacific
- Middle East & Africa
- South America
Critical questions which the report answers
- What are new application areas which the food service packaging are exploring?
- Which are the key players in the market and how intense is the competition?
Available Customizations:
Based on the given market data, MarketsandMarkets offers customizations in the reports as per the client�s specific requirements. The available customization options are as follows:
Geographic Analysis
- Further country-wise breakdown of the market in APAC based on application
Company Information
- Detailed analysis and profiling of additional market players (Up to 5)
The overall food service packaging market is expected to grow from USD 65.36 billion in 2017 to USD 84.33 billion by 2022 at a CAGR of 5.23%. Packaging trends evolve in accordance with consumer demand, and consequently, with production and storage needs. The change in consumer demand patterns is the most influencing factor transforming the packaging industry. The growing demand for ready-to-eat food and the popularity of using convenient packaging are driving the demand for food service packaging.
Food service packaging is used to package processed and semi-processed food products. It caters to service sectors such as restaurants, fast-food joints, takeaway restaurants, and catering services. It helps in maintaining the hygiene, quality, and safety of food products. It provides heat resistance, prevents the growth of microorganisms, and helps extend the shelf-life of the food product.
The food service packaging market has been segmented, on the basis of packaging type, into flexible packaging, paper & paperboard packaging, rigid packaging and others. The market for flexible packaging is expected to grow at the highest CAGR between 2017 and 2022. The increasing demand for sustainable packaging has propelled the market for flexible packaging in the food service packaging industry.
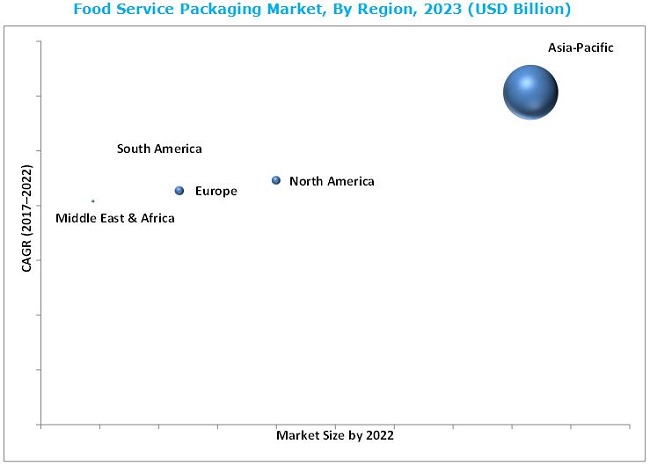
The food service packaging market in Asia Pacific is expected to grow at the highest CAGR during the forecast period. Asia-Pacific is projected to grow faster than any other region-level market, as it is the most widely populated region in the world, countries such as India and China are expected to witness high growth in the food service packaging market due to the growing developmental activities and rapid economic expansion. In addition to this, the growing population in these countries present a large customer base for fast moving consumer goods (FMCG) products and consumer durables, which in turn is expected to lead to the growth of the food service packaging market.
Rising demand for convenience food drive the growth of food service packaging
Beverages
Beverages include various types of drinks, based on their constituents and their compositions. There are various types of beverages such as alcoholic and non-alcoholic. Global players are aiming at using innovative packaging materials, developed from degradable and recyclable materials to achieve sustainability. The expectations for quality & hygiene and growth in health awareness are driving the food service packaging market growth in the beverages sector.
Fruits & Vegetables
With the increasingly busy work schedules of people, there has been a rise in the demand for ready-to-cook vegetables, including microwave meals. The most consumed canned vegetables include tinned tomatoes, peas, baked beans, and mushrooms. Also, the packaging of fruits has gained importance in the global food packaging market. Food service packing helps in preserving the nutritional value of fruits, while providing an extended shelf-life. The most consumed canned fruits include pineapples, blackberries, cherries, and grapes.
Bakery & Confectionery
The bakery & confectionery category includes chocolates, chewing gums, and other related items, such as cereals, breads, pizzas, and biscuits. The major players in this category, such as The Kraft Heinz Company (U.S.) and Nestle S.A. (Switzerland), are concerned about the packaging of these products, as the products get spoiled due to oxidation. Packaging has an important application in this product category as it also helps in flavor retention, texture maintenance, and maintenance of product appearance, while inhibiting rancidity and microbial growth. The growing consumer base for branded confectioneries in developing nations, such as India and China, has fueled the market for packaging technologies in the bakery & confectionery industry.
Dairy Products
Dairy products are the most perishable food products. This category includes butter, cheese, curd, and yogurt; most of these products get easily spoiled if they are not packaged efficiently. The various kinds of packages of dairy products include pouches, sachets, barrels, cups, cans, and bottles. Consumers with busy lifestyles want the packaging to be both convenient and protective. Freshness, natural taste, and visual appeal with an extended shelf-life are the factors driving the market for dairy product packaging. The demand for dairy products has been on the rise due to the rapidly increasing population in developing nations as well.
Critical questions the report answers:
- Where will all these developments take the industry in the mid to long term?
- What are the upcoming industry applications for reed sensors?
To speak to our analyst for a discussion on the above findings, click Speak to Analyst
Stringent rules & regulations is the major factor restraining the growth of food service packaging market. Stringent regulations imposed for food service packaging may pose as a restraint but to a lower extent for the market. Compliance with regulations is necessary as the smallest defect in the packaging may contaminate the product. It will also negatively impact the manufacturer�s profit. Packaging for food & beverages, personal care, and healthcare requires control on moisture, light barriers, and ease of transport.
Regulatory authorities ensure that the raw materials used are recyclable, such as plastic, paper & paperboard, and cellulose. The packaging industry needs to make packaging sustainable and at low costs. Using raw materials that are biodegradable costs higher than their non-biodegradable counterparts. This adds to the production costs, which further increases the cost pressure, thereby limiting the growth of the food service packaging market.
Key players in the market include as Amcor Limited (Australia), The Dow Chemical Company (U.S.), Bemis Company, Inc (U.S.), Westrock Company (U.S.), Sealed Air Corporation (U.S.), International Paper Company (U.S.), Reynolds Group Holding Limited (New Zealand), DS Smith Plc (U.K), Huhtamaki Oyj (Finland) Berry Plastic Corporation (U.S.), Ball Corporation (U.S.), Genpak, LLC (U.S.), Dart Product Europe Limited (U.K), Anchor Packaging Inc. (U.S.), Vegware (U.K), Sabert Corporation (U.S.), Union packaging (U.S.), Fabri-Kal (U.S.), Excellent Packaging & Supply (U.S.), BSI Biodegradable Solution (Canada), ISAP Packaging SPA (Italy), Landon Bio Packaging (U.K),Hefei Hengxin Environmental Science & Technology Co., Ltd (China),King Yuan Fu Packaging Co., Ltd. (Taiwan) Bionatic GMBH & Co.Kg (Germany). These players are increasingly undertaking mergers and acquisitions, and product launches to develop and introduce new technologies and products in the market.
 Exclusive indicates content/data unique to MarketsandMarkets and not available with any competitors.
Table of Contents
1 Introduction (Page No. - 21)
1.1 Objectives of the Study
1.2 Market Definition
1.3 Market Scope
1.3.1 Regional Scope
1.3.2 Years Considered for Study
1.4 Currency Considered for the Study
1.5 Units Considered for the Study
1.6 Limitation
1.7 Stakeholders
2 Research Methodology (Page No. - 24)
2.1 Research Data
2.1.1 Secondary Data
2.1.1.1 Key Data From Secondary Sources
2.1.2 Primary Data
2.1.2.1 Key Data From Primary Sources
2.1.2.2 Break Down of Primaries
2.2 Market Size Estimation
2.2.1 Bottom-Up Approach
2.2.2 Top-Down Approach
2.3 Data Triangulation
2.4 Research Assumptions
3 Executive Summary (Page No. - 32)
4 Premium Insights (Page No. - 36)
4.1 Developing Economies to Witness Higher Demand for Food Service Packaging
4.2 Food Service Packaging Market, By Material
4.3 Food Service Packaging Market, By Packaging Type
4.4 Food Service Packaging Market, By Application
4.5 North America: Food Service Packaging Market
4.6 Food Service Packaging Market, By Country
5 Market Overview (Page No. - 41)
5.1 Introduction
5.2 Evolution of the Food Service Packaging Market
5.3 Market Dynamics
5.3.1 Drivers
5.3.1.1 Cost-Effectiveness of Food Service Packaging
5.3.1.2 Downsizing of Packaging
5.3.1.3 Rising Demand for Convenience Food
5.3.1.4 On-The-Go Lifestyles to Impel the Growth of the Food Service Packaging Technology & Equipment Market
5.3.2 Restraints
5.3.2.1 Stringent Rules & Regulations
5.3.3 Opportunities
5.3.3.1 Growing Demand for Sustainable Packaging Solutions
5.3.3.2 Emphasis on Modern Technologies in the Packaging Industry
5.3.3.3 Emerging Markets Represent Great Business Expansion Opportunities
5.3.4 Challenges
5.3.4.1 Rising Instances of Food Wastage
6 Food Service Packaging Market, By Material (Page No. - 48)
6.1 Introduction
6.2 Plastic
6.2.1 Polyethylene
6.2.2 Polyamide
6.2.3 Ethylene Vinyl Alcohol
6.3 Metal
6.4 Others
7 Food Service Packaging Market, By Packaging Type (Page No. - 53)
7.1 Introduction
7.2 Paper & Paperboard
7.3 Flexible
7.4 Rigid
7.5 Others
8 Food Service Packaging Market, By Application (Page No. - 57)
8.1 Introduction
8.2 Beverages
8.3 Fruits & Vegetables
8.4 Bakery & Confectionery
8.5 Dairy Products
8.6 Others
9 Food Service Packaging Market, By Region (Page No. - 61)
9.1 Introduction
9.2 North America
9.2.1 North America: Food Service Packaging Market, By Country
9.2.2 North America: By Market, By Material
9.2.3 North America: By Market, By Packaging Type
9.2.4 North America: By Market, By Application
9.2.5 U.S.
9.2.5.1 U.S.: Food Service Packaging Market, By Material
9.2.5.2 U.S.: By Market, By Packaging Type
9.2.5.3 U.S.: By Market, Application
9.2.6 Canada
9.2.6.1 Canada: Food Service Packaging Market, By Material
9.2.6.2 Canada: By Market, By Packaging Type
9.2.6.3 Canada: By Market, Application
9.2.7 Mexico
9.2.7.1 Mexico: Food Service Packaging Market, By Material
9.2.7.2 Mexico: By Market, By Packaging Type
9.2.7.3 Mexico: By Market, Application
9.3 Europe
9.3.1 Europe: Food Service Packaging Market, By Country
9.3.2 Europe: By Market, By Material
9.3.3 Europe: By Market, By Packaging Type
9.3.4 Europe: By Market, By Application
9.3.5 U.K.
9.3.5.1 U.K.: Food Service Packaging Market, By Material
9.3.5.2 U.K.: By Market, By Packaging Type
9.3.5.3 U.K.: By Market, By Application
9.3.6 Germany
9.3.6.1 Germany: Food Service Packaging Market, By Material
9.3.6.2 Germany: By Market, By Packaging Type
9.3.6.3 Germany: By Market, By Application
9.3.7 France
9.3.7.1 France: Food Service Packaging Market, By Material
9.3.7.2 France: By Market, By Packaging Type
9.3.7.3 France: By Market, By Application
9.3.8 Spain
9.3.8.1 Spain: Food Service Packaging Market, By Material
9.3.8.2 Spain: By Market, By Packaging Type
9.3.8.3 Spain: By Market, By Application
9.3.9 Italy
9.3.9.1 Italy: Food Service Packaging Market, By Material
9.3.9.2 Italy: By Market, By Packaging Type
9.3.9.3 Italy: By Market, By Application
9.3.10 Rest of Europe
9.3.10.1 Rest of Europe: Food Service Packaging Market, By Material
9.3.10.2 Rest of Europe: By Market, By Packaging Type
9.3.10.3 Rest of Europe: By Market, By Application
9.4 Asia-Pacific
9.4.1 Asia-Pacific: Food Service Packaging Market, By Country
9.4.2 Asia-Pacific: By Market, By Material
9.4.3 Asia-Pacific: By Market, By Packaging Type
9.4.4 Asia-Pacific: By Market, By Application
9.4.5 China
9.4.5.1 China: Food Service Packaging Market, By Material
9.4.5.2 China: By Market, By Packaging Type
9.4.5.3 China: By Market, By Application
9.4.6 Japan
9.4.6.1 Japan: Food Service Packaging Market, By Material
9.4.6.2 Japan: By Market, By Packaging Type
9.4.6.3 Japan: By Market, By Application
9.4.7 Australia
9.4.7.2 Australia: Food Service Packaging Market, By Material
9.4.7.3 Australia: By Market, By Packaging Type
9.4.7.4 Australia: By Market, By Application
9.4.8 India
9.4.8.1 India: Food Service Packaging Market, By Material
9.4.8.2 India: By Market, By Packaging Type
9.4.8.3 India: By Market, By Application
9.4.9 South Korea
9.4.9.1 South Korea: Food Service Packaging Market, By Material
9.4.9.2 South Korea: By Market, By Packaging Type
9.4.9.3 South Korea: By Market, By Application
9.4.10 Rest of Asia-Pacific
9.4.10.1 Rest of Asia-Pacific: Food Service Packaging Market, By Material
9.4.10.2 Rest of Asia-Pacific: By Market, By Packaging Type
9.4.10.3 Rest of Asia-Pacific: By Market, By Application
9.5 Middle East & Africa
9.5.1 Middle East & Africa: Food Service Packaging Market, By Country
9.5.2 Middle East & Africa: By Market, By Material
9.5.3 Middle East & Africa: By Market, By Packaging Type
9.5.4 Middle East & Africa: By Market, By Application
9.5.5 Turkey
9.5.5.1 Turkey: Food Service Packaging Market, By Material
9.5.5.2 Turkey: By Market, By Packaging Type
9.5.5.3 Turkey: By Market, By Application
9.5.6 UAE
9.5.6.1 UAE: Food Service Packaging Market, By Material
9.5.6.2 UAE: By Market, By Packaging Type
9.5.6.3 UAE: By Market, By Application
9.5.7 South Africa
9.5.7.1 South Africa: Food Service Packaging Market, By Material
9.5.7.2 South Africa: By Market, By Packaging Type
9.5.7.3 South Africa: By Market, By Application
9.5.8 Rest of Middle East & Africa
9.5.8.1 Rest of Middle East & Africa: Food Service Packaging Market, By Material
9.5.8.2 Rest of Middle East & Africa: By Market, By Packaging Type
9.5.8.3 Rest of Middle East & Africa: By Market, By Application
9.6 South America
9.6.1 South America: Food Service Packaging Market, By Country
9.6.2 South America: By Market, By Material
9.6.3 South America: By Market, By Packaging Type
9.6.4 South America: By Market, By Application
9.6.5 Brazil
9.6.5.1 Brazil: Food Service Packaging Market, By Material
9.6.5.2 Brazil: By Market, By Packaging Type
9.6.5.3 Brazil: By Market, By Application
9.6.6 Argentina
9.6.6.1 Argentina: Food Service Packaging Market, By Material
9.6.6.2 Argentina: By Market, By Packaging Type
9.6.6.3 Argentina: By Market, By Application
9.6.7 Rest of South America
9.6.7.1 Rest of South America: Food Service Packaging Market, By Material
9.6.7.2 Rest of South America: By Market, By Packaging Type
9.6.7.3 Rest of South America: By Market, By Application
10 Competitive Landscape (Page No. - 156)
10.1 Introduction
10.2 Dynamic, Innovators, Vanguards, and Emerging
10.2.1 Dynamic
10.2.2 Innovators
10.2.3 Vanguards
10.2.4 Emerging
10.3 Product Offerings
10.4 Business Strategy
11 Company Profiles (Page No. - 161)
(Overview, Financial*, Products & Services, Strategy, and Developments)
11.1 Amcor Limited
11.2 Bemis Company, Inc.
11.4 The DOW Chemical Company
11.5 Westrock Company
11.6 Ball Corporation
11.7 Huhtamaki OYJ
11.8 Sealed Air Corporation
11.9 Berry Plastic Corporation
11.10 Reynolds Group Holding
11.11 International Paper Company
11.12 DS Smith PLC
11.13 Others
11.13.1 Genpak, LLC
11.13.2 Dart Products Europe Limited
11.13.3 Anchor Packaging, Inc.
11.13.4 Vegware Ltd.
11.13.5 Sabert Corporation
11.13.6 Union Packaging
11.13.7 Fabri-Kal
11.13.8 BSI Biodegradable Solutions
11.13.9 ISAP Packaging SPA
11.13.10 London Bio Packaging
11.13.11 Hefei Hengxin Environmental Science & Technology Co., Ltd
11.13.12 King Yuan Fu Packaging Co., Ltd.
11.13.13 GmbH & Co. Kg
11.13.14 Excellent Packaging & Supply
*Details Might Not Be Captured in Case of Unlisted Companies.
12 Appendix (Page No. - 202)
12.1 Discussion Guide
12.2 Knowledge Store: Marketsandmarkets Subscription Portal
12.3 Introducing RT: Real-Time Market Intelligence
12.4 Available Customizations
12.5 Related Reports
12.6 Author Details
List of Tables (180 Tables)
Table 1 Food Service Packaging Market Size, By Material, 2015�2022(USD Billion)
Table 2 Market Size, By Material, 2015�2022 (Billion Units)
Table 3 Food Service Packaging Market Size, By Packaging Type, 2015�2022 (USD Billion)
Table 4 By Market Size, By Packaging Type, 2015�2022 (Billion Units)
Table 5 Food Service Packaging Market Size, By Application, 2015�2022 (USD Billion)
Table 6 By Market Size, By Application, 2015�2022 (Billion Units)
Table 7 Food Service Packaging Market Size, By Region, 2015�2022 (USD Billion)
Table 8 By Market Size, By Region, 2015�2022 (Billion Units)
Table 9 North America: Food Service Packaging Market Size, By Country, 2015�2022 (USD Billion)
Table 10 North America: By Market Size, By Country, 2015�2022 (Billion Units)
Table 11 North America: Food Service Packaging Market Size, By Material, 2015�2022 (USD Billion)
Table 12 North America: By Market Size, By Material, 2015�2022 (Billion Units)
Table 13 North America: Food Service Packaging Market Size, By Packaging Type, 2015�2022 (USD Billion)
Table 14 North America: By Market Size, Packaging Type, 2015�2022 (Billion Units)
Table 15 North America: Food Service Packaging Market Size, By Application, 2015�2025 (USD Billion)
Table 16 North America: By Market Size, Application, 2015�2022 (Billion Units)
Table 17 U.S.: Food Service Packaging Market Size, By Material, 2015�2022 (USD Billion)
Table 18 U.S.: By Market Size, By Material, 2015�2022 (Billion Units)
Table 19 U.S.: Food Service Packaging Market Size, By Packaging Type, 2015�2022 (USD Billion)
Table 20 U.S.: By Market Size, By Packaging Type, 2015�2022 (Billion Units)
Table 21 U.S.: Food Service Packaging Market Size, By Application, 2015�2022 (USD Billion)
Table 22 U.S.: By Market Size, Application, 2015�2022 (Billion Units)
Table 23 Canada: Food Service Packaging Market Size, By Material, 2015�2022 (USD Billion)
Table 24 Canada: By Market Size, By Material, 2015�2022 (Billion Units)
Table 25 Canada: Food Service Packaging Market Size, By Packaging Type, 2015�2022 (USD Billion)
Table 26 Canada: By Market Size, By Packaging Type, 2015�2022 (Billion Units)
Table 27 Canada: Food Service Packaging Market Size, By Application, 2015�2022 (USD Billion)
Table 28 Canada: By Market Size, Application, 2015�2022 (Billion Units)
Table 29 Mexico: Food Service Packaging Market Size, By Material, 2015�2022 (USD Billion)
Table 30 Mexico: By Market Size, By Material, 2015�2022 (Billion Units)
Table 31 Mexico: Food Service Packaging Market Size, By Packaging Type, 2015�2022 (USD Billion)
Table 32 Mexico: By Market Size, By Packaging Type, 2015�2022 (Billion Units)
Table 33 Mexico: Food Service Packaging Market Size, By Application, 2015�2022 (USD Billion)
Table 34 Mexico: By Market Size, By Application, 2015�2022 (Billion Units)
Table 35 Europe: Food Service Packaging Market Size, By Country, 2015�2022(USD Billion)
Table 36 Europe: By Market Size, By Country, 2015�2022 (Billion Units)
Table 37 Europe: Food Service Packaging Market Size, By Material, 2015�2022 (USD Billion)
Table 38 Europe: By Market Size, By Material, 2015�2022 (Billion Units)
Table 39 Europe: Food Service Packaging Market Size, By Packaging Type, 2015�2022 (USD Billion)
Table 40 Europe: By Market Size, By Packaging Type, 2015�2022 (Billion Units)
Table 41 Europe: Food Service Packaging Market Size, By Application, 2015�2022 (USD Billion)
Table 42 Europe: By Market Size, By Application, 2015�2022 (Billion Units)
Table 43 U.K.: Food Service Packaging Market Size, By Material, 2015�2022 (USD Billion)
Table 44 U.K.: By Market Size, By Material, 2015�2022 (Billion Units)
Table 45 U.K.: Food Service Packaging Market Size, By Packaging Type, 2015�2022 (USD Billion)
Table 46 U.K.: By Market Size, By Packaging Type, 2015�2022 (Billion Units)
Table 47 U.K.: Food Service Packaging Market Size, By Application, 2015�2022 (USD Billion)
Table 48 U.K.: By Market Size, By Application, 2015�2022 (Billion Units)
Table 49 Germany: Food Service Packaging Market Size, By Material, 2015�2022 (USD Billion)
Table 50 Germany: By Market Size, By Material, 2015�2022 (Billion Units)
Table 51 Germany: Food Service Packaging Market Size, By Packaging Type, 2015�2022 (USD Billion)
Table 52 Germany: By Market Size, By Packaging Type, 2015�2022 (Billion Units)
Table 53 Germany: Food Service Packaging Market Size, By Application, 2015�2022 (USD Billion)
Table 54 Germany: By Market Size, By Application, 2015�2022 (Billion Units)
Table 55 France: Food Service Packaging Market Size, By Material, 2015�2022 (USD Billion)
Table 56 France: By Market Size, By Material, 2015�2022 (Billion Units)
Table 57 France: Food Service Packaging Market Size, By Packaging Type, 2015�2022 (USD Billion)
Table 58 France: By Market Size, By Packaging Type, 2015�2022 (Billion Units)
Table 59 France: Food Service Packaging Market Size, By Application, 2015�2022 (USD Billion)
Table 60 France: By Market Size, By Application, 2015�2022 (Billion Units)
Table 61 Spain: Food Service Packaging Market Size, By Material, 2015�2022 (USD Billion)
Table 62 Spain: By Market Size, By Material, 2015�2022 (Billion Units)
Table 63 Spain: Food Service Packaging Market Size, By Packaging Type, 2015�2022 (USD Billion)
Table 64 Spain: By Market Size, By Packaging Type, 2015�2022 (Billion Units)
Table 65 Spain: Food Service Packaging Market Size, By Application, 2015�2022 (USD Billion)
Table 66 Spain: By Market Size, By Application, 2015�2022 (Billion Units)
Table 67 Italy: Food Service Packaging Market Size, By Material, 2015�2022 (USD Billion)
Table 68 Italy: By Market Size, By Material, 2015�2022 (Billion Units)
Table 69 Italy: Food Service Packaging Market Size, By Packaging Type, 2015�2022 (USD Billion)
Table 70 Italy: By Market Size, By Packaging Type, 2015�2022 (Billion Units)
Table 71 Italy: Food Service Packaging Market Size, By Application, 2015�2022 (USD Billion)
Table 72 Italy: By Market Size, By Application, 2015�2022 (Billion Units)
Table 73 Rest of Europe: Food Service Packaging Market Size, By Material, 2015�2022 (USD Billion)
Table 74 Rest of Europe: By Market Size, By Material, 2015�2022 (Billion Units)
Table 75 Rest of Europe: Food Service Packaging Market Size, By Packaging Type, 2015�2022 (USD Billion)
Table 76 Rest of Europe: By Market Size, By Packaging Type, 2015�2022 (Billion Units)
Table 77 Rest of Europe: Food Service Packaging Market Size, By Application, 2015�2022 (USD Billion)
Table 78 Rest of Europe: By Market Size, By Application, 2015�2022 (Billion Units)
Table 79 Asia-Pacific: Food Service Packaging Market Size, By Country, 2015�2022 (USD Billion)
Table 80 Asia-Pacific: By Market Size, By Country, 2015�2022 (Billion Units)
Table 81 Asia-Pacific: Food Service Packaging Market Size, By Material, 2015�2022 (USD Billion)
Table 82 Asia-Pacific: By Market Size, By Material, 2015�2022 (Billion Units)
Table 83 Asia-Pacific: Food Service Packaging Market Size, By Packaging Type, 2015�2022 (USD Billion)
Table 84 Asia-Pacific: By Market Size, By Packaging Type, 2015�2022 (Billion Units)
Table 85 Asia-Pacific: Food Service Packaging Market Size, By Application, 2015�2022 (USD Billion)
Table 86 Asia-Pacific: By Market Size, By Application, 2015�2022 (Billion Units)
Table 87 China: Food Service Packaging Market Size, By Material, 2015�2022 (USD Billion)
Table 88 China: By Market Size, By Material, 2015�2022 (Billion Units)
Table 89 China: Food Service Packaging Market Size, By Packaging Type, 2015�2022 (USD Billion)
Table 90 China: By Market Size, By Packaging Type, 2015�2022 (Billion Units)
Table 91 China: Food Service Packaging Market Size, By Application, 2015�2022 (USD Billion)
Table 92 China: By Market Size, By Application, 2015�2022 (Billion Units)
Table 93 Japan: Food Service Packaging Market Size, By Material, 2015�2022 (USD Billion)
Table 94 Japan: By Market Size, By Material, 2015�2022 (Billion Units)
Table 95 Japan: Food Service Packaging Market Size, By Packaging Type, 2015�2022 (USD Billion)
Table 96 Japan: By Market Size, By Packaging Type, 2015�2022 (Billion Units)
Table 97 Japan: Food Service Packaging Market Size, By Application, 2015�2022 (USD Billion)
Table 98 Japan: By Market Size, By Application, 2015�2022 (Billion Units)
Table 99 Australia: Food Service Packaging Market Size, By Material, 2015�2022 (USD Billion)
Table 100 Australia: By Market Size, By Material, 2015�2022 (Billion Units)
Table 101 Australia: Food Service Packaging Market Size, By Packaging Type, 2015�2022 (USD Billion)
Table 102 Australia: By Market Size, By Packaging Type, 2015�2022 (Billion Units)
Table 103 Australia: Food Service Packaging Market Size, By Application, 2015�2022 (USD Billion)
Table 104 Australia: By Market Size, By Application, 2015�2022 (Billion Units)
Table 105 India: Food Service Packaging Market Size, By Material, 2015�2022 (USD Billion)
Table 106 India: By Market Size, By Material, 2015�2022 (Billion Units)
Table 107 India: Food Service Packaging Market Size, By Packaging Type, 2015�2022 (USD Billion)
Table 108 India: By Market Size, By Packaging Type, 2015�2022 (Billion Units)
Table 109 India: Food Service Packaging Market Size, By Application, 2015�2022 (USD Billion)
Table 110 India: By Market Size, By Application, 2015�2022 (Billion Units)
Table 111 South Korea: Food Service Packaging Market Size, By Material, 2015�2022 (USD Billion)
Table 112 South Korea: By Market Size, By Material, 2015�2022 (Billion Units)
Table 113 South Korea: By Market Size, By Packaging Type, 2015�2022 (USD Billion)
Table 114 South Korea: By Market Size, By Packaging Type, 2015�2022 (Billion Units)
Table 115 South Korea: By Market Size, By Application, 2015�2022 (USD Billion)
Table 116 South Korea: By Market Size, By Application, 2015�2022 (Billion Units)
Table 117 Rest of Asia-Pacific: Food Service Packaging Market Size, By Material, 2015�2022 (USD Billion)
Table 118 Rest of Asia-Pacific: By Market Size, By Material, 2015�2022 (Billion Units)
Table 119 Rest of Asia-Pacific: By Market Size, By Packaging Type, 2015�2022 (USD Billion)
Table 120 Rest of Asia-Pacific: By Market Size, By Packaging Type, 2015�2022 (Billion Units)
Table 121 Rest of Asia-Pacific: By Market Size, By Application, 2015�2022 (USD Billion)
Table 122 Rest of Asia-Pacific: By Market Size, By Application, 2015�2022 (Billion Units)
Table 123 Middle East & Africa: Food Service Packaging Market Size, By Country, 2015�2022 (USD Billion)
Table 124 Middle East & Africa: By Market Size, By Country, 2015�2022 (Billion Units)
Table 125 Middle East & Africa: By Market Size, By Material, 2015�2022 (USD Billion)
Table 126 Middle East & Africa: By Market Size, By Material, 2015�2022 (Billion Units)
Table 127 Middle East & Africa: By Market Size, By Packaging Type, 2015�2022 (USD Billion)
Table 128 Middle East & Africa: By Market Size, By Packaging Type, 2015�2022 (Billion Units)
Table 129 Middle East & Africa: By Market Size, By Application, 2015�2022 (USD Billion)
Table 130 Middle East & Africa: By Market Size, By Application, 2015�2022 (Billion Units)
Table 131 Turkey: Food Service Packaging Market Size, By Material, 2015�2022 (USD Billion)
Table 132 Turkey: By Market Size, By Material, 2015�2022 (Billion Units)
Table 133 Turkey: By Market Size, By Packaging Type, 2015�2022 (USD Billion)
Table 134 Turkey: By Market Size, By Packaging Type, 2015�2022 (Billion Units)
Table 135 Turkey: By Market Size, By Application, 2015�2022 (USD Billion)
Table 136 Turkey: By Market Size, By Application, 2015�2022 (Billion Units)
Table 137 UAE: Food Service Packaging Market Size, By Material, 2015�2022 (USD Billion)
Table 138 UAE: By Market Size, By Material, 2015�2022 (Billion Units)
Table 139 UAE: By Market Size, By Packaging Type, 2015�2022 (USD Billion)
Table 140 UAE: By Market Size, By Packaging Type, 2015�2022 (Billion Units)
Table 141 UAE: By Market Size, By Application, 2015�2022 (USD Billion)
Table 142 UAE: By Market Size, By Application, 2015�2022 (Billion Units)
Table 143 South Africa: Food Service Packaging Market Size, By Material, 2015�2022 (USD Billion)
Table 144 South Africa: By Market Size, By Material, 2015�2022 (Billion Units)
Table 145 South Africa: By Market Size, By Packaging Type, 2015�2022 (USD Billion)
Table 146 South Africa: By Market Size, By Packaging Type, 2015�2022 (Billion Units)
Table 147 South Africa: By Market Size, By Application, 2015�2022 (USD Billion)
Table 148 South Africa: By Market Size, By Application, 2015�2022 (Billion Units)
Table 149 Rest of Middle East & Africa: Food Service Packaging Market Size, By Material, 2015�2022 (USD Billion)
Table 150 Rest of Middle East & Africa: By Market Size, By Material, 2015�2022 (Billion Units)
Table 151 Rest of Middle East & Africa: By Market Size, By Packaging Type, 2015�2022 (USD Billion)
Table 152 Rest of Middle East & Africa: By Market Size, By Packaging Type, 2015�2022 (Billion Units)
Table 153 Rest of Middle East & Africa: By Market Size, By Application, 2015�2022 (USD Billion)
Table 154 Rest of Middle East & Africa: By Market Size, By Application, 2015�2022 (Billion Units)
Table 155 South America: Food Service Packaging Market Size, By Country, 2015�2022 (USD Billion)
Table 156 South America: By Market Size, By Country, 2015�2022 (Billion Units)
Table 157 South America: By Market Size, By Material, 2015�2022 (USD Billion)
Table 158 South America: By Market Size, By Material, 2015�2022 (Billion Units)
Table 159 South America: By Market Size, By Packaging Type, 2015�2022 (USD Billion)
Table 160 South America: By Market Size, By Packaging Type, 2015�2022 (Billion Units)
Table 161 South America: By Market Size, By Application, 2015�2022 (USD Billion)
Table 162 South America: By Market Size, By Application, 2015�2022 (Billion Units)
Table 163 Brazil: Food Service Packaging Market Size, By Material, 2015�2022 (USD Billion)
Table 164 Brazil: By Market Size, Material, 2015�2022 (Billion Units)
Table 165 Brazil: By Market Size, By Packaging Type, 2015�2022 (USD Billion)
Table 166 Brazil: By Market Size, By Packaging Type, 2015�2022 (Billion Units)
Table 167 Argentina: Food Service Packaging Market Size, By Application, 2015�2022 (USD Billion)
Table 168 Brazil: By Market Size, By Application, 2015�2022 (Billion Units)
Table 169 Argentina: Food Service Packaging Market Size, By Material, 2015�2022 (USD Billion)
Table 170 Argentina: By Market Size, By Material, 2015�2022 (Billion Units)
Table 171 Argentina: By Market Size, By Packaging Type, 2015�2022 (USD Billion)
Table 172 Argentina: By Market Size, By Packaging Type, 2015�2022 (Billion Units)
Table 173 Argentina: By Market Size, By Application, 2015�2022 (USD Billion)
Table 174 Argentina: By Market Size, By Application, 2015�2022 (Billion Units)
Table 175 Rest of South America: Food Service Packaging Market Size, By Material, 2015�2022 (USD Billion)
Table 176 Rest of South America: By Market Size, By Material, 2015�2022 (Billion Units)
Table 177 Rest of South America: By Market Size, By Packaging Type, 2015�2022 (USD Billion)
Table 178 Rest of South America: By Market Size, By Packaging Type, 2015�2022 (Billion Units)
Table 179 Rest of South America: By Market Size, By Application, 2015�2022 (USD Billion)
Table 180 Rest of South America : By Market Size, By Application, 2015-2022 (USD Million)
List of Figures (38 Figures)
Figure 1 Food Service Packaging Market Segmentation
Figure 2 Food Service Packaging Market, By Region
Figure 3 Food Service Packaging Market: Research Design
Figure 4 Market Size Estimation Methodology: Bottom-Up Approach
Figure 5 Market Size Estimation Methodology: Top-Down Approach
Figure 6 Food Service Packaging: Data Triangulation
Figure 7 Plastic is Projected to Remain the Largest Material Segment Through 2022
Figure 8 Flexible Packaging Segment Projected to Account for the Largest Share Through 2022
Figure 9 Non-Alcoholic Beverages Segment Expected to Lead the Market for Food Service Packaging Through 2022
Figure 10 Asia-Pacific Was the Largest Market for Food Service Packaging in 2016
Figure 11 Emerging Economies Offer Attractive Opportunities in the Food Service Packaging Market
Figure 12 Plastic Segment to Lead the Market Through 2022
Figure 13 Flexible Packaging Segment to Grow at the Highest Rate During the Forecast Period
Figure 14 Non-Alcoholic Beverages Segment to Grow at the Highest Rate During the Forecast Period
Figure 15 Flexible Packaging Segment Captured the Largest Share in the North American Market in 2016
Figure 16 Market in India is Projected to Grow at the Highest Rate From 2017 to 2022
Figure 17 Evolution of Food Service Packaging
Figure 18 Rising Demand From End-Use Industries is the Key Driver for the Food Service Packaging Market
Figure 19 Food Service Industry in the U.S. From 2012 to 2016
Figure 20 Production By American Meat Companies, 2013
Figure 21 Plastic Segment is Projected to Grow at the Highest Rate From 2017 to 2022
Figure 22 Flexible Segment is Projected to Grow at the Highest Rate From 2017 to 2022
Figure 23 Non-Alcoholic Beverages Segment is Projected to Grow at the Highest Rate From 2017 to 2022
Figure 24 Geographic Snapshot: Market in India is Projected to Grow at the Highest Rate, in Terms of Value (2017�2022)
Figure 25 North American Food Service Packaging Market Snapshot: U.S. is Projected to Be the Fastest-Growing Market Between 2017 and 2022
Figure 26 Asia-Pacific: Food Service Packaging Market Snapshot
Figure 27 Dive Chart
Figure 28 Amcor Limited: Company Snapshot
Figure 29 Bemis Company, Inc.: Company Snapshot
Figure 30 The DOW Chemical Company: Company Snapshot
Figure 31 Westrock Company: Company Snapshot
Figure 32 Ball Corporation: Company Snapshot
Figure 33 Huhtamaki OYJ: Company Snapshot
Figure 34 Sealed Air Corporation: Company Snapshot
Figure 35 Berry Plastic Corporation: Company Snapshot
Figure 36 Reynolds Group Holding: Company Snapshot
Figure 37 International Paper Company: Company Snapshot
Figure 38 DS Smith PLC: Company Snapshot


Growth opportunities and latent adjacency in Food Service Packaging Market