Force Sensor Market by Application, Technology (Piezoelectric Force Sensor, Strain Gauge, Load Cell, Capacitive Force Sensor, and Magnetoelastic Force Sensor), Operation, Force Type, and Geography � Global Forecast to 2035


The global force sensor market was valued at USD 2.30 billion in 2024 and is estimated to reach USD 3.93 billion by 2035, at a CAGR of 5.0% between 2025 and 2035.
The force sensor market is driven by growing demand in industrial automation, automotive, healthcare, and consumer electronics sectors. Key factors include integration into robotics, electric vehicles, and medical devices, supporting precision monitoring and control. The shift to Industry 4.0/5.0 with smart manufacturing and IoT adoption is accelerating sensor deployment. Recent trends highlight advancements in AI-driven sensors, miniaturization, and self-calibrating technologies. The Asia-Pacific region, especially India and China, is seeing significant growth due to expanding automotive production and industrial investments. The rising use in automotive safety systems, advanced driver assistance systems (ADAS), and electric vehicle development also fuels market growth.

Force sensors are devices that detect and measure the amount of force applied to an object by converting this mechanical force into an electrical signal. They operate using several technologies like strain gauges, piezoelectric effects, capacitive sensing, and more. Strain gauges, for instance, detect force by sensing changes in resistance when the sensor material deforms. Piezoelectric sensors generate an electric charge under mechanical stress. Capacitive force sensors detect changes in capacitance due to mechanical displacement.
Market by Application
Manufacturing
The manufacturing industry holds a major share in the force sensor market because force sensors ensure precision and quality control in production processes. They help monitor and control force applied during assembly, welding, pressing, and other manufacturing steps to maintain consistent product quality and reduce defects. These sensors are integral in automation and robotic systems, enabling accurate force feedback and control that boost efficiency and safety. Additionally, force sensors assist in predictive maintenance by detecting equipment issues early, minimizing downtime. Their durability and precision make them indispensable for demanding industrial environments, driving their extensive adoption in manufacturing.
Energy & Power
The energy and power application plays an important role in the force sensor market because force sensors are essential for monitoring and controlling mechanical forces in power generation and distribution equipment. They ensure the safety and reliability of critical infrastructure like hydraulic power plants by measuring water and oil pressure. Force sensors also help optimize the performance of renewable energy systems and electric vehicle components, such as regenerative braking systems, which improve energy efficiency. Additionally, they are used in equipment monitoring, predictive maintenance, and safety alarms in manufacturing plants that produce energy machinery. This demand for precise, real-time force measurement drives force sensor adoption in the energy and power sector.
Pharmaceutical
The pharmaceutical application plays a considerable role in the force sensor market because force sensors are crucial in various pharmaceutical manufacturing processes, such as tablet pressing, mixing, and compaction. They ensure precise monitoring and control of forces in equipment like tablet presses, mixers, and roller compactors, which improves product quality and compliance with regulatory standards. Custom force sensors tailored for medical applications further drive their adoption in this industry, making them indispensable in pharmaceutical production and healthcare.
Market by Technology
Piezoelectric
Piezoelectric technology is among the major technologies in the force sensor market due to its high sensitivity, durability, and broad frequency response. These sensors convert mechanical force into electrical signals with excellent precision, making them ideal for applications such as vibration monitoring, shock detection, and structural health diagnostics across automotive, aerospace, industrial automation, and healthcare sectors. The technology supports miniaturization and wireless connectivity, essential for IoT and real-time condition monitoring. Additionally, rising adoption in medical devices, wearable health monitors, and electric vehicles further drives demand. The market for piezoelectric force sensors is growing robustly, with a projected CAGR of around 6.9% from 2025 to 2035, reflecting their critical role in advanced sensing applications.
Load Cell
Load cell technology plays a pivotal role in the force sensor market due to its high accuracy, reliability, and versatility in measuring force and weight across various industries. Load cells convert mechanical force into electrical signals, making them essential in industrial automation, manufacturing, logistics, and healthcare for precise force measurement. Their widespread use in weighing systems, material testing, automotive safety, and medical devices drives strong demand. The expansion of IoT, Industry 4.0, and automation further fuels load cell adoption for real-time data and process optimization. The global load cell market is projected to grow steadily with a CAGR around 4-7.5% through 2033, reflecting its dominant market position and critical role...
Market by Geography:
Geographically, the force sensor market is experiencing widespread adoption across North America, Europe, Asia Pacific, and the Middle East & Africa. The Asia-Pacific region is the major growth driver and holds the largest share in the global force sensor market. This growth is fueled by rapid industrial automation, automotive production (especially electric vehicles), and consumer electronics manufacturing in countries like China, India, and Japan. North America follows, driven by advanced manufacturing infrastructure and early tech adoption in the US and Canada. Europe holds a significant share, supported by strong automotive and industrial sectors in Germany, France, and the UK. The Rest of the World has smaller but growing demand in emerging markets and energy sectors
Market Dynamics
Driver: Rising demand for industrial robots
The rising demand for industrial robots is a key driver of the force sensor market. Industrial robots require precise force sensors for accurate force control, feedback, and safety in tasks such as assembly, welding, material handling, and quality inspection. Advanced force sensors enable robots to perform delicate and complex operations with high precision, improving manufacturing efficiency and product quality. The growth of Industry 4.0, automation, and IoT integration amplifies the need for sensor-equipped robots in automotive, electronics, pharmaceuticals, and logistics sectors. The industrial robot sensor market is expected to grow at a CAGR of about 10.5% through 2030, reflecting robust adoption of force sensors in robotics for smart manufacturing.
Restraint: Manufacturing complexities involved using load cell technology
Load cell technology faces complexity challenges that act as restraints in the force sensor market. Proper mechanical mounting is critical since incorrect installation can cause friction, offset, hysteresis, or inaccurate readings. Overloading beyond rated capacity may cause permanent deformation, leading to lost accuracy or sensor failure. Environmental factors like moisture, temperature fluctuations, electrical noise, and corrosion can degrade load cell performance and longevity. Additionally, wiring issues and the need for regular calibration and maintenance add to complexity. These technical and operational intricacies increase costs and limit ease of use, restraining wider adoption despite load cells’ accuracy and reliability.
Opportunity: Growing popularity of piezoelectric devices for power generation
The growing popularity of piezoelectric devices for power generation presents a significant opportunity in the force sensor market. Piezoelectric materials convert mechanical stress into electrical energy, enabling compact, maintenance-free, and highly durable energy harvesting systems. These devices power low-consumption electronics, wireless sensors, and embedded MEMS devices, ideal for applications where batteries are unavailable. Advances in multilayer piezo generators enhance current output while maintaining high stability. Additionally, piezoelectric power generation is seen as a green, pollution-free technology suitable for integration into urban infrastructure like pavements and buildings for distributed energy generation. This expanding use in self-powered systems and energy harvesting drives market growth and innovation in force sensors.
Challenge: Stringent regulatory barriers
Stringent regulatory barriers present a challenge to the force sensor market by increasing compliance costs and complicating market entry, especially in highly regulated regions like the EU and North America. Regulations such as the EU’s Machinery Directive and strict safety and quality standards impose additional testing, certification, and documentation requirements. These increase time-to-market and production expenses for manufacturers, particularly affecting smaller and emerging companies. High compliance costs also limit price competitiveness in sensitive markets and constrain innovation speed. Such regulatory hurdles slow down deployment in price-conscious sectors and regions, thereby restraining overall market growth despite rising demand for force sensors.
Future Outlook
The force sensor market is projected to grow significantly from 2025 to 2035 driven by rising adoption in industrial automation, automotive sensors, healthcare devices, and consumer electronics. Technological advancements in piezoelectric, strain gauge, and capacitive sensors, along with IoT integration and Industry 4.0/5.0 trends, will drive innovation and demand. The Asia-Pacific region, led by China and India, will continue to lead growth, while North America and Europe remain significant markets supported by technological innovation and regulatory frameworks. Challenges like regulatory compliance and integration complexity remain but are balanced by increasing applications in electric vehicles, robotics, and smart manufacturing.
Key Market Players
Key Force Sensor companies Honeywell International Inc (US), TE Connectivity (Switzerland), Mettler Toledo (US), Vishay Precision Group, Inc. (US) Baumer (Switzerland), Kistler Group (Switzerland), among others.
Key Questions addressed in this report:
- What are the global trends in demand for the market?
- What are the upcoming technologies/product areas that will have a significant impact on the market in the future?
- What will be the revenue pockets for the market players in the next 10 years?
- What are the prime strategies followed by key players in the market?
 Exclusive indicates content/data unique to MarketsandMarkets and not available with any competitors.
Table of Contents
1 Introduction (Page No. - 17)
1.1 Study Objectives
1.2 Market Definition and Scope
1.3 Study Scope
1.3.1 Markets Covered
1.3.2 Years Considered
1.4 Currency
1.5 Inclusions and Exclusions
1.6 Stakeholders
2 Research Methodology (Page No. - 20)
2.1 Research Data
2.1.1 Secondary and Primary Research
2.1.1.1 Key Industry Insights
2.1.2 Secondary Data
2.1.2.1 List of Major Secondary Sources
2.1.2.2 Secondary Sources
2.1.3 Primary Data
2.1.3.1 Primary Interviews With Experts
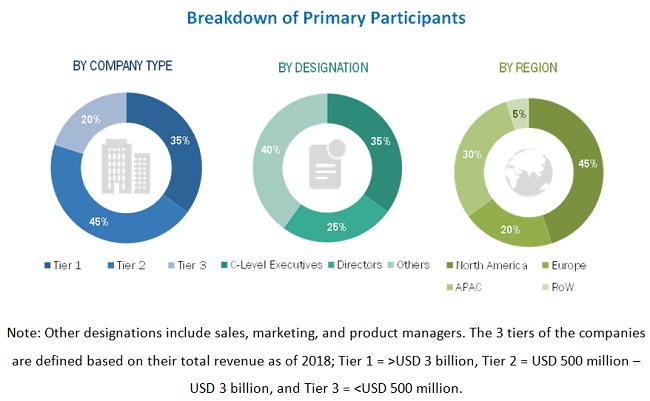
2.1.3.2 Breakdown of Primaries
2.1.3.3 Primary Sources
2.2 Market Size Estimation
2.2.1 Bottom-Up Approach
2.2.1.1 Approach for Bottom-Up Analysis (Demand Side)
2.2.2 Top-Down Approach
2.2.2.1 Approach for Top-Down Analysis (Supply Side)
2.3 Market Breakdown and Data Triangulation
2.4 Research Assumptions
3 Executive Summary (Page No. - 29)
4 Premium Insights (Page No. - 34)
4.1 Attractive Opportunities in Force Sensor Market
4.2 Force Sensor Market in Europe, By Country and Application
4.3 Market, By Application
4.4 Market, By Operation
4.5 Force Sensor Market, By Force Type
4.6 Market, By Technology
4.7 Market, By Country
5 Market Overview (Page No. - 38)
5.1 Introduction
5.2 Market Dynamics
5.2.1 Drivers
5.2.1.1 Rising Demand for Industrial Robots
5.2.1.2 Growing Developments in Iiot
5.2.1.3 Growing Safety Features in Automobiles
5.2.2 Restraints
5.2.2.1 Complex Manufacturing Process of Load Cell
5.2.2.2 Price Competitive Market
5.2.3 Opportunities
5.2.3.1 Increased Adoption of Force Sensors in Consumer Goods and Wearables
5.2.3.2 Growing Popularity of Piezoelectric Devices for Power Generation
5.2.4 Challenges
5.2.4.1 High Regulatory Barriers
6 Force Sensor Market, By Application (Page No. - 44)
6.1 Introduction
6.2 Manufacturing
6.2.1 Automobile Component Manufacturers Striving to Bring Innovation in Industry With Optimum Production Plan of Manufacturing Highest Quality Automobiles and Spare Parts
6.3 Energy & Power
6.3.1 Piezoelectric Force Sensors That are Capable of Detecting Both Compressive and Tension Force are Popular in Energy & Power Applications
6.4 Pharmacuticals
6.4.1 Honeywell (US) is A Dominant Company in Pharmaceuticals Market
6.5 Chemicals
6.5.1 Moisture-Proof and Chemical-Resistant Strain Gauges are Used for Monitoring Applications
6.6 Oil & Gas
6.6.1 Load Monitoring System Used in Oil & Gas Industry Provides Accurate Measurements of Load and Can Be Customized to Meet Client Requirements
6.7 Mining
6.7.1 Safety is of Utmost Importance in Mining Companies
6.8 Others
7 Force Sensor Market, By Operation (Page No. - 68)
7.1 Introduction
7.2 Analog
7.2.1 Analog Load Cells Use Strain Gauge to Measure Strain Or Compression
7.3 Digital
7.3.1 Digital Load Cell Uses Surface Acoustic Wave to Measure Load
8 Force Sensor Market, By Force Type (Page No. - 73)
8.1 Introduction
8.2 Compression
8.2.1 Applications of Compression-Based Force Sensors are Based on Force Type
8.3 Tension
8.3.1 Materials Research, Tensile Testing, and Rope and Wire Tension Measurement, Among Others, are Major Applications of Tension-Based Force Sensors
8.4 Compression and Tension
8.4.1 Kistler A Dominant Vendor in Piezoelectric Force Sensor Market
9 Force Sensor Market, By Technology (Page No. - 78)
9.1 Introduction
9.2 Piezoelectric Force Sensor
9.2.1 Acquired Data Can Be Converted to Electrical Charge By Piezoelectric Sensors
9.3 Strain Gauge
9.3.1 Strain Gauge is Capable of Detecting Force, Pressure, Tension, and Weight
9.4 Load Cell
9.4.1 Load Cell Generates Electrical Signals on Applying Force
9.5 Capacitive Force Sensor
9.5.1 Capacitive Sensors are Capable of High-Resolution Measurement of Position Or Change in Position of Any Conductive Target
9.6 Magnetoelastic Force Sensor
9.6.1 Magnetoelastic Force Sensor Commercially Viable Options Than Strain Gauge
9.7 Others
10 Geographic Analysis (Page No. - 90)
10.1 Introduction
10.2 North America
10.2.1 US
10.2.1.1 North American Manufacturing Sector Dependent on Dominant US Economy
10.2.2 Canada
10.2.2.1 Canada Dominated By Small and Medium-Sized Enterprises
10.2.3 Mexico
10.2.3.1 Significant Increase in Automation in Mexico
10.3 Europe
10.3.1 UK
10.3.1.1 UK Homes Largest Number of Load Monitoring Companies
10.3.2 France
10.3.2.1 Growth of Industrial Manufacturing in France Aided By Higher Margins, Improved Economic Outlook, and Better Financing Conditions
10.3.3 Germany
10.3.3.1 Vehicle Manufacturers in Germany have Higher Demand for Load Monitoring Systems
10.3.4 Rest of Europe
10.3.4.1 Presence of Highly Advanced Technologies and Rising Number of Manufacturing Facilities Support Adoption of Force Sensors
10.4 APAC
10.4.1 China
10.4.1.1 Rapid Industrial Manufacturing Growth in China Driven By Increasing Demand for Consumer Products
10.4.2 Japan
10.4.2.1 Automotive Industry of Japan Among Prominent Industries Across the World
10.4.3 Rest of APAC
10.4.3.1 Increasing Demand for Load Monitoring Systems Due to Rapid Industrialization and Urbanization
10.5 RoW
10.5.1 South America
10.5.1.1 Government Support for Industrial Development in South America to Increase Foreign Investments
10.5.2 Middle East
10.5.2.1 Increasing Demand for Force Sensors in Oil & Gas Industry for Worker’s Safety and Smooth Operations
10.5.3 Africa
10.5.3.1 Agriculture and Automotive Market in Africa Gaining Pace and Driving Need for Advanced Manufacturing and Processing Facilities
11 Competitive Landscape (Page No. - 109)
11.1 Introduction
11.2 Ranking Analysis of Players in Force Sensor Market
11.3 Competitive Leadership Mapping
11.3.1 Visionary Leaders
11.3.2 Dynamic Differentiators
11.3.3 Innovators
11.3.4 Emerging Companies
11.4 Strength of Product Portfolio (26 Companies)
11.5 Business Strategy Excellence (26 Companies)
11.6 Competitive Scenario
11.6.1 Product Launches and Developments
11.6.2 Mergers
11.6.3 Partnerships, Collaborations, Alliances, and Joint Ventures
12 Company Profiles (Page No. - 119)
(Business Overview, Products Offered, Recent Developments, SWOT Analysis, MnM View)*
12.1 Key Players
12.1.1 Mettler Toledo
12.1.2 Spectris
12.1.3 Flintec
12.1.4 Vishay Precision Group
12.1.5 Honeywell
12.1.6 Gefran
12.1.7 Siemens
12.1.8 Te Connectivity
12.1.9 Sensata Technologies
12.1.10 Kistler
12.1.11 Bcm Sensor Technologies
12.1.12 Baumer Group
12.1.13 Tekscan
12.1.14 Lorrenz Messtechnik GmbH
12.1.15 Futek Advanced Sensor Technology
12.2 Other Players
12.2.1 Taiwan Alpha Electronic.
12.2.2 Texas Instruments
12.2.3 Abb
12.2.4 Uneo
12.2.5 Priamus System Technologies
*Details on Business Overview, Products Offered, Recent Developments, SWOT Analysis, MnM View Might Not Be Captured in Case of Unlisted Companies.
13 Appendix (Page No. - 149)
13.1 Discussion Guide
13.2 Knowledge Store: Marketsandmarkets’ Subscription Portal
13.3 Available Customizations
13.4 Related Reports
13.5 Author Details
List of Tables (103 Tables)
Table 1 Force Sensor Market, By Technology, 2016–2024 (Million Units)
Table 2 Market, By Application, 2016–2024 (USD Million)
Table 3 Market for Manufacturing, By Force Type, 2016–2024 (USD Million)
Table 4 Market for Manufacturing, By Operation, 2016–2024 (USD Million)
Table 5 Market for Manufacturing, By Technology, 2016–2024 (USD Million)
Table 6 Market for Manufacturing, By Region, 2016–2024 (USD Million)
Table 7 Market for Manufacturing in North America, By Country, 2016–2024 (USD Million)
Table 8 Market for Manufacturing in Europe, By Country, 2016–2024 (USD Million)
Table 9 Market for Manufacturing in APAC, By Country, 2016–2024 (USD Million)
Table 10 Market for Energy & Power, By Force Type, 2016–2024 (USD Million)
Table 11 Force Sensors Market for Energy & Power, By Operation, 2016–2024 (USD Million)
Table 12 Market for Energy & Power Applications, By Technology, 2016–2024 (USD Million)
Table 13 Market for Energy & Power, By Region, 2016–2024 (USD Million)
Table 14 Market for Energy & Power in North America, By Country, 2016–2024 (USD Million)
Table 15 Market for Energy & Power in Europe, By Country, 2016–2024 (USD Million)
Table 16 Market for Energy & Power in APAC, By Country, 2016–2024 (USD Million)
Table 17 Market for Pharamaceuticals, By Force Type, 2016–2024 (USD Million)
Table 18 Market for Pharmaceuticals, By Operation, 2016–2024 (USD Million)
Table 19 Market for Pharmaceuticals, By Technology, 2016–2024 (USD Million)
Table 20 Market for Pharmaceuticals, By Region, 2016–2024 (USD Million)
Table 21 Market for Pharmaceuticals in North America, By Country, 2016–2024 (USD Million)
Table 22 Force Sensor Market for Pharmaceuticals in Europe, By Country, 2016–2024 (USD Million)
Table 23 Market for Pharmaceuticals in APAC, By Country, 2016–2024 (USD Million)
Table 24 Market for Chemicals, By Force Type, 2016–2024 (USD Million)
Table 25 Market for Chemicals, By Operation, 2016–2024 (USD Million)
Table 26 Market for Chemicals, By Technology, 2016–2024 (USD Million)
Table 27 Market for Chemicals, By Region, 2016–2024 (USD Million)
Table 28 Market for Chemicals in North America, By Country, 2016–2024 (USD Million)
Table 29 Market for Chemicals in Europe, By Country, 2016–2024 (USD Million)
Table 30 Market for Chemicals in APAC, By Country, 2016–2024 (USD Million)
Table 31 Market for Oil & Gas, By Force Type, 2016–2024 (USD Million)
Table 32 Market for Oil & Gas, By Operation, 2016–2024 (USD Million)
Table 33 Market for Oil & Gas, By Technology, 2016–2024 (USD Million)
Table 34 Market for Oil & Gas, By Region, 2016–2024 (USD Million)
Table 35 Market for Oil & Gas in North America, By Country, 2016–2024 (USD Million)
Table 36 Market for Oil & Gas in Europe, By Country, 2016–2024 (USD Million)
Table 37 Market for Oil & Gas in APAC, By Country, 2016–2024 (USD Million)
Table 38 Market for Mining, By Force Type, 2016–2024 (USD Million)
Table 39 Market for Mining, By Operation, 2016–2024 (USD Million)
Table 40 Market for Mining, By Technology, 2016–2024 (USD Thousand)
Table 41 Market for Mining, By Region, 2016–2024 (USD Million)
Table 42 Market for Mining in North America, By Country, 2016–2024 (USD Thousand)
Table 43 Market for Mining in Europe, By Country, 2016–2024 (USD Thousand)
Table 44 Market for Mining in APAC, By Country, 2016–2024 (USD Million)
Table 45 Market for Other Applications, By Operation, 2016–2024 (USD Million)
Table 46 Market for Other Applications, By Technology, 2016–2024 (USD Million)
Table 47 Market for Other Application, By Region, 2016–2024 (USD Million)
Table 48 Market for Other Applications in North America, By Country, 2016–2024 (USD Million)
Table 49 Market for Other Applications in Europe, By Country, 2016–2024 (USD Million)
Table 50 Market for Other Applications in APAC, By Country, 2016–2024 (USD Million)
Table 51 Market, By Operation, 2016–2024 (USD Million)
Table 52 Analog Market, By Application, 2016–2024 (USD Million)
Table 53 Analog Force Sensor Market, By Technology, 2016–2024 (USD Million)
Table 54 Digital Market, By Application, 2016–2024 (USD Million)
Table 55 Digital Market, By Technology, 2016–2024 (USD Million)
Table 56 Market, By Force Type, 2016–2024 (USD Million)
Table 57 Compresssion-Based Force Sensor Market, By Technology, 2016–2024 (USD Million)
Table 58 Tension-Based Market, By Technology, 2016–2024 (USD Million)
Table 59 Compression & Tension-Based Market, By Technology, 2016–2024 (USD Million)
Table 60 Market, By Technology, 2016–2024 (USD Million)
Table 61 Piezoelectric Market, in Terms of Value, Volume, & Asp, 2016–2024
Table 62 Piezoelectric Force Sensor Market, By Application, 2016–2024 (USD Million)
Table 63 Piezoelectric Market, By Operation, 2016–2024 (USD Million)
Table 64 Piezoelectric Market, By Force Type, 2016–2024 (USD Million)
Table 65 Strain Gauge Market, in Terms of Value, Volume, & Asp, 2016–2024
Table 66 Strain Gauge Market, By Application, 2016–2024 (USD Million)
Table 67 Strain Gauge Market, By Operation, 2016–2024 (USD Million)
Table 68 Strain Gauge Market, By Force Type, 2016–2024 (USD Million)
Table 69 Load Cell Market, in Terms of Value, Volume, & Asp, 2016–2024
Table 70 Load Cell Market, By Application, 2016–2024 (USD Million)
Table 71 Load Cell Market, By Operation, 2016–2024 (USD Million)
Table 72 Load Cell Market, By Force Type, 2016–2024 (USD Million)
Table 73 Capacitive Force Sensor Market, in Terms of Value, Volume, & Asp, 2016–2024
Table 74 Capacitive Market, By Application, 2016–2024 (USD Million)
Table 75 Capacitive Market, By Operation, 2016–2024 (USD Million)
Table 76 Capacitive Market, By Force Type, 2016–2024 (USD Million)
Table 77 Magnetoelastic Market, By Application, 2016–2024 (USD Million)
Table 78 Magnetoelastic Market, By Operation, 2016–2024 (USD Million)
Table 79 Magnetoelastic Market, By Force Type, 2016–2024 (USD Million)
Table 80 Market for Other Force Sensors, By Application, 2016–2024 (USD Million)
Table 81 Market for Other Force Sensors, By Operation, 2016–2024 (USD Million)
Table 82 Market for Other Force Sensors, By Force Type, 2016–2024 (USD Million)
Table 83 Force Sensor Market, By Region, 2016–2024 (USD Million)
Table 84 Market in North America, By Application, 2016–2024 (USD Million)
Table 85 Market in North America, By Country, 2016–2024 (USD Million)
Table 86 Market in US, By Application, 2016–2024 (USD Million)
Table 87 Market in Canada, By Application, 2016–2024 (USD Million)
Table 88 Market in Mexico, By Application, 2016–2024 (USD Million)
Table 89 Market in Europe, By Application, 2016–2024 (USD Million)
Table 90 Market in Europe, By Country, 2016–2024 (USD Million)
Table 91 Market in UK, By Application, 2016–2024 (USD Million)
Table 92 Market in France, By Application, 2016–2024 (USD Million)
Table 93 Market in Germany, By Application, 2016–2024 (USD Million)
Table 94 Market in Rest of Europe, By Application, 2016–2024 (USD Million)
Table 95 Market in APAC, By Application, 2016–2024 (USD Million)
Table 96 Market in APAC, By Country, 2016–2024 (USD Million)
Table 97 Market in China, By Application, 2016–2024 (USD Million)
Table 98 Market in Japan, By Application, 2016–2024 (USD Million)
Table 99 Market in Rest of APAC, By Application, 2016–2024 (USD Million)
Table 100 Force Sensor Market in RoW, By Application, 2016–2024 (USD Million)
Table 101 Product Launch and Development, 2017–2019
Table 102 Merger, 2018
Table 103 Partnership, Collaboration, Alliance, and Joint Venture, 2017
List of Figures (42 Figures)
Figure 1 Force Sensor Market: Research Design
Figure 2 Market Size Estimation Methodology: Bottom-Up Approach
Figure 3 Market Size Estimation Methodology: Top-Down Approach
Figure 4 Data Triangulation
Figure 5 Global Force Sensor Market (USD Billion)
Figure 6 Manufacturing Held Largest Share of Market in 2018
Figure 7 Analog Force Sensor Held Larger Market Share in 2018
Figure 8 Compression & Tension Segment Accounted for Largest Market Share in 2018
Figure 9 Peizoelectric Force Sensor Held Largest Size of Market, By Technology, in 2018
Figure 10 Force Sensor Market, By Region, 2018
Figure 11 Growing Need for Developments in IIoT Will Drive Market Growth
Figure 12 Germany and Manufacturing Application Held Largest Share of European Market in 2018
Figure 13 Manufacturing Application to Dominate Market During 2019–2024
Figure 14 Force Sensors By Analog Operation to Hold Largest Size of Market During 2019–2024
Figure 15 Compression & Tension Force-Based Force Sensor to Capture Largest Share of Market By 2024
Figure 16 Piezoelectric Force Sensor to Hold Largest Size of Market, By Technology, in 2018
Figure 17 US Accounted for Largest Share of Market in North America in 2018
Figure 18 Rising Demand for Industrial Robots Will Drive Adoption of Force Sensors
Figure 19 Impact Analysis
Figure 20 Manufacturing Application to Dominate Market From 2019 to 2024
Figure 21 Analog Force Sensors to Hold Larger Market Size During Forecast Period
Figure 22 Compresssion and Tension Force-Based Sensor to Hold Largest Size of Market During Forecast Period
Figure 23 Piezoelectric Force Sensor to Hold Largest Size of Force Sensor Market During Forecast Period
Figure 24 Geographic Snapshot of Market (2019–2024)
Figure 25 North America to Hold Largest Size of Market By 2024
Figure 26 North America: Snapshot of Market
Figure 27 Europe: Snapshot of Market
Figure 28 APAC: Snapshot of Market
Figure 29 RoW: Snapshot of Market
Figure 30 Major Players in Market Adopted Product Launches as Key Growth Strategy From 2016 to 2018
Figure 31 Top 5 Companies in Force Sensor Market
Figure 32 Market (Global) Competitive Leadership Mapping, 2018
Figure 33 Market Evolution Framework: Product Launch, Followed By Merger, Fuelled Market Growth (2017–2019)
Figure 34 Mettler Toledo: Company Snapshot
Figure 35 Spectris: Company Snapshot
Figure 36 Indutrade: Company Snapshot
Figure 37 Vishay Precision Group: Company Snapshot
Figure 38 Honeywell : Company Snapshot
Figure 39 Gefran: Company Snapshot
Figure 40 Siemens: Company Snapshot
Figure 41 TE Connectivity: Company Snapshot
Figure 42 Sensata Technologies: Company Snapshot
The study involved 4 major activities in estimating the current size of the force sensor market. Exhaustive secondary research has been done to collect information about the market, the peer markets, and the parent market. Validating findings, assumptions, and sizing with industry experts across the value chain through primary research has been the next step. Both top-down and bottom-up approaches have been employed to estimate the complete market size. After that, market breakdown and data triangulation methods have been used to estimate the market size of segments and subsegments.
Secondary Research
In the secondary research process, various secondary sources have been referred to for identifying and collecting information pertinent to this study. Secondary sources include annual reports; press releases; investor presentations; white papers; journals and certified publications; and articles from recognized authors, directories, and databases. Secondary research has been conducted to obtain important information about the industry’s supply chain, value chain, total pool of key players, market segmentation according to the industry trends (to the bottommost level), geographic markets, and key developments from both market- and technology-oriented perspectives.
Primary Research
Extensive primary research has been conducted after gaining knowledge about the force sensor market scenario through secondary research. Several primary interviews have been conducted with market experts from both demand (commercial application providers) and supply (equipment manufacturers and distributors) sides across four major regions: North America, Europe, APAC, and RoW. Approximately 20% and 80% of primary interviews have been conducted with parties from demand and supply sides, respectively. The primary data has been collected through questionnaires, emails, and telephonic interviews.
To know about the assumptions considered for the study, download the pdf brochure
Market Size Estimation
In the complete engineering process, both top-down and bottom-up approaches, along with several data triangulation methods, have been used to estimate and validate the size of the force sensor market and other dependent submarkets. The key players in the market have been determined through primary and secondary research. This entire research methodology involves the study of the annual and financial reports of the top market players and extensive interviews with industry experts such as CEOs, VPs, directors, and marketing executives for key insights (both qualitative and quantitative) into the force sensor market.
Data Triangulation
All the percentage shares, splits, and breakdowns have been determined using secondary sources and verified through primary sources. All the possible parameters that affect the markets covered in this research study have been accounted for, viewed in extensive detail, verified through primary research, and analyzed to get the final quantitative and qualitative data. This data has been consolidated and supplemented with detailed inputs and analysis from MarketsandMarkets and presented in the report.
Report Objectives
- To describe and forecast the force sensor market, in terms of value and volume, by force type, operation, application, and technology
- To describe and forecast the market, in terms of value, by region—North America, Europe, Asia Pacific (APAC), and Rest of the World (RoW)
- To provide detailed information regarding major factors influencing growth (drivers, restraints, opportunities, and challenges)
- To strategically analyze micromarkets with respect to individual growth trends, future prospects, and contributions to the overall market
- To provide detailed overview of value chain analysis in the force sensor market
- To analyze opportunities in the market for various stakeholders by identifying high-growth segments of the force sensor market
- To strategically profile key players and comprehensively analyze their market position in terms of ranking and core competencies, along with detailing the competitive landscape for market leaders
- To analyze competitive developments such as product developments, expansions, mergers and research & development in the market
Available Customizations
With the given market data, MarketsandMarkets offers customizations according to the company’s specific needs. The following customization options are available for the report:
Product Analysis
- Product matrix that gives a detailed comparison of the product portfolio of each company
Company Information
- Detailed analysis and profiling of additional market players (up to 5)


Growth opportunities and latent adjacency in Force Sensor Market