Gelatin Market

Gelatin Market Size, Share, Industry Growth, Trends Report by Source (Plants, Animals), Application (Food & Beverages, Pharmaceuticals, Health & Nutrition, Cosmetics & Personal Care), Type (Type A, Type B), Function (Thickener, Stabilizer, Gelling Agent) and Region - Global Forecast to 2028

Report Code: FB 6909 Mar, 2023, by marketsandmarkets.com

Gelatin Market Size, Share & Growth Report, 2028

The global gelatin market size was valued at USD 3.7 billion in 2023 and is expected to grow at a CAGR of 6.6% from 2023 to 2028.

Owing to the rapid growth in the aging population across the world, the demand for medicines is expected to increase primarily due to the resulting growth in the incidents of chronic disorders. For instance, according to the American Heart Association, in 2019, in the US, 18.5% of children and 39.6% of adults were obese, while 7.7% of adults and 5.6% of children had severe obesity. Obesity was associated with a shorter lifetime and a higher percentage of cardiovascular disease-related deaths. About 45.1% of the US population could be affected by some form of CVD by 2035.

According to the International Diabetes Federation (IDF), in 2021, nearly 537 million people are suffering from diabetes globally, which is projected to reach 643 million by 2030 and 783 million by 2045. The increase in the aging population will drive the prevalence of CVD and other chronic diseases over the next few years. This, in turn, will increase the consumption of gelatin products used to treat such diseases. Gelatin is a rich source of amino acids such as glycine; it accounts for 27% of gelatin’s composition that is used to improve digestive, joint, cardiovascular, cognitive, and skin health.

Gelatin Market

To know about the assumptions considered for the study, Request for Free Sample Report

Gelatin Market Dynamics

Growing demand for functional and convenience food and beverages

There is an increasing demand for convenience food and beverages due to changing lifestyles, an increasing working population, and consumers lack the time and effort required to prepare home-cooked food and are more inclined toward convenience food products, which, in general, are highly processed and lack essential nutrients. To counter these concerns, consumers increasingly prefer functional and fortified food & beverage products. Functional foods act as the perfect means for supplying essential micronutrients to the human body. With the growing consumer awareness of food fortification and the rising demand for fortified food products, the demand for gelatin is growing at a higher rate. Gelatin is majorly used in almost all food products as a functional ingredient.

Demand for confectionery products such as candies, chocolate bars, chewing gums, and jellies is also rising. The demand for confectionery food is driven due to the rise in income levels, economic growth, and demand for convenience foods. According to the USDA, in 2022, the US will be the leading exporter of confectionery products. Canada, Mexico, and the European Union are the major exporting markets for confectionery products for the US.

The analysis further stated that in 2022, Canada accounted for 65% of the US confectionery product exports; Mexico accounted for 11%, and the European Union accounted for 5%. Canada heavily imports confectionery products from the US. The market for gummies and jellies is matured in developed regions such as North America and Europe, and therefore much scope is present in developing regions such as Asia Pacific and Latin America. Since gelatin has a major application in the confectionery industry, the growth of the industry is one of the major driving factors for the growth of the gelatin market.

Cultural restrictions

Gelatin has varied applications in the food, pharmaceutical, and nutraceutical industries. It is used as a functional ingredient in food, to manufacture hard and soft capsules, and as a protein supplement. However, gelatin is an animal by-product formed from the collagen of slaughtered animals, including the bones, hides, and hooves of cattle, pigs, fish, and poultry. Individuals with religious or dietary restrictions that forbid the consumption of animal products are not willing to consume those products that use gelatin.

For instance, pork and pork-derived products are strictly forbidden in Middle Eastern and Muslim communities. They instead prefer to consume halal-certified bovine-derived products. Therefore, the market for gelatin manufactured by pork skin is negligible in these regions. Similarly, In India, the consumption of cattle-derived products is culturally forbidden; the Hindu community does not generally consume beef and beef-derived products. Hence, in this country, pork-based gelatin is mostly consumed. Similarly, the Jewish population looks for kosher-certified products. Kosher guidelines also inhibit the consumption of pigs and pig-derived products. These cultural and regional outlooks can sometimes pose a restraint the gelatin market growth.

Emerging economies to provide high-growth opportunities.

Changing lifestyles, food habits, the adoption of western food habits, an increase in demand for functional ingredients in food products, and an increase in industrial activity leading to the need for process enhancement have contributed to the development of the market in developing economies. Emerging economies such as the Asia Pacific, South Africa, the Middle East, South America, and Eastern European countries provide excellent opportunities for the market growth.

For instance, in October 2022, PB Leiner extended the gelwoRx Dsolve pharmaceutical portfolio with three new products, including Dsolve B, Dsolve P, and Dsolve xTRA. Dsolve P (pig skin) and Dsolve B (beef hide) are specially developed to reduce cross-linking and fast dissolution of soft caps. Dsolve xTRA (bovine bone) promises to perform better than Dsolve, Dsolve P, and Dsolve B. in December 2020, Gelita AG acquired 65% of shares of SelJel, a Turkish gelatin producer. With this joint venture, Gelita AG is strengthening its position as the industry’s global leader. With this, Gelita's growth plan is to fulfill the rising demand for gelatin and, specifically, halal bovine gelatin. Increasing market share in this growth region is a crucial requirement not only in Islamic states but also in a significant portion of Asia.

Rising prices and scarcity of raw materials

Due to its applications across various industries, including food & beverage, pharmaceuticals, cosmetic & personal care, biomedical, and others, demand gelatin has witnessed significant growth. To meet this growing demand, a large amount of raw materials is required. The use of gelatin in food preparations has increased six-fold in the last decade. Similar trends have been observed in the nutraceutical and cosmetic industries, where gelatin is used for the production of dietary supplement capsules, lotions, shampoos, hair sprays, and creams.

According to the CEO of a pioneer gelatin manufacturing company- raw material costs constitute almost 50%–55% of the total cost in the gelatin market. Also, the gelatin industry in India consumes about 18,000 tons of crushed bones per month. However, the availability of crushed bones came down to 15,000 tons in the earlier months of 2019. The annual gelatin production is expected to come down further due to the non-availability of bones, owing to the ban imposed by the government on the slaughter of cattle in India. Furthermore, the outbreak of bovine and swine diseases has resulted in regulatory restrictions and guidelines on bovine and pig farmers, which has increased the cost of farming. Feed prices have also increased. The cumulative effect of these factors and the subsequent price hikes have been passed onto end users such as gelatin manufacturers, increasing the overall gelatin prices.

Gelatin Market Ecosystem

Prominent companies in this market include well-established, financially stable manufacturers of gelatin. These companies have been operating in the market for several years and possess a diversified product portfolio, state-of-the-art technologies, and strong global sales and marketing networks. Key companies in this market include Darling Ingredients (US), Tessenderlo Group (Belgium), Nitta Gelatin, Inc. (Japan), Gelita AG (Germany), Weishardt (France), Lapi Gelatine Spa (Italy), India Gelatine & Chemicals Ltd. (India), Trobas Gelatine B.V. (Netherlands), Sterling (India), Roxlor (US), Suheung (South Korea), and Ewald Gelatin GmbH (Germany).

Gelatin Market Ecosystem

To know about the assumptions considered for the study, download the pdf brochure

Source Insight:

Based on source, plant sources is estimated to account for the fastest market share of the gelatin market

Gelatin from plant sources is projected to be the fastest-growing during the forecast period registering a CAGR of 7.9% during the forecast period. Gelatin derived from plant sources is fastest growing segment due to the rise in the vegan population, many of the market players were able to introduce plant-based gelatin and derivative products to consumers. There is an increase in demand for non-mammalian gelatin for the food industry has raised interest in gelatin substitutes from plant sources.

Type Insights:

Based on type, the type A segment is anticipated to dominate the market

Gelatin is manufactured either by acidic or alkaline treatment of the raw material. Based on the treatment of raw materials, which include bovine hide and skin, pork skin, and fish & poultry skin, there are two types of gelatins, Type A and Type B. Type A gelatin is manufactured by treating the raw materials with an acidic solution. Type A is estimated to dominate the market in 2023 due to its wider usage in the food and beverages industry.

Regional Insights:

Europe: Gelatin Market Snapshot

Europe Gelatin Market

Europe had a market share of USD 1.3 billion in 2023, and the market is projected to grow with a CAGR of 6.1% during the forecast period in th gelatin market (2023-2028)

According to European Commission, in 2021, the food processing industry was one of the largest manufacturing sectors in Europe, with a share of about 14.2% of the total turnover of the manufacturing sector. The wine and pork exports from Europe amounted to USD 11.4 billion in 2020. The total exports and imports in 2020 were about USD 166 billion and USD 89.6 billion, respectively. The consumer buys food and beverage based on taste, safety, and cost. The strong growth of the food processing industry of Europe has supported the growth of the market. The presence of many food & beverage companies presents the European market a prominent consumer base. This ample availability of raw materials and the high dependence of European population on these sources pose as drivers for the growth of the market in the region.

Key Companies & Market Share Insights

Key players in this market include Darling Ingredients (US), Tessenderlo Group (Belgium), Nitta Gelatin, Inc. (Japan), Gelita AG (Germany), Weishardt (France), Lapi Gelatine Spa (Italy), India Gelatine & Chemicals Ltd. (India), Trobas Gelatine B.V. (Netherlands), Sterling (India), Roxlor (US), Suheung (South Korea), and Ewald Gelatin GmbH (Germany).

Gelatin Market Report Scope

Report Metric

Details

Market size value in 2023

USD 3.7 billion

Revenue prediction by 2028

USD 5.1 billion

Growth rate

CAGR of 6.6% from 2023 - 2028

Companies studied

  • Gelita AG (Germany
  • Darling Ingredients (US)
  • Tessenderlo Group (Belgium)
  • Nitta Gelatin, Inc.(US)
  • Weishardt (France)
  • Lapi Gelatine Spa (Italy)
  • Trobas Gelatine B.V. (Netherlands)
  • India Gelatine & Chemicals Ltd. (India)
  • Sterling Biotech Group (India)
  • Roxlor (US)
  • Suheung (South Korea)
  • Ewald Gelatine GmbH (Germany)

Market Driver

Growing demand for functional and convenience food and beverages

Largest Growing Region

Europe

Market Opportunities

The growth of the market in emerging economies can be attributed to shifting lifestyles and dietary preferences towards Western eating habits, a rising demand for functional ingredients in food products, and increased industrial activity necessitating process improvements.

Target Audience for Gelatin Market Report

  • Gelatin producers, suppliers, distributors, importers, and exporters
  • Large-scale food and beverage ingredient manufacturers, processed food manufacturers, and research organizations
  • Related government authorities, commercial research & development (R&D) institutions, FDA, EFSA, USDA, FSANZ, EUFIC government agencies & NGOs, and other regulatory bodies
  • Food product consumers
  • Regulatory bodies, including government agencies and NGOs
  • Commercial research & development (R&D) institutions and financial institutions
  • Government and research organizations

Gelatin Market Report Segmentation:

This research report categorizes the market based on type, source, application, function, and region.

Aspect

Details

By Source

  • Animal Source
    • Porcin
    • Bovine Skin
    • Fish & Poultry
    • Other Animal Sources
  • Plant Sources
    • Agar-Agar
    • Carrageenan
    • Locust bean gum
    • Other Plant Sources

By Type

  • Type A
  • Type B

Gelatin Market By Function

  • Thickener
  • Stabilizer
  • Gelling Agent
  • Other Functions

By Application

  • Food & Beverages
  • Pharmaceuticals
  • Health & Nutrition
  • Cosmetics & personal care

By Region

  • North America
  • Europe
  • Asia Pacific (APAC)
  • Rest of the World (RoW)
Gelatin Market Recent Developments & Industry News: 
  • In November 2022, PB Leiner, a subsidiary of Tessenderlo Group, launched TEXTURA Tempo Ready, a texturizing gelatin solution for the food service industry. It is packed in small pouches and distributed to chefs through the selected wholesalers. This product launch provides intense flavor, mouthfeel, and enhanced stability over time.
  • In October 2022, Darling Ingredients launched a new gelatin product, Quali-Pure, for pharmaceutical applications, such as embolization, wound healing, drug delivery, hemostatic, and vaccinations. Quali-Pure provides controlled endotoxin levels, batch-to-batch consistency, biocompatibility, and biodegradability and completely supports medical device compliance with ISO 22442 and the new EU Medical Device Regulation (MDR) criteria.
  • In December 2021, Gelita AG has acquired 65% of shares of SelJel, a Turkish gelatin producer. With this joint venture, Gelita AG strengthened its position as the industry’s global leader. Gelita's growth plan is to fulfill the rising demand for gelatin, specifically halal bovine gelatin. Increasing market share in this growth region is crucial in Islamic states and a significant portion of Asia.  

Frequently Asked Questions (FAQ):

To speak to our analyst for a discussion on the above findings, click Speak to Analyst

TABLE OF CONTENTS
 
1 INTRODUCTION (Page No. - 32)
    1.1 STUDY OBJECTIVES 
    1.2 GELATIN MARKET DEFINITION 
    1.3 STUDY SCOPE 
           FIGURE 1 MARKET SEGMENTATION
           TABLE 1 INCLUSIONS AND EXCLUSIONS
    1.4 REGIONS COVERED 
    1.5 YEARS CONSIDERED 
    1.6 CURRENCY CONSIDERED 
           TABLE 2 USD EXCHANGE RATES CONSIDERED, 2020–2022
    1.7 VOLUME UNITS CONSIDERED 
    1.8 STAKEHOLDERS 
    1.9 SUMMARY OF CHANGES 
           1.9.1 RECESSION IMPACT
 
2 RESEARCH METHODOLOGY (Page No. - 37)
    2.1 RESEARCH DATA 
           FIGURE 2 MARKET: RESEARCH DESIGN
           2.1.1 SECONDARY DATA
                    2.1.1.1 Key data from secondary sources
           2.1.2 PRIMARY DATA
                    2.1.2.1 Key data from primary sources
                    2.1.2.2 Key industry insights
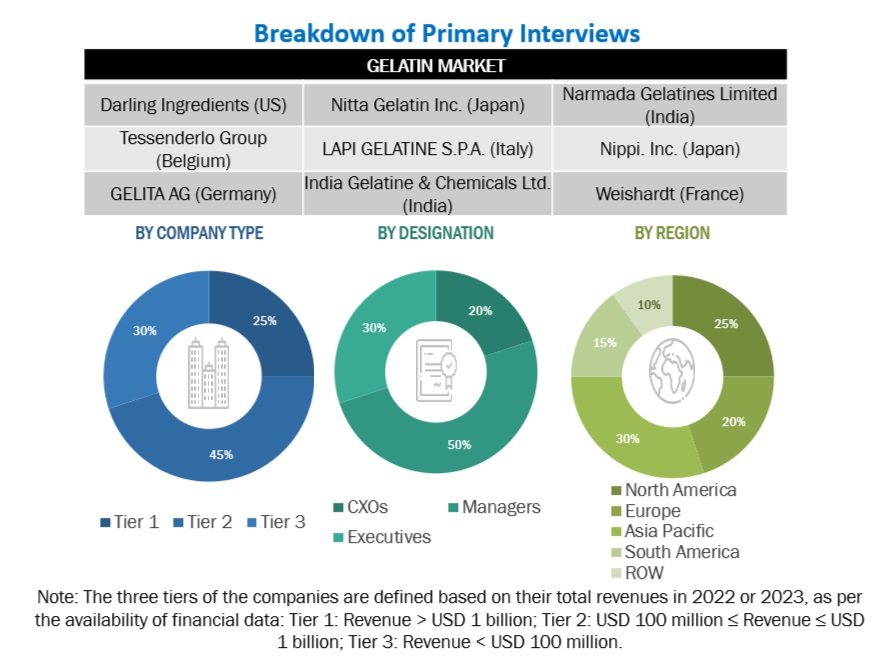
                    2.1.2.3 Breakdown of primary interviews
                               FIGURE 3 BREAKDOWN OF PRIMARY INTERVIEWS: BY COMPANY TYPE, DESIGNATION, AND REGION
    2.2 MARKET SIZE ESTIMATION 
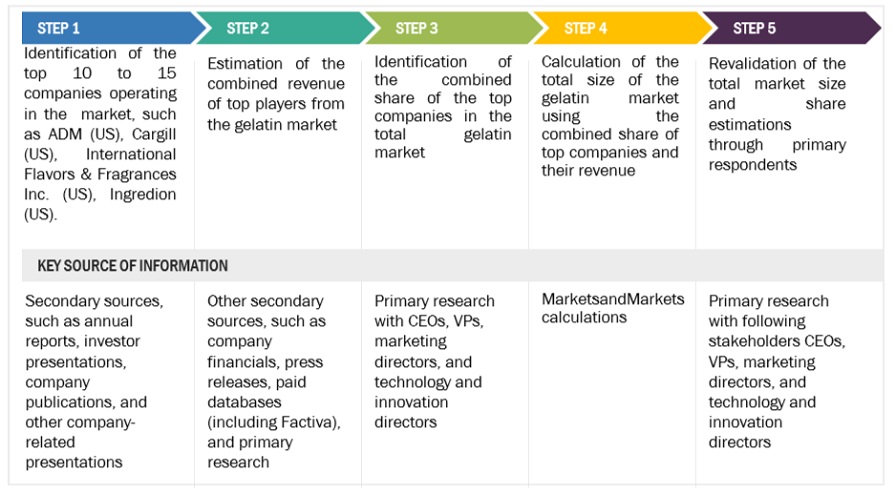
           2.2.1 APPROACH ONE - BOTTOM-UP APPROACH
                    FIGURE 4 MARKET: APPROACH ONE (BOTTOM-UP APPROACH)
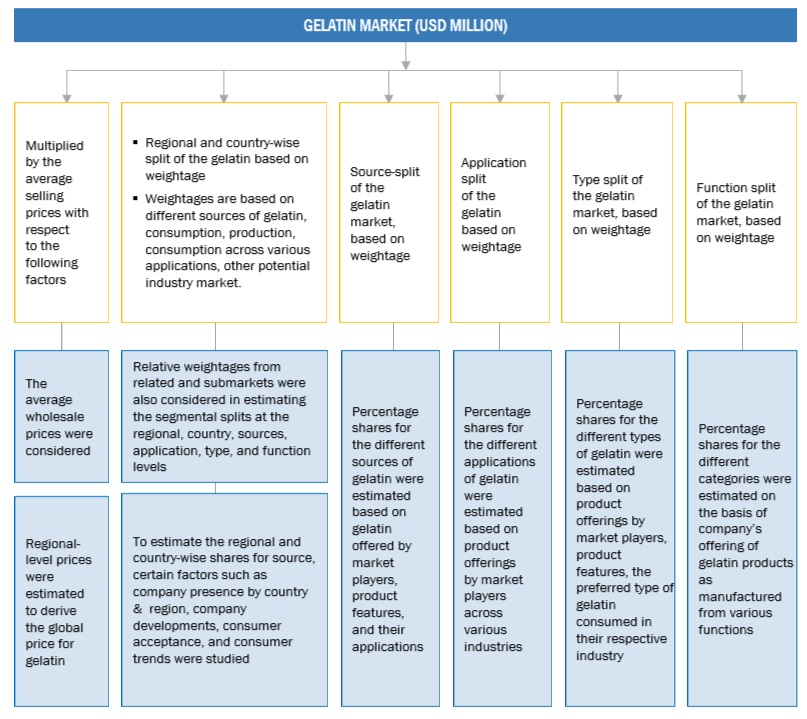
           2.2.2 APPROACH TWO – TOP-DOWN APPROACH
                    FIGURE 5 MARKET: APPROACH TWO (TOP-DOWN APPROACH)
    2.3 DATA TRIANGULATION 
           FIGURE 6 DATA TRIANGULATION METHODOLOGY
    2.4 RESEARCH ASSUMPTIONS 
           FIGURE 7 MARKET RESEARCH ASSUMPTIONS CONSIDERED
    2.5 LIMITATIONS 
           FIGURE 8 STUDY LIMITATIONS AND RISK ASSESSMENT
    2.6 RECESSION IMPACT ON GELATIN MARKET 
           2.6.1 MACROINDICATORS OF RECESSION
                    FIGURE 9 INDICATORS OF RECESSION
                    FIGURE 10 WORLD INFLATION RATE: 2011–2021
                    FIGURE 11 GLOBAL GDP: 2011–2021 (USD TRILLION)
                    FIGURE 12 GLOBAL FOOD INGREDIENTS MARKET: CURRENT FORECAST VS. RECESSION FORECAST
                    FIGURE 13 RECESSION INDICATORS AND THEIR IMPACT ON THE MARKET
                    FIGURE 14 GLOBAL MARKET: CURRENT FORECAST VS. RECESSION FORECAST
 
3 EXECUTIVE SUMMARY (Page No. - 51)
    TABLE 3 MARKET SNAPSHOT, 2023 VS. 2028 
    FIGURE 15 MARKET, BY TYPE, 2023 VS. 2028 (USD MILLION) 
    FIGURE 16 MARKET, BY APPLICATION, 2023 VS. 2028 (USD MILLION) 
    FIGURE 17 MARKET, BY FUNCTION, 2023 VS. 2028 (USD MILLION) 
    FIGURE 18 MARKET, BY SOURCE, 2023 VS. 2028 (USD MILLION) 
    FIGURE 19 MARKET SHARES, BY REGION, 2023 
 
4 PREMIUM INSIGHTS (Page No. - 55)
    4.1 ATTRACTIVE OPPORTUNITIES FOR PLAYERS IN MARKET 
           FIGURE 20 INCREASING DEMAND FOR FUNCTIONAL AND CONVENIENCE FOOD & BEVERAGE TO DRIVE THE MARKET
    4.2 MARKET: GROWTH RATE OF MAJOR REGIONAL SUBMARKETS 
           FIGURE 21 MEXICO AND INDIA TO BE FASTEST-GROWING MARKETS FOR GELATIN DURING FORECAST PERIOD
    4.3 ASIA PACIFIC: MARKET, BY FUNCTION & COUNTRY 
           FIGURE 22 STABILIZERS IN FUNCTION SEGMENT AND CHINA IN ASIA PACIFIC REGION TO ACCOUNT FOR LARGEST SHARE IN 2023
    4.4 MARKET, BY SOURCE 
           FIGURE 23 ANIMALS SEGMENT TO DOMINATE MARKET IN 2023
    4.5 MARKET, BY APPLICATION 
           FIGURE 24 FOOD & BEVERAGE TO DOMINATE THE MARKET DURING FORECAST PERIOD
    4.6 MARKET, BY FUNCTION 
           FIGURE 25 STABILIZERS TO DOMINATE MARKET DURING FORECAST PERIOD
    4.7 MARKET, BY TYPE 
           FIGURE 26 TYPE A SEGMENT TO DOMINATE GELATIN MARKET DURING FORECAST PERIOD
 
5 MARKET OVERVIEW (Page No. - 62)
    5.1 INTRODUCTION 
    5.2 MARKET DYNAMICS 
           FIGURE 27 MARKET: DRIVERS, RESTRAINTS, OPPORTUNITIES, AND CHALLENGES
           5.2.1 DRIVERS
                    5.2.1.1 Growing demand for functional and convenience food products
                               FIGURE 28 TOP 10 COUNTRY’S EXPORTS OF CONFECTIONERY PRODUCTS FROM US IN 2022
                    5.2.1.2 Increasing applications of gelatin in pharmaceutical industry
                               TABLE 4 GELATIN SPECIFICATION FOR PHARMACEUTICAL APPLICATIONS
                    5.2.1.3 Rising use of gelatin in medical and biomedical applications
                    5.2.1.4 Increasing demand for naturally sourced ingredients
           5.2.2 RESTRAINTS in the MARKET
                    5.2.2.1 Availability of alternative products
                               FIGURE 29 VEGAN POPULATION TRENDS, 2019–2022
                    5.2.2.2 Limited acceptance due to cultural restrictions
           5.2.3 OPPORTUNITIES
                    5.2.3.1 Use of gelatin in fortified confectionery and sports nutrition products
                    5.2.3.2 Use of gelatin as potential biodegradable packaging material for foods
                               TABLE 5 DIFFERENT COMPOUNDS USED AS ACTIVE ADDITIVES IN GELATIN-BASED FILMS AND COATINGS FOR FOOD PRODUCTS
                    5.2.3.3 Changing lifestyles and food habits and rapid industrialization in emerging economies
           5.2.4 CHALLENGES
                    5.2.4.1 Insufficient technologies to extract and process gelatin
                    5.2.4.2 Rising prices and scarcity of raw materials
 
6 INDUSTRY TRENDS (Page No. - 72)
    6.1 INTRODUCTION 
    6.2 TRENDS IMPACTING CUSTOMER BUSINESS 
           FIGURE 30 REVENUE SHIFT FOR GELATIN MARKET
    6.3 VALUE CHAIN ANALYSIS 
           6.3.1 RESEARCH & PRODUCT DEVELOPMENT
           6.3.2 SOURCING
           6.3.3 PRODUCTION & PROCESSING
           6.3.4 PACKAGING & STORAGE
           6.3.5 DISTRIBUTION, SALES, AND MARKETING
                    FIGURE 31 VALUE CHAIN ANALYSIS OF THE MARKET
    6.4 TRADE ANALYSIS 
           TABLE 6 TOP 10 IMPORTERS AND EXPORTERS OF GELATIN, 2021 (KG)
    6.5 TECHNOLOGY ANALYSIS 
           6.5.1 APPLICATION OF GREEN TECHNOLOGY IN GELATIN EXTRACTION
           6.5.2 ULTRASOUND-ASSISTED EXTRACTION
    6.6 PORTER’S FIVE FORCES ANALYSIS 
           TABLE 7 MARKET: PORTER’S FIVE FORCES ANALYSIS
           6.6.1 INTENSITY OF COMPETITIVE RIVALRY
           6.6.2 BARGAINING POWER OF SUPPLIERS
           6.6.3 BARGAINING POWER OF BUYERS
           6.6.4 THREAT OF SUBSTITUTES
           6.6.5 THREAT OF NEW ENTRANTS
    6.7 PRICING ANALYSIS 
           6.7.1 AVERAGE SELLING PRICE TREND ANALYSIS
                    TABLE 8 ARKET: AVERAGE SELLING PRICE, BY SOURCE & REGION, 2022–2023 (USD/KT)
                    TABLE 9 PORCINE GELATIN MARKET: AVERAGE SELLING PRICE, BY REGION, 2019–2023 (USD/KG)
                    TABLE 10 BOVINE SKIN GELATIN: MARKET: AVERAGE SELLING PRICE, BY REGION, 2019–2023 (USD/KG)
                    TABLE 11 MARKET: AVERAGE SELLING PRICE, BY REGION, 2019–2023 (USD/KG)
                    TABLE 12 FISH & POULTRY GELATIN: MARKET: AVERAGE SELLING PRICE, BY REGION, 2019–2023 (USD/KG)
                    TABLE 13 OTHER ANIMAL SOURCES GELATIN: MARKET: AVERAGE SELLING PRICE, BY REGION, 2019–2023 (USD/KG)
                    TABLE 14 PLANT-SOURCED GELATIN: MARKET: AVERAGE SELLING PRICE, BY REGION, 2019–2023 (USD/KG)
    6.8 KEY STAKEHOLDERS AND BUYING CRITERIA 
           6.8.1 KEY STAKEHOLDERS IN BUYING PROCESS
                    FIGURE 32 INFLUENCE OF STAKEHOLDERS ON BUYING PROCESS
                    TABLE 15 INFLUENCE OF STAKEHOLDERS ON BUYING PROCESS FOR TOP THREE APPLICATIONS (%)
           6.8.2 BUYING CRITERIA
                    FIGURE 33 KEY CRITERIA FOR SELECTING SUPPLIERS/VENDORS
                    TABLE 16 KEY CRITERIA FOR SELECTING SUPPLIERS/VENDORS
    6.9 KEY CONFERENCES & EVENTS IN 2023–2024 
           TABLE 17 KEY CONFERENCES & EVENTS IN MARKET, 2023–2024
    6.10 CASE STUDY 
           TABLE 18 CASE STUDY 1: NEED FOR STARCHLESS GUMMY PRODUCTS
    6.11 MARKET MAPPING AND ECOSYSTEM OF THE MARKET 
           6.11.1 DEMAND SIDE
           6.11.2 SUPPLY SIDE
                    FIGURE 34 MARKET: MARKET MAPPING
                    TABLE 19 MARKET: SUPPLY CHAIN (ECOSYSTEM)
 
7 GELATIN MARKET, BY TYPE (Page No. - 85)
    7.1 INTRODUCTION 
           FIGURE 35 PRODUCTION PROCESS: TYPE A AND TYPE B GELATIN
           TABLE 20 SPECIFICATIONS FOR EDIBLE GELATIN
           FIGURE 36 TYPE A SEGMENT TO CAPTURE LARGER SHARE OF THE MARKET IN 2023 AND 2028
           TABLE 21 MARKET, BY TYPE, 2018–2022 (USD MILLION)
           TABLE 22 MARKET, BY TYPE, 2023–2028 (USD MILLION)
    7.2 TYPE A 
           7.2.1 HIGH NUTRITIONAL COMPOSITION TO DRIVE TYPE A GELATIN USAGE
                    TABLE 23 NUTRITIONAL COMPOSITION OF TYPE A GELATIN
                    TABLE 24 TYPE A: MARKET, BY REGION, 2018–2022 (USD MILLION)
                    TABLE 25 TYPE A: MARKET, BY REGION, 2023–2028 (USD MILLION)
    7.3 TYPE B 
           7.3.1 AMPLE AVAILABILITY OF RAW MATERIALS TO DRIVE TYPE B GELATIN MANUFACTURING
                    TABLE 26 NUTRITIONAL COMPOSITION OF TYPE B GELATIN
                    TABLE 27 TYPE B: MARKET, BY REGION, 2018–2022 (USD MILLION)
                    TABLE 28 TYPE B: MARKET, BY REGION, 2023–2028 (USD MILLION)
 
8 GELATIN MARKET, BY SOURCE (Page No. - 91)
    8.1 INTRODUCTION 
           8.1.1 GELATIN: REGULATIONS SET BY DIFFERENT REGIONS/COUNTRIES
                    TABLE 29 AMINO ACID COMPOSITION OF GELATIN FROM DIFFERENT SOURCES
                    FIGURE 37 MARKET, BY SOURCE, 2023 VS. 2028 (USD MILLION)
                    TABLE 30 MARKET, BY SOURCE, 2018–2022 (USD MILLION)
                    TABLE 31 MARKET, BY SOURCE, 2023–2028 (USD MILLION)
                    TABLE 32 MARKET, BY SOURCE, 2018–2022 (KT)
                    TABLE 33 MARKET, BY SOURCE, 2023–2028 (KT)
    8.2 ANIMALS 
           TABLE 34 ANIMAL SOURCES: MARKET, BY REGION, 2018–2022 (USD MILLION)
           TABLE 35 ANIMAL SOURCES: MARKET, BY REGION, 2023–2028 (USD MILLION)
           TABLE 36 ANIMAL SOURCES: MARKET, BY REGION, 2018–2022 (KT)
           TABLE 37 ANIMAL SOURCES: MARKET, BY REGION, 2023–2028 (KT)
           TABLE 38 MARKET, BY ANIMAL SOURCE, 2018–2022 (USD MILLION)
           TABLE 39 MARKET, BY ANIMAL SOURCE, 2023–2028 (USD MILLION)
           TABLE 40 MARKET, BY ANIMAL SOURCE, 2018–2022 (KT)
           TABLE 41 MARKET, BY ANIMAL SOURCE, 2023–2028 (KT)
           8.2.1 PORCINE
                    8.2.1.1 Increasing pork production to drive gelatin manufacturing industry worldwide
                               TABLE 42 PORCINE: MARKET, BY REGION, 2018–2022 (USD MILLION)
                               TABLE 43 PORCINE: MARKET, BY REGION, 2023–2028 (USD MILLION)
                               TABLE 44 PORCINE: MARKET, BY REGION, 2018–2022 (KT)
                               TABLE 45 PORCINE: MARKET, BY REGION, 2023–2028 (KT)
           8.2.2 BOVINE SKIN
                    8.2.2.1 Abundant availability and health benefits of gelatin to drive bovine skin market growth
                               TABLE 46 BOVINE SKIN: MARKET, BY REGION, 2018–2022 (USD MILLION)
                               TABLE 47 BOVINE SKIN: MARKET, BY REGION, 2023–2028 (USD MILLION)
                               TABLE 48 BOVINE SKIN: MARKET, BY REGION, 2018–2022 (KT)
                               TABLE 49 BOVINE SKIN: MARKET, BY REGION, 2023–2028 (KT)
           8.2.3 BOVINE BONE
                    8.2.3.1 Growing demand for fortified food products to drive bovine bone gelatin market
                               TABLE 50 BOVINE BONE: MARKET, BY REGION, 2018–2022 (USD MILLION)
                               TABLE 51 BOVINE BONE: MARKET, BY REGION, 2023–2028 (USD MILLION)
                               TABLE 52 BOVINE BONE: MARKET, BY REGION, 2018–2022 (KT)
                               TABLE 53 BOVINE BONE: MARKET, BY REGION, 2023–2028 (KT)
           8.2.4 FISH & POULTRY
                    8.2.4.1 Growing demand for alternate gelatin sources to drive fish & poultry market
                               TABLE 54 FISH & POULTRY: MARKET, BY REGION, 2018–2022 (USD MILLION)
                               TABLE 55 FISH & POULTRY: MARKET, BY REGION, 2023–2028 (USD MILLION)
                               TABLE 56 FISH & POULTRY: MARKET, BY REGION, 2018–2022 (KT)
                               TABLE 57 FISH & POULTRY: MARKET, BY REGION, 2023–2028 (KT)
           8.2.5 OTHER ANIMAL SOURCES
                    TABLE 58 OTHER ANIMAL SOURCES: MARKET, BY REGION, 2018–2022 (USD MILLION)
                    TABLE 59 OTHER ANIMAL SOURCES: MARKET, BY REGION, 2023–2028 (USD MILLION)
                    TABLE 60 OTHER ANIMAL SOURCES: MARKET, BY REGION, 2018–2022 (KT)
                    TABLE 61 OTHER ANIMAL SOURCES: MARKET, BY REGION, 2023–2028 (KT)
    8.3 PLANTS 
           TABLE 62 PLANT SOURCES: MARKET, BY REGION, 2018–2022 (USD MILLION)
           TABLE 63 PLANT SOURCES: MARKET, BY REGION, 2023–2028 (USD MILLION)
           TABLE 64 PLANT SOURCES: MARKET, BY REGION, 2018–2022 (KT)
           TABLE 65 PLANT SOURCES: MARKET, BY REGION, 2023–2028 (KT)
           TABLE 66 MARKET, BY PLANT SOURCE, 2018–2022 (USD MILLION)
           TABLE 67 MARKET, BY PLANT SOURCE, 2023–2028 (USD MILLION)
           8.3.1 AGAR-AGAR
                    8.3.1.1 Increasing demand for natural products to drive agar-agar gelatin market
                               TABLE 68 AGAR-AGAR: MARKET, BY REGION, 2018–2022 (USD MILLION)
                               TABLE 69 AGAR-AGAR: MARKET, BY REGION, 2023–2028 (USD MILLION)
           8.3.2 CARRAGEENAN
                    8.3.2.1 Rising use of carrageenan gelatin for various industrial applications to fuel market growth
                               TABLE 70 CARRAGEENAN: MARKET, BY REGION, 2018–2022 (USD MILLION)
                               TABLE 71 CARRAGEENAN: MARKET, BY REGION, 2023–2028 (USD MILLION)
           8.3.3 LOCUST BEAN GUM
                    8.3.3.1 Various functional properties to drive use of locust bean gum
                               TABLE 72 LOCUST BEAN GUM: MARKET, BY REGION, 2018–2022 (USD MILLION)
                               TABLE 73 LOCUST BEAN GUM: MARKET, BY REGION, 2023–2028 (USD MILLION)
           8.3.4 OTHER PLANT SOURCES
                    TABLE 74 OTHER PLANT SOURCES: MARKET, BY REGION, 2018–2022 (USD MILLION)
                    TABLE 75 OTHER PLANT SOURCES: MARKET, BY REGION, 2023–2028 (USD MILLION)
 
9 GELATIN MARKET, BY APPLICATION (Page No. - 112)
    9.1 INTRODUCTION 
    FIGURE 38 MARKET, BY APPLICATION, 2023 VS. 2028 (USD MILLION) 
    TABLE 76 MARKET, BY APPLICATION, 2018–2022 (USD MILLION) 
    TABLE 77 MARKET, BY APPLICATION, 2023–2028 (USD MILLION) 
    9.2 FOOD & BEVERAGE 
           9.2.1 GROWING DEMAND FOR PROCESSED FOOD & BEVERAGE TO DRIVE THE MARKET
                    TABLE 78 GELATIN AS FOOD INGREDIENT
                    TABLE 79 FOOD & BEVERAGE: MARKET, BY REGION, 2018–2022 (USD MILLION)
                    TABLE 80 FOOD & BEVERAGE: MARKET, BY REGION, 2023–2028 (USD MILLION)
           9.2.2 CONFECTIONERY & BAKERY
                    TABLE 81 GELATIN TYPES, FUNCTIONS, AND DOSAGES IN CONFECTIONERY & BAKERY APPLICATIONS
           9.2.3 BEVERAGES
           9.2.4 DAIRY PRODUCTS
           9.2.5 MEAT PRODUCTS
           9.2.6 OTHER FOOD PRODUCTS
    9.3 PHARMACEUTICAL 
           9.3.1 MULTI-FUNCTIONALITY AND HEALTH BENEFITS OF GELATIN TO DRIVE PHARMACEUTICAL MARKET
                    TABLE 82 PHARMACEUTICAL: MARKET, BY REGION, 2018–2022 (USD MILLION)
                    TABLE 83 PHARMACEUTICAL: MARKET, BY REGION, 2023–2028 (USD MILLION)
    9.4 HEALTH AND NUTRITION 
           9.4.1 INCREASE IN USE OF GELATIN IN NUTRACEUTICALS TO PUSH CONSUMERS TOWARD SPORTS NUTRITION
                    TABLE 84 GELATIN: NUTRITIONAL INFORMATION
                    TABLE 85 HEALTH AND NUTRITION: MARKET, BY REGION, 2018–2022 (USD MILLION)
                    TABLE 86 HEALTH AND NUTRITION: MARKET, BY REGION, 2023–2028 (USD MILLION)
    9.5 COSMETICS & PERSONAL CARE 
           9.5.1 INCREASING CONSUMER DEMAND FOR USE OF GELATIN IN COSMETICS DUE TO ITS ANTI-AGING PROPERTIES
                    TABLE 87 COSMETICS & PERSONAL CARE: MARKET, BY REGION, 2018–2022 (USD MILLION)
                    TABLE 88 COSMETICS & PERSONAL CARE: MARKET, BY REGION, 2023–2028 (USD MILLION)
 
10 GELATIN MARKET, BY FUNCTION (Page No. - 122)
     10.1 INTRODUCTION 
               FIGURE 39 STABILIZERS SEGMENT TO ACCOUNT FOR LARGEST MARKET SHARE THROUGHOUT FORECAST PERIOD
               TABLE 89 FUNCTIONAL PROPERTIES OF GELATIN IN FOOD
               TABLE 90 MARKET, BY FUNCTION, 2018–2022 (USD MILLION)
               TABLE 91 MARKET, BY FUNCTION, 2023–2028 (USD MILLION)
     10.2 THICKENERS 
             10.2.1 INCREASING DEMAND FOR GELATIN AS THICKENING AGENT IN FOOD AND COSMETICS & PERSONAL CARE INDUSTRIES
                       TABLE 92 THICKENERS: MARKET, BY REGION, 2018–2022 (USD MILLION)
                       TABLE 93 THICKENERS: MARKET, BY REGION, 2023–2028 (USD MILLION)
     10.3 STABILIZERS 
             10.3.1 GROWING DEMAND FOR GELATIN AS STABILIZER IN FOOD & BEVERAGE INDUSTRY DUE TO ITS FUNCTIONAL PROPERTIES
                       TABLE 94 STABILIZERS: MARKET, BY REGION, 2018–2022 (USD MILLION)
                       TABLE 95 STABILIZERS: MARKET, BY REGION, 2023–2028 (USD MILLION)
     10.4 GELLING AGENTS 
             10.4.1 RISING DEMAND FOR GELATIN AS GELLING AGENT IN VARIOUS FOOD PRODUCTS
                       TABLE 96 GELLING AGENTS: MARKET, BY REGION, 2018–2022 (USD MILLION)
                       TABLE 97 GELLING AGENTS: MARKET, BY REGION, 2023–2028 (USD MILLION)
     10.5 OTHERS 
               TABLE 98 OTHERS: MARKET, BY REGION, 2018–2022 (USD MILLION)
               TABLE 99 OTHERS: MARKET, BY REGION, 2023–2028 (USD MILLION)
 
11 GELATIN MARKET, BY REGION (Page No. - 131)
     11.1 INTRODUCTION 
               FIGURE 40 US TO DOMINATE THE MARKET IN TERMS OF MARKET SHARE
     11.2 NORTH AMERICA 
             11.2.1 NORTH AMERICA: RECESSION IMPACT ANALYSIS
                       TABLE 100 NORTH AMERICA: MARKET, BY COUNTRY, 2018–2022 (USD MILLION)
                       TABLE 101 NORTH AMERICA: MARKET, BY COUNTRY, 2023–2028 (USD MILLION)
                       TABLE 102 NORTH AMERICA: MARKET, BY SOURCE, 2018–2022 (USD MILLION)
                       TABLE 103 NORTH AMERICA: MARKET, BY SOURCE, 2023–2028 (USD MILLION)
                       TABLE 104 NORTH AMERICA: MARKET, BY SOURCE, 2018–2022 (KT)
                       TABLE 105 NORTH AMERICA: MARKET, BY SOURCE, 2023–2028 (KT)
                       TABLE 106 NORTH AMERICA: MARKET, BY ANIMAL SOURCE, 2018–2022 (USD MILLION)
                       TABLE 107 NORTH AMERICA: MARKET, BY ANIMAL SOURCE, 2023–2028 (USD MILLION)
                       TABLE 108 NORTH AMERICA: MARKET, BY ANIMAL SOURCE, 2018–2022 (KT)
                       TABLE 109 NORTH AMERICA: MARKET, BY ANIMAL SOURCE, 2023–2028 (KT)
                       TABLE 110 NORTH AMERICA: MARKET, BY PLANT SOURCE, 2018–2022 (USD MILLION)
                       TABLE 111 NORTH AMERICA: MARKET, BY PLANT SOURCE, 2023–2028 (USD MILLION)
                       TABLE 112 NORTH AMERICA: MARKET, BY TYPE, 2018–2022 (USD MILLION)
                       TABLE 113 NORTH AMERICA: MARKET, BY TYPE, 2023–2028 (USD MILLION)
                       TABLE 114 NORTH AMERICA: MARKET, BY FUNCTION, 2018–2022 (USD MILLION)
                       TABLE 115 NORTH AMERICA: MARKET, BY FUNCTION, 2023–2028 (USD MILLION)
                       TABLE 116 NORTH AMERICA: GELATIN MARKET, BY APPLICATION, 2018–2022 (USD MILLION)
                       TABLE 117 NORTH AMERICA: MARKET, BY APPLICATION, 2023–2028 (USD MILLION)
             11.2.2 US
                       11.2.2.1 Growing concerns for arthritis and obesity to drive the market
                                   TABLE 118 US: MARKET, BY SOURCE, 2018–2022 (USD MILLION)
                                   TABLE 119 US: MARKET, BY SOURCE, 2023–2028 (USD MILLION)
                                   TABLE 120 US: MARKET, BY ANIMAL SOURCE, 2018–2022 (USD MILLION)
                                   TABLE 121 US: MARKET, BY ANIMAL SOURCE, 2023–2028 (USD MILLION)
                                   TABLE 122 US: MARKET, BY APPLICATION, 2018–2022 (USD MILLION)
                                   TABLE 123 US:  MARKET, BY APPLICATION, 2023–2028 (USD MILLION)
             11.2.3 CANADA
                       11.2.3.1 Substantial growth of food & beverage sector to drive the market
                                   TABLE 124 CANADA: MARKET, BY SOURCE, 2018–2022 (USD MILLION)
                                   TABLE 125 CANADA: MARKET, BY SOURCE, 2023–2028 (USD MILLION)
                                   TABLE 126 CANADA: MARKET, BY ANIMAL SOURCE, 2018–2022 (USD MILLION)
                                   TABLE 127 CANADA: MARKET, BY ANIMAL SOURCE, 2023–2028 (USD MILLION)
                                   TABLE 128 CANADA: MARKET, BY APPLICATION, 2018–2022 (USD MILLION)
                                   TABLE 129 CANADA: MARKET, BY APPLICATION, 2023–2028 (USD MILLION)
             11.2.4 MEXICO
                       11.2.4.1 Higher meat production and growing bakery industry to drive demand for gelatin
                                   TABLE 130 MEXICO: MARKET, BY SOURCE, 2018–2022 (USD MILLION)
                                   TABLE 131 MEXICO: MARKET, BY SOURCE, 2023–2028 (USD MILLION)
                                   TABLE 132 MEXICO: MARKET, BY ANIMAL SOURCE, 2018–2022 (USD MILLION)
                                   TABLE 133 MEXICO: MARKET, BY ANIMAL SOURCE, 2023–2028 (USD MILLION)
                                   TABLE 134 MEXICO: MARKET, BY APPLICATION, 2018–2022 (USD MILLION)
                                   TABLE 135 MEXICO: MARKET, BY APPLICATION, 2023–2028 (USD MILLION)
     11.3 EUROPE 
               FIGURE 41 EUROPE: MARKET SNAPSHOT
             11.3.1 EUROPE: RECESSION IMPACT ANALYSIS
                       FIGURE 42 EUROPE MARKET: RECESSION IMPACT ANALYSIS
                       TABLE 136 EUROPE: MARKET, BY COUNTRY, 2018–2022 (USD MILLION)
                       TABLE 137 EUROPE: MARKET, BY COUNTRY, 2023–2028 (USD MILLION)
                       TABLE 138 EUROPE: MARKET, BY SOURCE, 2018–2022 (USD MILLION)
                       TABLE 139 EUROPE: MARKET, BY SOURCE, 2023–2028 (USD MILLION)
                       TABLE 140 EUROPE: MARKET, BY SOURCE, 2018–2022 (KT)
                       TABLE 141 EUROPE: MARKET, BY SOURCE, 2023–2028 (KT)
                       TABLE 142 EUROPE: MARKET, BY ANIMAL SOURCE, 2018–2022 (USD MILLION)
                       TABLE 143 EUROPE: MARKET, BY ANIMAL SOURCE, 2023–2028 (USD MILLION)
                       TABLE 144 EUROPE: GELATIN MARKET, BY ANIMAL SOURCE, 2018–2022 (KT)
                       TABLE 145 EUROPE: MARKET, BY ANIMAL SOURCE, 2023–2028 (KT)
                       TABLE 146 EUROPE: MARKET, BY PLANT SOURCE, 2018–2022 (USD MILLION)
                       TABLE 147 EUROPE: MARKET, BY PLANT SOURCE, 2023–2028 (USD MILLION)
                       TABLE 148 EUROPE: MARKET, BY TYPE, 2018–2022 (USD MILLION)
                       TABLE 149 EUROPE: MARKET, BY TYPE, 2023–2028 (USD MILLION)
                       TABLE 150 EUROPE: MARKET, BY FUNCTION, 2018–2022 (USD MILLION)
                       TABLE 151 EUROPE: MARKET, BY FUNCTION, 2023–2028 (USD MILLION)
                       TABLE 152 EUROPE: MARKET, BY APPLICATION, 2018–2022 (USD MILLION)
                       TABLE 153 EUROPE: MARKET, BY APPLICATION, 2023–2028 (USD MILLION)
             11.3.2 GERMANY
                       11.3.2.1 Growth of pharmaceutical industry to drive demand for gelatin
                                   TABLE 154 GERMANY: MARKET, BY SOURCE, 2018–2022 (USD MILLION)
                                   TABLE 155 GERMANY: MARKET, BY SOURCE, 2023–2028 (USD MILLION)
                                   TABLE 156 GERMANY: MARKET, BY ANIMAL SOURCE, 2018–2022 (USD MILLION)
                                   TABLE 157 GERMANY: MARKET, BY ANIMAL SOURCE, 2023–2028 (USD MILLION)
                                   TABLE 158 GERMANY: MARKET, BY APPLICATION, 2018–2022 (USD MILLION)
                                   TABLE 159 GERMANY: MARKET, BY APPLICATION, 2023–2028 (USD MILLION)
             11.3.3 FRANCE
                       11.3.3.1 High beef production and growth of food & beverage industry to drive gelatin market
                                   TABLE 160 FRANCE: MARKET, BY SOURCE, 2018–2022 (USD MILLION)
                                   TABLE 161 FRANCE: MARKET, BY SOURCE, 2023–2028 (USD MILLION)
                                   TABLE 162 FRANCE: MARKET, BY ANIMAL SOURCE, 2018–2022 (USD MILLION)
                                   TABLE 163 FRANCE: MARKET, BY ANIMAL SOURCE, 2023–2028 (USD MILLION)
                                   TABLE 164 FRANCE: MARKET, BY APPLICATION, 2018–2022 (USD MILLION)
                                   TABLE 165 FRANCE: MARKET, BY APPLICATION, 2023–2028 (USD MILLION)
             11.3.4 UK
                       11.3.4.1 Growth of food & beverage industry to be major driver for market growth
                                   TABLE 166 UK: MARKET, BY SOURCE, 2018–2022 (USD MILLION)
                                   TABLE 167 UK: MARKET, BY SOURCE, 2023–2028 (USD MILLION)
                                   TABLE 168 UK: MARKET, BY ANIMAL SOURCE, 2018–2022 (USD MILLION)
                                   TABLE 169 UK: MARKET, BY ANIMAL SOURCE, 2023–2028 (USD MILLION)
                                   TABLE 170 UK: MARKET, BY APPLICATION, 2018–2022 (USD MILLION)
                                   TABLE 171 UK: MARKET, BY APPLICATION, 2023–2028 (USD MILLION)
             11.3.5 ITALY
                       11.3.5.1 Growth of food and pharmaceutical industries to fuel demand for gelatin
                                   TABLE 172 ITALY: GELATIN MARKET, BY SOURCE, 2018–2022 (USD MILLION)
                                   TABLE 173 ITALY: MARKET, BY SOURCE, 2023–2028 (USD MILLION)
                                   TABLE 174 ITALY: MARKET, BY ANIMAL SOURCE, 2018–2022 (USD MILLION)
                                   TABLE 175 ITALY: MARKET, BY ANIMAL SOURCE, 2023–2028 (USD MILLION)
                                   TABLE 176 ITALY: MARKET, BY APPLICATION, 2018–2022 (USD MILLION)
                                   TABLE 177 ITALY: MARKET, BY APPLICATION, 2023–2028 (USD MILLION)
             11.3.6 SPAIN
                       11.3.6.1 Spain’s food industry to drive market for gelatin
                                   TABLE 178 SPAIN: MARKET, BY SOURCE, 2018–2022 (USD MILLION)
                                   TABLE 179 SPAIN: MARKET, BY SOURCE, 2023–2028 (USD MILLION)
                                   TABLE 180 SPAIN: MARKET, BY ANIMAL SOURCE, 2018–2022 (USD MILLION)
                                   TABLE 181 SPAIN: MARKET, BY ANIMAL SOURCE, 2023–2028 (USD MILLION)
                                   TABLE 182 SPAIN: MARKET, BY APPLICATION, 2018–2022 (USD MILLION)
                                   TABLE 183 SPAIN: MARKET, BY APPLICATION, 2023–2028 (USD MILLION)
             11.3.7 REST OF EUROPE
                       11.3.7.1 Changes in consumer lifestyles, growth in food & beverage industry, and large pharmaceutical consumption to drive market
                                   TABLE 184 REST OF EUROPE: MARKET, BY SOURCE, 2018–2022 (USD MILLION)
                                   TABLE 185 REST OF EUROPE: MARKET, BY SOURCE, 2023–2028 (USD MILLION)
                                   TABLE 186 REST OF EUROPE: MARKET, BY ANIMAL SOURCE, 2018–2022 (USD MILLION)
                                   TABLE 187 REST OF EUROPE: MARKET, BY ANIMAL SOURCE, 2023–2028 (USD MILLION)
                                   TABLE 188 REST OF EUROPE: MARKET, BY APPLICATION, 2018–2022 (USD MILLION)
                                   TABLE 189 REST OF EUROPE: MARKET, BY FUNCTION, 2023–2028 (USD MILLION)
     11.4 ASIA PACIFIC 
             11.4.1 ASIA PACIFIC: RECESSION IMPACT ANALYSIS
                       FIGURE 43 ASIA PACIFIC GELATIN MARKET: RECESSION IMPACT ANALYSIS
                       FIGURE 44 ASIA PACIFIC: MARKET SNAPSHOT
                       TABLE 190 ASIA PACIFIC: MARKET, BY COUNTRY, 2018–2022 (USD MILLION)
                       TABLE 191 ASIA PACIFIC: MARKET, BY COUNTRY, 2023–2028 (USD MILLION)
                       TABLE 192 ASIA PACIFIC: MARKET, BY TYPE, 2018–2022 (USD MILLION)
                       TABLE 193 ASIA PACIFIC: MARKET, BY TYPE, 2023–2028 (USD MILLION)
                       TABLE 194 ASIA PACIFIC: MARKET, BY FUNCTION, 2018–2022 (USD MILLION)
                       TABLE 195 ASIA PACIFIC: MARKET, BY FUNCTION, 2023–2028 (USD MILLION)
                       TABLE 196 ASIA PACIFIC: MARKET, BY APPLICATION, 2018–2022 (USD MILLION)
                       TABLE 197 ASIA PACIFIC: MARKET, BY FUNCTION, 2023–2028 (USD MILLION)
                       TABLE 198 ASIA PACIFIC: MARKET, BY SOURCE, 2018–2022 (USD MILLION)
                       TABLE 199 ASIA PACIFIC: MARKET, BY SOURCE, 2023–2028 (USD MILLION)
                       TABLE 200 ASIA PACIFIC: MARKET, BY SOURCE, 2018–2022 (KT)
                       TABLE 201 ASIA PACIFIC: MARKET, BY SOURCE, 2023–2028 (KT)
                       TABLE 202 ASIA PACIFIC: MARKET, BY ANIMAL SOURCE, 2018–2022 (USD MILLION)
                       TABLE 203 ASIA PACIFIC: MARKET, BY ANIMAL SOURCE, 2023–2028 (USD MILLION)
                       TABLE 204 ASIA PACIFIC: MARKET, BY ANIMAL SOURCE, 2018–2022 (KT)
                       TABLE 205 ASIA PACIFIC: MARKET, BY ANIMAL SOURCE, 2023–2028 (KT)
                       TABLE 206 ASIA PACIFIC: MARKET, BY PLANT SOURCE, 2018–2022 (USD MILLION)
                       TABLE 207 ASIA PACIFIC: MARKET, BY PLANT SOURCE, 2023–2028 (USD MILLION)
             11.4.2 CHINA
                       11.4.2.1 Rapidly growing pharmaceutical industry in China to drive gelatin demand in medicines
                                   TABLE 208 CHINA: GELATIN MARKET, BY SOURCE, 2018–2022 (USD MILLION)
                                   TABLE 209 CHINA: MARKET, BY SOURCE, 2023–2028 (USD MILLION)
                                   TABLE 210 CHINA: MARKET, BY ANIMAL SOURCE, 2018–2022 (USD MILLION)
                                   TABLE 211 CHINA: MARKET, BY ANIMAL SOURCE, 2023–2028 (USD MILLION)
                                   TABLE 212 CHINA: MARKET, BY APPLICATION, 2018–2022 (USD MILLION)
                                   TABLE 213 CHINA: MARKET, BY APPLICATION, 2023–2028 (USD MILLION)
             11.4.3 JAPAN
                       11.4.3.1 Growing aging population to drive the market
                                   TABLE 214 JAPAN: MARKET, BY SOURCE, 2018–2022 (USD MILLION)
                                   TABLE 215 JAPAN: MARKET, BY SOURCE, 2023–2028 (USD MILLION)
                                   TABLE 216 JAPAN: MARKET, BY ANIMAL SOURCE, 2018–2022 (USD MILLION)
                                   TABLE 217 JAPAN: MARKET, BY ANIMAL SOURCE, 2023–2028 (USD MILLION)
                                   TABLE 218 JAPAN: MARKET, BY APPLICATION, 2018–2022 (USD MILLION)
                                   TABLE 219 JAPAN: MARKET, BY APPLICATION, 2023–2028 (USD MILLION)
             11.4.4 INDIA
                       11.4.4.1 Growth of confectionery industry to drive market
                                   TABLE 220 INDIA: MARKET, BY SOURCE, 2018–2022 (USD MILLION)
                                   TABLE 221 INDIA: MARKET, BY SOURCE, 2023–2028 (USD MILLION)
                                   TABLE 222 INDIA: MARKET, BY ANIMAL SOURCE, 2018–2022 (USD MILLION)
                                   TABLE 223 INDIA: MARKET, BY ANIMAL SOURCE, 2023–2028 (USD MILLION)
                                   TABLE 224 INDIA: MARKET, BY APPLICATION, 2018–2022 (USD MILLION)
                                   TABLE 225 INDIA: MARKET, BY APPLICATION, 2023–2028 (USD MILLION)
             11.4.5 AUSTRALIA AND NEW ZEALAND
                       11.4.5.1 Australia’s pharmaceutical industry and New Zealand’s food & beverage industry to drive demand for gelatin
                                   TABLE 226 AUSTRALIA & NEW ZEALAND: MARKET, BY SOURCE, 2018–2022 (USD MILLION)
                                   TABLE 227 AUSTRALIA & NEW ZEALAND: MARKET, BY SOURCE, 2023–2028 (USD MILLION)
                                   TABLE 228 AUSTRALIA & NEW ZEALAND: MARKET, BY ANIMAL SOURCE, 2018–2022 (USD MILLION)
                                   TABLE 229 AUSTRALIA & NEW ZEALAND: MARKET, BY ANIMAL SOURCE, 2023–2028 (USD MILLION)
                                   TABLE 230 AUSTRALIA & NEW ZEALAND: MARKET, BY APPLICATION, 2018–2022 (USD MILLION)
                                   TABLE 231 AUSTRALIA & NEW ZEALAND: MARKET, BY APPLICATION, 2023–2028 (USD MILLION)
             11.4.6 REST OF ASIA PACIFIC
                       TABLE 232 REST OF ASIA PACIFIC: GELATIN MARKET, BY SOURCE, 2018–2022 (USD MILLION)
                       TABLE 233 REST OF ASIA PACIFIC: MARKET, BY SOURCE, 2023–2028 (USD MILLION)
                       TABLE 234 REST OF ASIA PACIFIC: MARKET, BY ANIMAL SOURCE, 2018–2022 (USD MILLION)
                       TABLE 235 REST OF ASIA PACIFIC: MARKET, BY ANIMAL SOURCE, 2023–2028 (USD MILLION)
                       TABLE 236 REST OF ASIA PACIFIC: MARKET, BY APPLICATION, 2018–2022 (USD MILLION)
                       TABLE 237 REST OF ASIA PACIFIC: MARKET, BY APPLICATION, 2023–2028 (USD MILLION)
     11.5 REST OF THE WORLD (ROW) 
             11.5.1 ROW: RECESSION IMPACT ANALYSIS
                       TABLE 238 ROW: MARKET, BY COUNTRY, 2018–2022 (USD MILLION)
                       TABLE 239 ROW: MARKET, BY COUNTRY, 2023–2028 (USD MILLION)
                       TABLE 240 ROW: MARKET, BY TYPE, 2018–2022 (USD MILLION)
                       TABLE 241 ROW: MARKET, BY TYPE, 2023–2028 (USD MILLION)
                       TABLE 242 ROW: MARKET, BY FUNCTION, 2018–2022 (USD MILLION)
                       TABLE 243 ROW: MARKET, BY FUNCTION, 2023–2028 (USD MILLION)
                       TABLE 244 ROW: MARKET, BY APPLICATION, 2018–2022 (USD MILLION)
                       TABLE 245 ROW: MARKET, BY APPLICATION, 2023–2028 (USD MILLION)
                       TABLE 246 ROW: MARKET, BY SOURCE, 2018–2022 (USD MILLION)
                       TABLE 247 ROW: MARKET, BY SOURCE, 2023–2028 (USD MILLION)
                       TABLE 248 ROW: MARKET, BY SOURCE, 2018–2022 (KT)
                       TABLE 249 ROW: MARKET, BY SOURCE, 2023–2028 (KT)
                       TABLE 250 ROW: MARKET, BY ANIMAL SOURCE, 2018–2022 (USD MILLION)
                       TABLE 251 ROW: MARKET, BY ANIMAL SOURCE, 2023–2028 (USD MILLION)
                       TABLE 252 ROW: MARKET, BY ANIMAL SOURCE, 2018–2022 (KT)
                       TABLE 253 ROW: MARKET, BY ANIMAL SOURCE, 2023–2028 (KT)
                       TABLE 254 ROW: MARKET, BY PLANT SOURCE, 2018–2022 (USD MILLION)
                       TABLE 255 ROW: MARKET, BY PLANT SOURCE, 2023–2028 (USD MILLION)
             11.5.2 SOUTH AMERICA
                       11.5.2.1 Ample availability of raw materials and high acceptability for beef and beef products to drive bovine gelatin market
                                   TABLE 256 SOUTH AMERICA: MARKET, BY SOURCE, 2018–2022 (USD MILLION)
                                   TABLE 257 SOUTH AMERICA: MARKET, BY SOURCE, 2023–2028 (USD MILLION)
                                   TABLE 258 SOUTH AMERICA: MARKET, BY ANIMAL SOURCE, 2018–2022 (USD MILLION)
                                   TABLE 259 SOUTH AMERICA: MARKET, BY ANIMAL SOURCE, 2023–2028 (USD MILLION)
                                   TABLE 260 SOUTH AMERICA: MARKET, BY APPLICATION, 2018–2022 (USD MILLION)
                                   TABLE 261 SOUTH AMERICA: MARKET, BY FUNCTION, 2023–2028 (USD MILLION)
             11.5.3 MIDDLE EAST & AFRICA
                       11.5.3.1 Growing number of food & pharmaceutical manufacturers and health concerns to drive Middle Eastern & African market
                                   TABLE 262 MIDDLE EAST & AFRICA: MARKET, BY SOURCE, 2018–2022 (USD MILLION)
                                   TABLE 263 MIDDLE EAST & AFRICA: MARKET, BY SOURCE, 2023–2028 (USD MILLION)
                                   TABLE 264 MIDDLE EAST & AFRICA: MARKET, BY ANIMAL SOURCE, 2018–2022 (USD MILLION)
                                   TABLE 265 MIDDLE EAST & AFRICA: MARKET, BY ANIMAL SOURCE, 2023–2028 (USD MILLION)
                                   TABLE 266 MIDDLE EAST & AFRICA: MARKET, BY APPLICATION, 2018–2022 (USD MILLION)
                                   TABLE 267 MIDDLE EAST & AFRICA: MARKET, BY APPLICATION, 2023–2028 (USD MILLION)
 
12 COMPETITIVE LANDSCAPE (Page No. - 197)
     12.1 OVERVIEW 
     12.2 STRATEGIES ADOPTED BY KEY PLAYERS 
               TABLE 268 OVERVIEW OF STRATEGIES ADOPTED BY KEY PLAYERS
     12.3 HISTORICAL REVENUE ANALYSIS OF KEY PLAYERS 
               FIGURE 45 REVENUE ANALYSIS OF KEY PLAYERS IN THE MARKET, 2019–2021 (USD BILLION)
     12.4 MARKET SHARE ANALYSIS 
               TABLE 269 MARKET SHARE ANALYSIS OF GELATIN MARKET, 2022
     12.5 COMPANY EVALUATION QUADRANT (KEY PLAYERS) 
             12.5.1 STARS
             12.5.2 PERVASIVE PLAYERS
             12.5.3 EMERGING LEADERS
             12.5.4 PARTICIPANTS
                       FIGURE 46 MARKET: COMPANY EVALUATION QUADRANT, 2022 (KEY PLAYERS)
             12.5.5 MARKET PRODUCT FOOTPRINT (KEY PLAYERS)
                       TABLE 270 COMPANY FOOTPRINT, BY APPLICATION (KEY PLAYERS)
                       TABLE 271 COMPANY FOOTPRINT, BY SOURCE (KEY PLAYERS)
                       TABLE 272 COMPANY FOOTPRINT, BY REGION (KEY PLAYERS)
                       TABLE 273 OVERALL COMPANY FOOTPRINT (KEY PLAYERS)
     12.6 COMPANY EVALUATION QUADRANT (STARTUPS/SMES) 
             12.6.1 PROGRESSIVE COMPANIES
             12.6.2 STARTING BLOCKS
             12.6.3 RESPONSIVE COMPANIES
             12.6.4 DYNAMIC COMPANIES
                       FIGURE 47 MARKET: COMPANY EVALUATION QUADRANT, 2022 (STARTUPS/SMES)
                       TABLE 274 MARKET: COMPETITIVE BENCHMARKING OF STARTUPS/SMES
     12.7 COMPETITIVE SCENARIO 
             12.7.1 PRODUCT LAUNCHES
                       TABLE 275 GELATIN MARKET: PRODUCT LAUNCHES, 2019–2023
                       TABLE 276 MARKET: DEALS, 2019–2023
 
13 COMPANY PROFILES (Page No. - 210)
     13.1 KEY PLAYERS 
(Business Overview, Products/Services/Solutions Offered, MnM View, Key Strengths and Right to Win, Strategic Choices Made, Weaknesses and Competitive Threats, Recent Developments)*
             13.1.1 DARLING INGREDIENTS
                       TABLE 277 DARLING INGREDIENTS: BUSINESS OVERVIEW
                       FIGURE 48 DARLING INGREDIENTS: COMPANY SNAPSHOT
                       TABLE 278 DARLING INGREDIENTS: PRODUCTS/SERVICES/SOLUTIONS OFFERED
                       TABLE 279 DARLING INGREDIENTS: PRODUCT LAUNCHES
                       TABLE 280 DARLING INGREDIENTS: DEALS
             13.1.2 TESSENDERLO GROUP
                       TABLE 281 TESSENDERLO GROUP: BUSINESS OVERVIEW
                       FIGURE 49 TESSENDERLO GROUP: COMPANY SNAPSHOT
                       TABLE 282 TESSENDERLO GROUP: PRODUCTS/SERVICES/SOLUTIONS OFFERED
                       TABLE 283 TESSENDERLO GROUP: PRODUCT LAUNCHES
             13.1.3 NITTA GELATIN INC.
                       TABLE 284 NITTA GELATIN INC.: BUSINESS OVERVIEW
                       FIGURE 50 NITTA GELATIN INC.: COMPANY SNAPSHOT
                       TABLE 285 NITTA GELATIN INC.: PRODUCTS/SERVICES/SOLUTIONS OFFERED
             13.1.4 GELITA AG
                       TABLE 286 GELITA AG: GELATIN MARKET BUSINESS OVERVIEW
                       TABLE 287 GELITA AG: PRODUCTS/SERVICES/SOLUTIONS OFFERED
                       TABLE 288 GELITA AG: DEALS
             13.1.5 WEISHARDT
                       TABLE 289 WEISHARDT: BUSINESS OVERVIEW
                       TABLE 290 WEISHARDT: PRODUCTS/SERVICES/SOLUTIONS OFFERED
             13.1.6 LAPI GELATINE SPA
                       TABLE 291 LAPI GELATINE SPA: BUSINESS OVERVIEW
                       TABLE 292 LAPI GELATINE SPA: PRODUCTS/SERVICES/SOLUTIONS OFFERED
                       TABLE 293 LAPI GELATINE SPA: DEALS
             13.1.7 INDIA GELATINE & CHEMICALS LTD.
                       TABLE 294 INDIA GELATINE & CHEMICALS LTD.: BUSINESS OVERVIEW
                       FIGURE 51 INDIA GELATINE & CHEMICALS LTD.: COMPANY SNAPSHOT
                       TABLE 295 INDIA GELATINE & CHEMICALS LTD.: PRODUCTS/SERVICES/SOLUTIONS OFFERED
             13.1.8 TROBAS GELATINE B.V.
                       TABLE 296 TROBAS GELATINE B.V.: BUSINESS OVERVIEW
                       TABLE 297 TROBAS GELATINE B.V.: PRODUCTS/SERVICES/SOLUTIONS OFFERED
             13.1.9 STERLING BIOTECH LTD.
                       TABLE 298 STERLING BIOTECH LTD.: BUSINESS OVERVIEW
                       TABLE 299 STERLING BIOTECH LTD.: PRODUCTS/SERVICES/SOLUTIONS OFFERED
             13.1.10 ROXLOR
                       TABLE 300 ROXLOR: GELATIN MARKET BUSINESS OVERVIEW
                       TABLE 301 ROXLOR: PRODUCTS/SERVICES/SOLUTIONS OFFERED
             13.1.11 SUHEUNG
                       TABLE 302 SUHEUNG: BUSINESS OVERVIEW
                       TABLE 303 SUHEUNG: PRODUCTS/SERVICES/SOLUTIONS OFFERED
             13.1.12 EWALD-GELATIN GMBH
                       TABLE 304 EWALD-GELATIN GMBH: BUSINESS OVERVIEW
                       TABLE 305 EWALD-GELATIN GMBH: PRODUCTS/SERVICES/SOLUTIONS OFFERED
*Business Overview, Products/Services/Solutions Offered, MnM View, Key Strengths and Right to Win, Strategic Choices Made, Weaknesses and Competitive Threats, Recent Developments might not be captured in case of unlisted companies.
 
14 ADJACENT AND RELATED MARKETS (Page No. - 236)
     14.1 INTRODUCTION 
               TABLE 306 ADJACENT MARKETS
     14.2 ADJACENT MARKET STUDY LIMITATIONS 
     14.3 COLLAGEN MARKET 
             14.3.1 MARKET DEFINITION
             14.3.2 MARKET OVERVIEW
                       TABLE 307 COLLAGEN MARKET, BY PRODUCT TYPE, 2019–2021 (USD MILLION)
                       TABLE 308 COLLAGEN MARKET, BY PRODUCT TYPE, 2022–2030 (USD MILLION)
     14.4 COLLAGEN AND GELATIN MARKET 
             14.4.1 MARKET DEFINITION
             14.4.2 MARKET OVERVIEW
                       TABLE 309 COLLAGEN MARKET, BY SOURCE, 2019–2026 (USD MILLION)
                       TABLE 310 MARKET, BY SOURCE, 2019–2026 (USD MILLION)
     14.5 MARINE COLLAGEN MARKET 
             14.5.1 MARKET DEFINITION
             14.5.2 MARKET OVERVIEW
                       TABLE 311 MARINE COLLAGEN MARKET, BY TYPE, 2016–2020 (USD MILLION)
                       TABLE 312 MARINE COLLAGEN MARKET, BY TYPE, 2021–2026 (USD MILLION)
 
15 APPENDIX (Page No. - 241)
     15.1 DISCUSSION GUIDE 
     15.2 KNOWLEDGESTORE: MARKETSANDMARKETS’ SUBSCRIPTION PORTAL 
     15.3 CUSTOMIZATION OPTIONS 
     15.4 RELATED REPORTS 
     15.5 AUTHOR DETAILS 


The study involved four major activities in estimating the current size of the gelatin market. Exhaustive secondary research was done to collect information on the market, peer market, and parent market. The next step was to validate these findings, assumptions, and sizing with industry experts across the value chain through primary research. Both top-down and bottom-up approaches were employed to estimate the complete market size. After that, market breakdown and data triangulation were used to estimate the market size of segments and subsegments.

Secondary Research

This research study involved the extensive use of secondary sources—directories and databases such as Bloomberg Businessweek and Factiva—to identify and collect information useful for a technical, market-oriented, and commercial study of the market.

In the secondary research process, various sources such as annual reports, press releases & investor presentations of companies, white papers, food journals, certified publications, articles from recognized authors, gold & silver standard websites, directories, and databases, were referred to identify and collect information. This research study involved the extensive use of secondary sources—directories and databases such as Bloomberg Businessweek and Factiva—to identify and collect information useful for a technical, market-oriented, and commercial study of the gelatin market.

Secondary research was mainly used to obtain key information about the industry’s supply chain, the total pool of key players, and market classification and segmentation as per the industry trends to the bottom-most level, regional markets, and key developments from both market- and technology-oriented perspectives.

Primary Research

Extensive primary research was conducted after obtaining information regarding the market scenario through secondary research. Several primary interviews were conducted with market experts from both, the demand and supply sides across major countries of North America, Europe, Asia Pacific, the Middle East & Africa, and Latin America. Primary data was collected through questionnaires, emails, and telephonic interview. The primary sources from the supply side included various industry experts, such as Chief X Officers (CXOs), Vice Presidents (VPs), Directors, from business development, marketing, research and development teams, and related key executives from distributors; and key opinion leaders. Primary interviews were conducted to gather insights such as market statistics, data of revenue collected from the products and services, market breakdowns, market size estimations, market forecasting, and data triangulation. Primary research also helped in understanding the various trends related to types of gelatin, sources, application, function, and region. Stakeholders from the demand side, such as food and beverage companies, pharmaceuticals companies, cosmetics and personal care companies, and health care companies who are using gelatin were interviewed to understand the buyer’s perspective on the suppliers, products, and their current usage of gelatin and future outlook of their business which will affect the overall gelatin market

Gelatin Market Primary Research

To know about the assumptions considered for the study, download the pdf brochure

Company Name

Designation

Darling Ingredients (US)

General Manager

Tessenderlo Group (Belgium)

Sales Manager

Lapi Gelatine Spa (Italy)

Director

Gelita AG (Germany)

Individual Industry Expert

India Gelatine & Chemicals Limited (India)

Marketing Manager

Gelatin Market Size Estimation

Both the top-down and bottom-up approaches were used to estimate and validate the total size of the market. These approaches were also used extensively to determine the size of various subsegments in the market. The research methodology used to estimate the market size includes the following details:

  • The key players in the industry and the overall markets were identified through extensive secondary research.
  • The revenues of the major gelatin players were determined through primary and secondary research, which were used as the basis for market sizing and estimation.
  • All percentage shares, splits, and breakdowns were determined using secondary sources and verified through primary sources.
  • All macroeconomic and microeconomic factors affecting the growth of the the market were considered while estimating the market size.
  • All possible parameters that affect the market covered in this research study were accounted for, viewed in extensive detail, verified through primary research, and analyzed to obtain final quantitative and qualitative data

Global Gelatin Market: Bottom Up Approach

Gelatin Market Bottom Up Approach

To know about the assumptions considered for the study, Request for Free Sample Report

Global Gelatin Market: Top Down Approach

Gelatin Market Top Down Approach

Data Triangulation

After arriving at the overall size from the market size estimation process explained above, the total market was split into several segments and subsegments. The data triangulation and market breakdown procedures explained below were implemented, wherever applicable, to complete the overall market engineering process and arrive at the exact statistics for various market segments and subsegments. The data was triangulated by studying various factors and trends from the demand and supply sides. Along with this, the market size was validated using both the top-down and bottom-up approaches.

Gelatin Market Definition

Gelatin is derived from the partial hydrolysis of collagen. It is extracted from the skin and bones of different mammals such as pigs, cattle, fish, and poultry. According to The Gelatin Manufacturers Institute of America (GMIA), gelatin is “a product obtained from partial hydrolysis of collagen derived from natural sources such as skin, connective tissue, and bones of animals.” It is widely used in various applications such as food & beverages, pharmaceuticals, medical care, orthopedics, photography, paper manufacturing, printing, and in the chemical industry.


Gelatin Market Report Objectives

  • Determining and projecting the size of the market in terms of value with respect to type, source, application, function, and regional markets
  • Identifying the attractive opportunities in the market by determining the largest and fastest-growing segments across regions
  • Providing detailed information about the key factors influencing the market growth (drivers, restraints, opportunities, and industry-specific challenges)
  • Providing the regulatory framework for major countries related to the market.
  • Analyzing the micro markets with respect to individual growth trends, prospects, and their contribution to the total market
  • Identifying and profiling the key players in the market
  • Providing a comparative analysis of market leaders based on the following:
    • Product offerings
    • Business strategies
    • Strengths and weaknesses
    • Key financials
  • Understanding the competitive landscape and identifying the major growth strategies adopted by players across the key regions
  • Analyzing the value chain and products across the key regions and their impact on the prominent market players
  • Providing insights on key product innovations and investments in the gelatin market

Key Stakeholders

  • Manufacturers, importers & exporters, traders, distributors, and suppliers of gelatin
  • Trade associations and industry bodies
  • Research & development institutions
  • Food & beverage and pharmaceutical manufacturers, suppliers, and processors
  • Meat slaughtering companies
  • Distributors, importers, and exporters
  • Regulatory bodies & government agencies in gelatin market
  • Organizations such as the Food and Drug Administration (FDA), United States Department of Agriculture (USDA), European Food Safety Agency (EFSA), EUROPA, and Food Safety Australia and New Zealand (FSANZ), Gelatin Manufacturers Association Of Asia Pacific (GIMA), Gelatin Manufacturers Of Europe (GMA), South American Gelatin Manufacturers Association (GAGMA), and Gelatin Manufacturers Institute of America (GMA)
  • Intermediary suppliers
  • Universities and industry bodies
  • End users

Available Customizations:

With the given market data, MarketsandMarkets offers customizations according to company-specific scientific needs.

The following customization options are available for the report:

Product Analysis

Product Matrix, which gives a detailed comparison of the product portfolio of each company

Geographic Analysis of gelatin market

With the given market data, MarketsandMarkets offers customizations according to company-specific scientific needs.

  • Further breakdown of the Rest of Europe into the Netherlands, Poland, Belgium, Sweden, and other EU & non-EU countries
  • Further breakdown of the Rest of Asia Pacific into Taiwan, Indonesia, Malaysia, Thailand, the Philippines, Bangladesh, Singapore, and Vietnam.

Company Information

  • Detailed analyses and profiling of additional market players (up to five)
Custom Market Research Services

We will customize the research for you, in case the report listed above does not meet with your exact requirements. Our custom research will comprehensively cover the business information you require to help you arrive at strategic and profitable business decisions.

Request Customization

Instant Answers with GPT - Ask Now!

Ask real questions. Get complete answers !
Report Code
FB 6909
Published ON
Mar, 2023
Choose License Type
BUY NOW
  • SHARE
X
Request Customization
Speak to Analyst
Speak to Analyst
OR FACE-TO-FACE MEETING
PERSONALIZE THIS RESEARCH
  • Triangulate with your Own Data
  • Get Data as per your Format and Definition
  • Gain a Deeper Dive on a Specific Application, Geography, Customer or Competitor
  • Any level of Personalization
REQUEST A FREE CUSTOMIZATION
LET US HELP YOU!
  • What are the Known and Unknown Adjacencies Impacting the Gelatin Market
  • What will your New Revenue Sources be?
  • Who will be your Top Customer; what will make them switch?
  • Defend your Market Share or Win Competitors
  • Get a Scorecard for Target Partners
CUSTOMIZED WORKSHOP REQUEST
+1-888-600-6441
  • Call Us
  • +1-888-600-6441 (Corporate office hours)
  • +1-888-600-6441 (US/Can toll free)
  • +44-800-368-9399 (UK office hours)
CONNECT WITH US
ABOUT TRUST ONLINE
©2024 MarketsandMarkets Research Private Ltd. All rights reserved
DMCA.com Protection Status Website Feedback