Collagen and Gelatin Market by Source (Bovine, Porcine, Marine), Application (Wound Care, Orthopedic, Cardiovascular Disease, Dental, Surgical, Dural), End User (Hospitals, Surgical Centers) and Region - Global Forecast to 2026
The global collagen and gelatin market in terms of revenue was estimated to be worth $772 million in 2021 and is poised to reach $1,083 million by 2026, growing at a CAGR of 7.0% from 2021 to 2026. Major factors attributing to the growth of the market are rising burdern of cancer, diabetes and chronic wounds, especially among geriatric population along with rising number of surgical procedures.
To know about the assumptions considered for the study, Request for Free Sample Report
Collagen And Gelatin Market Dynamics
Drivers: Growing incidence of diabetes, cancer, and chronic wounds
In case of diabetes patients, there is high risk of infections, surgical wounds, leg or foot ulcers. This in trun is reponsble for the increase in medical expenses. According to the National Centre for Biological Information, in the US, around 15 to 25% of patients with diabetes mellitus are likely develop a diabetic foot ulcer (DFU) during their lifetime. The prevalence of DFU is expected to increase among these patient, which, in turn, is driving the demand for grafts and matrices. Hence, increase in number of diabetic population is expected to fuel the growth of the market during the forecasted period.
Restraints: Availability of alternative biomaterials
In recent years, a numer of alternatives to collagen & gelatin such as chitosan, alginate, cellulose, hyaluronic acid, polylactic acid (PLA), polyglycolic acid (PGA), and poly(lactic-co-glycolic acid) (PLGA) are being used in regenerative medicine. Use of these alternatives is expected to restraint the growth of collagen & gelatin market.
Opportunities: Implementation of the 21st Century Cures Act
In the US, the 21st Century Cures Act was signed into law in December 2016. A new Regenerative Medicine Advanced Therapy designation was established under this act. This also included introduction of pathways for fast-track approval of regenerative medicine. This led to an increase in R&D efforts by companies to develop new regenerative medicine products.
The orthopedic segment dominated the collagen and gelatin market in 2020
On the basis on application, the global collagen market is segmented into orthopedic, wound care, dental, surgical, cardiovascular, and other applications while the global gelatin market is segmented into orthopedic, wound care and others. In 2020, the orthopedic segment accounted for the largest share of the collagen market and the gelatin market in 2020. The largest share of the orthopedic segment is attributed to high demand for biomaterials and scaffolds for bone substitutes in orthopedics.
The hospitals segment accounted for the largest share in 2020
Based on end users, the collagen and gelatin market is segmented into hospitals and surgical centers. In 2020, the hospitals segment accounted for the largest share of the market and is projected to continue its dominance during the forecast period. Hospital are well equipped with highly advanced equipment and facilities, coupled with skilled healthcare professionals.
To know about the assumptions considered for the study, download the pdf brochure
North America was the largest regional market for collagen and gelatin in 2020.
Based on region, the collagen and gelatin markets is segmented into North America, Europe, Asia Pacific, and Rest of the World (ROW). In 2020, North America accounted for the largest share of the collagen and gelatin market, driven by increasing R&D expernditure in regenerative medicine, well-established healthcare infrastructure, and presence of prominent market players. Additionally, high incidence of periodontitis in the US is projected to offer growth opportunities in the collagen market as increasing use of collagen for tissue regeneration procedures in periodontal defects and oral surgical procedures. Asia Pacific is expected to grow at a highest CAGR during the forecast period owing to increase in diabetic population, especially in India and China.
Collagen and Gelatin Market Key Players
Major players operating in this market are Integra LifeSciences (US), Royal DSM (Netherlands), CollPlant Biotechnologies (Israel), Nitta Gelatin Inc. (Japan), Collagen Solutions plc (UK), Collagen Matrix, Inc. (US), Symatese (France), GELITA AG (Germany), PB Leiner (Belgium), Smith & Nephew (UK), Zimmer Biomet (US).
Collagen and Gelatin Market Report Scope
Report Metric |
Details |
Market Revenue in 2021 |
$772 million |
Estimated Value by 2026 |
$1083 million |
Growth Rate |
Poised to grow at a CAGR of 7.0% |
Largest Share Segments |
Orthopedic segment and Hospital segment |
Market Report Segmentation |
Source, Application, End user and Region |
Growth Drivers |
|
Growth Opportunities |
|
Geographies covered |
North America, Europe, APAC, MEA, and Latin America |
This report categorizes the global collagen and gelatin market into the following segments and subsegments:
By Source
- Bovine
- Porcine
- Other sources
By Application
- Orthopedic
- Wound Care
- Dental
- Surgical
- Cardiovascular Disease
- Others
By Application
- Orthopedic
- Wound Care
- Other Applications
By End Users
- Hospitals
- Surgical Centers
By Region
-
North America
- US
- Canada
-
Europe
- Germany
- France
- UK
- Rest of Europe (RoE)
-
Asia Pacific (APAC)
- Japan
- China
- India
- Rest of Asia Pacific (RoAPAC)
-
Rest of the World (RoW)
- Latin America
- MEA
Recent Developments:
- In January 2021, Integra LifeSciences completed the acquisition of ACell. This acquisition enabled the company to provide more comprehensive complex wound management solutions.
- In September 2020, DSM partnered with PBC BioMed to develop regenerative bone adhesives for safer, more cost-effective surgical procedures.
Frequently Asked Questions (FAQs):
What is the size of Collagen and Gelatin Market?
The global collagen and gelatin market boasts a total value of $772 million in 2021 and is projected to register a growth rate of 7.0% to reach a value of $1,083 million by 2026.
What are the major growth factors of Collagen and Gelatin Market?
Major factors attributing to the growth of the market are rising burdern of cancer, diabetes and chronic wounds, especially among geriatric population along with rising number of surgical procedures.
Who all are the prominent players of Collagen and Gelatin Market?
Major players operating in this market are Integra LifeSciences (US), Royal DSM (Netherlands), CollPlant Biotechnologies (Israel), Nitta Gelatin Inc. (Japan), Collagen Solutions plc (UK), Collagen Matrix, Inc. (US), Symatese (France), GELITA AG (Germany), PB Leiner (Belgium), Smith & Nephew (UK), Zimmer Biomet (US).
To speak to our analyst for a discussion on the above findings, click Speak to Analyst
TABLE OF CONTENTS
1 INTRODUCTION (Page No. - 29)
1.1 OBJECTIVES OF THE STUDY
1.2 MARKET DEFINITION
1.2.1 INCLUSIONS & EXCLUSIONS
TABLE 1 COLLAGEN AND GELATIN MARKET: INCLUSIONS & EXCLUSIONS
1.3 MARKET SCOPE
1.3.1 MARKETS COVERED
FIGURE 1 COLLAGEN AND GELATIN MARKET SEGMENTATION
1.3.2 YEARS CONSIDERED FOR THE STUDY
FIGURE 2 YEARS CONSIDERED FOR THE STUDY
1.4 CURRENCY
1.5 LIMITATIONS
1.6 STAKEHOLDERS
1.7 SUMMARY OF CHANGES
2 RESEARCH METHODOLOGY (Page No. - 34)
2.1 RESEARCH APPROACH
FIGURE 3 RESEARCH DESIGN
2.1.1 SECONDARY DATA
2.1.2 PRIMARY DATA
FIGURE 4 BREAKDOWN OF PRIMARIES: COLLAGEN AND GELATIN MARKET
2.1.3 MARKET DATA ESTIMATION & TRIANGULATION
FIGURE 5 DATA TRIANGULATION METHODOLOGY
2.2 MARKET ESTIMATION METHODOLOGY
FIGURE 6 MARKET SIZE ESTIMATION APPROACH: TOP-DOWN
FIGURE 7 COLLAGEN AND GELATIN MARKET: FINAL MARKET SIZE (USD MILLION)
2.3 GROWTH RATE ASSUMPTIONS/GROWTH FORECAST
FIGURE 8 GROWTH RATE ASSUMPTION BASED ON MARKET DYNAMICS
FIGURE 9 FINAL CAGR PROJECTIONS (2021−2026)
2.4 INSIGHTS FROM PRIMARIES
FIGURE 10 MARKET VALIDATION FROM PRIMARY EXPERTS
2.5 RESEARCH ASSUMPTIONS
2.6 RISK ASSESSMENT
TABLE 2 RISK ASSESSMENT
3 EXECUTIVE SUMMARY (Page No. - 42)
FIGURE 11 COLLAGEN AND GELATIN MARKET SHARE, BY SOURCE, 2020 VS. 2026
FIGURE 12 COLLAGEN MARKET SHARE, BY APPLICATION, 2020
FIGURE 13 GELATIN MARKET SHARE, BY APPLICATION, 2020
FIGURE 14 COLLAGEN AND GELATIN MARKET SHARE, BY END USER, 2020
FIGURE 15 GEOGRAPHICAL SNAPSHOT OF THE COLLAGEN AND GELATIN MARKET
4 PREMIUM INSIGHTS (Page No. - 46)
4.1 COLLAGEN AND GELATIN MARKET OVERVIEW
FIGURE 16 GROWING INCIDENCE OF DIABETES, CANCER, AND CHRONIC WOUNDS TO DRIVE MARKET GROWTH
4.2 NORTH AMERICA: COLLAGEN AND GELATIN MARKET SHARE, BY SOURCE & COUNTRY (2020)
FIGURE 17 BOVINE ACCOUNTED FOR THE LARGEST SHARE OF THE NORTH AMERICAN COLLAGEN AND GELATIN MARKET IN 2020
4.3 COLLAGEN MARKET SHARE, BY APPLICATION (2020)
FIGURE 18 ORTHOPEDIC HELD THE DOMINANT SHARE OF THE MARKET IN 2020
4.4 GELATIN MARKET SHARE, BY APPLICATION (2020)
FIGURE 19 THE ORTHOPEDIC SEGMENT ACCOUNTED FOR THE LARGEST SHARE OF THE MARKET IN 2020
4.5 COLLAGEN: GEOGRAPHIC GROWTH OPPORTUNITIES
FIGURE 20 EUROPE TO REGISTER THE HIGHEST GROWTH IN THE COLLAGEN MARKET DURING THE FORECAST PERIOD
4.6 GELATIN: GEOGRAPHIC GROWTH OPPORTUNITIES
FIGURE 21 ASIA PACIFIC TO REGISTER THE HIGHEST GROWTH IN THE GELATIN MARKET DURING THE FORECAST PERIOD
5 MARKET OVERVIEW (Page No. - 51)
5.1 INTRODUCTION
5.2 MARKET DYNAMICS
FIGURE 22 COLLAGEN AND GELATIN MARKET: DRIVERS, RESTRAINTS, AND OPPORTUNITIES
5.2.1 IMPACT ANALYSIS
TABLE 3 COLLAGEN AND GELATIN MARKET: IMPACT ANALYSIS OF DRIVERS, RESTRAINTS, AND OPPORTUNITIES
5.2.2 DRIVERS
5.2.2.1 Growing incidence of diabetes, cancer, and chronic wounds
5.2.2.2 Rising funding and investments for R&D
5.2.2.3 Growing number of surgical procedures
TABLE 4 PERCENTAGE INCREASE IN THE NUMBER OF SURGERIES PERFORMED IN THE US
5.2.3 RESTRAINTS
5.2.3.1 Availability of alternative biomaterials
5.2.4 OPPORTUNITIES
5.2.4.1 Implementation of the 21st Century Cures Act
5.3 RANGES/SCENARIOS
FIGURE 23 DEPENDING ON HOW THE UNCERTAINTIES UNFOLD, WE SEE A SPECTRUM OF SCENARIOS FOR THE COLLAGEN AND GELATIN MARKET – 2026
5.4 IMPACT OF THE COVID-19 PANDEMIC ON THE COLLAGEN AND GELATIN MARKET
FIGURE 24 PRE-COVID-19 VS POST-COVID-19 SCENARIO
5.5 YC–YCC SHIFT
FIGURE 25 YC–YCC SHIFT FOR THE COLLAGEN AND GELATIN
5.6 VALUE CHAIN ANALYSIS
FIGURE 26 VALUE CHAIN OF THE COLLAGEN AND GELATIN MARKET
5.7 SUPPLY CHAIN
FIGURE 27 SUPPLY CHAIN OF COLLAGEN AND GELATIN MARKET
5.8 ECOSYSTEM ANALYSIS
5.9 TECHNOLOGY ANALYSIS
5.10 PORTER’S FIVE FORCES ANALYSIS
TABLE 5 PORTER’S FIVE FORCES ANALYSIS OF THE COLLAGEN & GELATIN MARKET
5.10.1 THREAT FROM NEW ENTRANTS
5.10.2 THREAT OF SUBSTITUTES
5.10.3 BARGAINING POWER OF SUPPLIERS
5.10.4 BARGAINING POWER OF BUYERS
5.10.5 INTENSITY OF COMPETITION RIVALRY
5.11 REGULATORY ANALYSIS
5.12 PATENT ANALYSIS
FIGURE 28 PATENT GRANTED FOR COLLAGEN AND GELATIN IN THE LAST 10 YEARS
TABLE 6 INDICATIVE LIST OF PATENTS IN THE COLLAGEN AND GELATIN MARKET
6 COLLAGEN AND GELATIN MARKET, BY SOURCE (Page No. - 70)
6.1 INTRODUCTION
TABLE 7 COLLAGEN MARKET, BY SOURCE, 2019–2026 (USD MILLION)
TABLE 8 GELATIN MARKET, BY SOURCE, 2019–2026 (USD MILLION)
6.2 BOVINE COLLAGEN & GELATIN
6.2.1 RISING USAGE IN TISSUE ENGINEERING APPLICATIONS DRIVES MARKET GROWTH
TABLE 9 BOVINE COLLAGEN MARKET, BY REGION, 2019–2026 (USD MILLION)
TABLE 10 NORTH AMERICA: BOVINE COLLAGEN MARKET, BY COUNTRY, 2019–2026 (USD MILLION)
TABLE 11 EUROPE: BOVINE COLLAGEN MARKET, BY COUNTRY, 2019–2026 (USD MILLION)
TABLE 12 APAC: BOVINE COLLAGEN MARKET, BY COUNTRY, 2019–2026 (USD MILLION)
TABLE 13 BOVINE GELATIN MARKET, BY REGION, 2019–2026 (USD MILLION)
TABLE 14 NORTH AMERICA: BOVINE GELATIN MARKET, BY COUNTRY, 2019–2026 (USD MILLION)
TABLE 15 EUROPE: BOVINE GELATIN MARKET, BY COUNTRY, 2019–2026 (USD MILLION)
TABLE 16 APAC: BOVINE GELATIN MARKET, BY COUNTRY, 2019–2026 (USD MILLION)
6.3 PORCINE COLLAGEN & GELATIN
6.3.1 PORCINE COLLAGEN & GELATIN SEEING WIDE USAGE OWING TO LOW ALLERGIC RESPONSE AND BIOCOMPATIBILITY
TABLE 17 PORCINE COLLAGEN MARKET, BY REGION, 2019–2026 (USD MILLION)
TABLE 18 NORTH AMERICA: PORCINE COLLAGEN MARKET, BY COUNTRY, 2019–2026 (USD MILLION)
TABLE 19 EUROPE: PORCINE COLLAGEN MARKET, BY COUNTRY, 2019–2026 (USD MILLION)
TABLE 20 APAC: PORCINE COLLAGEN MARKET, BY COUNTRY, 2019–2026 (USD MILLION)
TABLE 21 PORCINE GELATIN MARKET, BY REGION, 2019–2026 (USD MILLION)
TABLE 22 NORTH AMERICA: PORCINE GELATIN MARKET, BY COUNTRY, 2019–2026 (USD MILLION)
TABLE 23 EUROPE: PORCINE GELATIN MARKET, BY COUNTRY, 2019–2026 (USD MILLION)
TABLE 24 APAC: PORCINE GELATIN MARKET, BY COUNTRY, 2019–2026 (USD MILLION)
6.4 OTHER COLLAGEN & GELATIN SOURCES
TABLE 25 OTHER COLLAGEN SOURCES MARKET, BY REGION, 2019–2026 (USD MILLION)
TABLE 26 NORTH AMERICA: OTHER COLLAGEN SOURCES MARKET, BY COUNTRY, 2019–2026 (USD MILLION)
TABLE 27 EUROPE: OTHER COLLAGEN SOURCES MARKET, BY COUNTRY, 2019–2026 (USD MILLION)
TABLE 28 APAC: OTHER COLLAGEN SOURCES MARKET, BY COUNTRY, 2019–2026 (USD MILLION)
TABLE 29 OTHER GELATIN SOURCES MARKET, BY REGION, 2019–2026 (USD MILLION)
TABLE 30 NORTH AMERICA: OTHER GELATIN SOURCES MARKET, BY COUNTRY, 2019–2026 (USD MILLION)
TABLE 31 EUROPE: OTHER GELATIN SOURCES MARKET, BY COUNTRY, 2019–2026 (USD MILLION)
TABLE 32 APAC: OTHER GELATIN SOURCES MARKET, BY COUNTRY, 2019–2026 (USD MILLION)
7 COLLAGEN MARKET, BY APPLICATION (Page No. - 82)
7.1 INTRODUCTION
TABLE 33 COLLAGEN MARKET, BY APPLICATION, 2019–2026 (USD MILLION)
7.2 ORTHOPEDIC APPLICATIONS
7.2.1 INCREASING USE OF COLLAGEN IN ORTHOPEDIC SURGERIES TO DRIVE GROWTH IN THIS MARKET SEGMENT
TABLE 34 COLLAGEN MARKET FOR ORTHOPEDIC APPLICATIONS, BY REGION, 2019–2026 (USD MILLION)
TABLE 35 NORTH AMERICA: COLLAGEN MARKET FOR ORTHOPEDIC APPLICATIONS, BY COUNTRY, 2019–2026 (USD MILLION)
TABLE 36 EUROPE: COLLAGEN MARKET FOR ORTHOPEDIC APPLICATIONS, BY COUNTRY, 2019–2026 (USD MILLION)
TABLE 37 APAC: COLLAGEN MARKET FOR ORTHOPEDIC APPLICATIONS, BY COUNTRY, 2019–2026 (USD MILLION)
7.3 WOUND CARE APPLICATIONS
7.3.1 RISING PREVALENCE OF CHRONIC CONDITIONS TO DRIVE THE GROWTH OF THIS SEGMENT
TABLE 38 COLLAGEN MARKET FOR WOUND CARE APPLICATIONS, BY REGION, 2019–2026 (USD MILLION)
TABLE 39 NORTH AMERICA: COLLAGEN MARKET FOR WOUND CARE APPLICATIONS, BY COUNTRY, 2019–2026 (USD MILLION)
TABLE 40 EUROPE: COLLAGEN MARKET FOR WOUND CARE APPLICATIONS, BY COUNTRY, 2019–2026 (USD MILLION)
TABLE 41 APAC: COLLAGEN MARKET FOR WOUND CARE APPLICATIONS, BY COUNTRY, 2019–2026 (USD MILLION)
7.4 DENTAL APPLICATIONS
7.4.1 RISING INCIDENCE OF ORAL DISORDERS TO DRIVE MARKET GROWTH
TABLE 42 COLLAGEN MARKET FOR DENTAL APPLICATIONS, BY REGION, 2019–2026 (USD MILLION)
TABLE 43 NORTH AMERICA: COLLAGEN MARKET FOR DENTAL APPLICATIONS, BY COUNTRY, 2019–2026 (USD MILLION)
TABLE 44 EUROPE: COLLAGEN MARKET FOR DENTAL APPLICATIONS, BY COUNTRY, 2019–2026 (USD MILLION)
TABLE 45 APAC: COLLAGEN MARKET FOR DENTAL APPLICATIONS, BY COUNTRY, 2019–2026 (USD MILLION)
7.5 SURGICAL APPLICATIONS
7.5.1 INCREASING NUMBER OF SURGICAL PROCEDURES ACROSS THE GLOBE TO BOOST THE DEMAND FOR COLLAGEN-BASED PRODUCTS
TABLE 46 COLLAGEN MARKET FOR SURGICAL APPLICATIONS, BY REGION, 2019–2026 (USD MILLION)
TABLE 47 NORTH AMERICA: COLLAGEN MARKET FOR SURGICAL APPLICATIONS, BY COUNTRY, 2019–2026 (USD MILLION)
TABLE 48 EUROPE: COLLAGEN MARKET FOR SURGICAL APPLICATIONS, BY COUNTRY, 2019–2026 (USD MILLION)
TABLE 49 APAC: COLLAGEN MARKET FOR SURGICAL APPLICATIONS, BY COUNTRY, 2019–2026 (USD MILLION)
7.6 CARDIOVASCULAR APPLICATIONS
7.6.1 APPLICATION OF COLLAGEN IN THE TREATMENT OF CVDS HAS GARNERED SIGNIFICANT INTEREST DUE TO A LACK OF EFFECTIVE THERAPIES
TABLE 50 COLLAGEN MARKET FOR CARDIOVASCULAR APPLICATIONS, BY REGION, 2019–2026 (USD MILLION)
TABLE 51 NORTH AMERICA: COLLAGEN MARKET FOR CARDIOVASCULAR APPLICATIONS, BY COUNTRY, 2019–2026 (USD MILLION)
TABLE 52 EUROPE: COLLAGEN MARKET FOR CARDIOVASCULAR APPLICATIONS, BY COUNTRY, 2019–2026 (USD MILLION)
TABLE 53 APAC: COLLAGEN MARKET FOR CARDIOVASCULAR APPLICATIONS, BY COUNTRY, 2019–2026 (USD MILLION)
7.7 OTHER APPLICATIONS
TABLE 54 COLLAGEN MARKET FOR OTHER APPLICATIONS, BY REGION, 2019–2026 (USD MILLION)
TABLE 55 NORTH AMERICA: COLLAGEN MARKET FOR OTHER APPLICATIONS, BY COUNTRY, 2019–2026 (USD MILLION)
TABLE 56 EUROPE: COLLAGEN MARKET FOR OTHER APPLICATIONS, BY COUNTRY, 2019–2026 (USD MILLION)
TABLE 57 APAC: COLLAGEN MARKET FOR OTHER APPLICATIONS, BY COUNTRY, 2019–2026 (USD MILLION)
8 GELATIN MARKET, BY APPLICATION (Page No. - 96)
8.1 INTRODUCTION
TABLE 58 GELATIN MARKET, BY APPLICATION, 2019–2026 (USD MILLION)
8.2 ORTHOPEDIC APPLICATIONS
8.2.1 INTRODUCTION OF NOVEL THERAPIES USING GELATIN FOR REGENERATING BONE AND CARTILAGE TO DRIVE THE DEMAND FOR GELATIN IN THIS APPLICATION SEGMENT
TABLE 59 GELATIN MARKET FOR ORTHOPEDIC APPLICATIONS, BY REGION, 2019–2026 (USD MILLION)
TABLE 60 NORTH AMERICA: GELATIN MARKET FOR ORTHOPEDIC APPLICATIONS, BY COUNTRY, 2019–2026 (USD MILLION)
TABLE 61 EUROPE: GELATIN MARKET FOR ORTHOPEDIC APPLICATIONS, BY COUNTRY, 2019–2026 (USD MILLION)
TABLE 62 APAC: GELATIN MARKET FOR ORTHOPEDIC APPLICATIONS, BY COUNTRY, 2019–2026 (USD MILLION)
8.3 WOUND CARE APPLICATIONS
8.3.1 APPLICATION OF GELATIN HYDROGELS IN THE TREATMENT OF BURNS TO DRIVE MARKET GROWTH
TABLE 63 GELATIN MARKET FOR WOUND CARE APPLICATIONS, BY REGION, 2019–2026 (USD MILLION)
TABLE 64 NORTH AMERICA: GELATIN MARKET FOR WOUND CARE APPLICATIONS, BY COUNTRY, 2019–2026 (USD MILLION)
TABLE 65 EUROPE: GELATIN MARKET FOR WOUND CARE APPLICATIONS, BY COUNTRY, 2019–2026 (USD MILLION)
TABLE 66 APAC: GELATIN MARKET FOR WOUND CARE APPLICATIONS, BY COUNTRY, 2019–2026 (USD MILLION)
8.4 OTHER APPLICATIONS
TABLE 67 GELATIN MARKET FOR OTHER APPLICATIONS, BY REGION, 2019–2026 (USD MILLION)
TABLE 68 NORTH AMERICA: GELATIN MARKET FOR OTHER APPLICATIONS, BY COUNTRY, 2019–2026 (USD MILLION)
TABLE 69 EUROPE: GELATIN MARKET FOR OTHER APPLICATIONS, BY COUNTRY, 2019–2026 (USD MILLION)
TABLE 70 APAC: GELATIN MARKET FOR OTHER APPLICATIONS, BY COUNTRY, 2019–2026 (USD MILLION)
9 COLLAGEN AND GELATIN MARKET, BY END USER (Page No. - 103)
9.1 INTRODUCTION
TABLE 71 COLLAGEN MARKET, BY END USER, 2019–2026 (USD MILLION)
TABLE 72 GELATIN MARKET, BY END USER, 2019–2026 (USD MILLION)
9.2 HOSPITALS
9.2.1 HOSPITALS ARE THE LARGEST END USERS OF BIOSURGERY PRODUCTS—A KEY FACTOR DRIVING MARKET GROWTH
TABLE 73 COLLAGEN MARKET FOR HOSPITALS, BY REGION, 2019–2026 (USD MILLION)
TABLE 74 NORTH AMERICA: COLLAGEN MARKET FOR HOSPITALS, BY COUNTRY, 2019–2026 (USD MILLION)
TABLE 75 EUROPE: COLLAGEN AND GELATIN MARKET FOR HOSPITALS, BY COUNTRY, 2019–2026 (USD MILLION)
TABLE 76 APAC: COLLAGEN MARKET FOR HOSPITALS, BY COUNTRY, 2019–2026 (USD MILLION)
TABLE 77 GELATIN MARKET FOR HOSPITALS, BY REGION, 2019–2026 (USD MILLION)
TABLE 78 NORTH AMERICA: COLLAGEN AND GELATIN MARKET FOR HOSPITALS, BY COUNTRY, 2019–2026 (USD MILLION)
TABLE 79 EUROPE: GELATIN MARKET FOR HOSPITALS, BY COUNTRY, 2019–2026 (USD MILLION)
TABLE 80 APAC: GELATIN MARKET FOR HOSPITALS, BY COUNTRY, 2019–2026 (USD MILLION)
9.3 SURGICAL CENTERS
9.3.1 SURGICAL CENTERS HAVE EMERGED AS A SIGNIFICANT END USER DUE TO THEIR ABILITY TO IMPROVE QUALITY AND CUSTOMER SERVICE WHILE SIMULTANEOUSLY REDUCING COSTS
TABLE 81 COLLAGEN AND GELATIN MARKET FOR SURGICAL CENTERS, BY REGION, 2019–2026 (USD MILLION)
TABLE 82 NORTH AMERICA: COLLAGEN MARKET FOR SURGICAL CENTERS, BY COUNTRY, 2019–2026 (USD MILLION)
TABLE 83 EUROPE: COLLAGEN MARKET FOR SURGICAL CENTERS, BY COUNTRY, 2019–2026 (USD MILLION)
TABLE 84 APAC: COLLAGEN MARKET FOR SURGICAL CENTERS, BY COUNTRY, 2019–2026 (USD MILLION)
TABLE 85 GELATIN MARKET FOR SURGICAL CENTERS, BY REGION, 2019–2026 (USD MILLION)
TABLE 86 NORTH AMERICA: GELATIN MARKET FOR SURGICAL CENTERS, BY COUNTRY, 2019–2026 (USD MILLION)
TABLE 87 EUROPE: COLLAGEN AND GELATIN MARKET FOR SURGICAL CENTERS, BY COUNTRY, 2019–2026 (USD MILLION)
TABLE 88 APAC: GELATIN MARKET FOR SURGICAL CENTERS, BY COUNTRY, 2019–2026 (USD MILLION)
10 COLLAGEN AND GELATIN MARKET, BY REGION (Page No. - 112)
10.1 INTRODUCTION
FIGURE 29 COLLAGEN MARKET: REGIONAL SNAPSHOT (2021 VS. 2026)
FIGURE 30 GELATIN MARKET: REGIONAL SNAPSHOT (2021 VS. 2026)
TABLE 89 COLLAGEN MARKET, BY REGION, 2019–2026 (USD MILLION)
TABLE 90 GELATIN MARKET, BY REGION, 2019–2026 (USD MILLION)
10.2 NORTH AMERICA
FIGURE 31 NORTH AMERICA: COLLAGEN AND GELATIN MARKET SNAPSHOT
TABLE 91 NORTH AMERICA: COLLAGEN MARKET, BY COUNTRY, 2019–2026 (USD MILLION)
TABLE 92 NORTH AMERICA: COLLAGEN MARKET, BY SOURCE, 2019–2026 (USD MILLION)
TABLE 93 NORTH AMERICA: COLLAGEN MARKET, BY APPLICATION, 2019–2026 (USD MILLION)
TABLE 94 NORTH AMERICA: COLLAGEN MARKET, BY END USER, 2019–2026 (USD MILLION)
FIGURE 32 NORTH AMERICA: GELATIN MARKET SNAPSHOT
TABLE 95 NORTH AMERICA: GELATIN MARKET, BY COUNTRY, 2019–2026 (USD MILLION)
TABLE 96 NORTH AMERICA: GELATIN MARKET, BY SOURCE, 2019–2026 (USD MILLION)
TABLE 97 NORTH AMERICA: GELATIN MARKET, BY APPLICATION, 2019–2026 (USD MILLION)
TABLE 98 NORTH AMERICA: GELATIN MARKET, BY END USER, 2019–2026 (USD MILLION)
10.2.1 US
10.2.1.1 Increasing incidence of periodontitis and burn injuries to boost market growth in the US
TABLE 99 US: COLLAGEN AND GELATIN MARKET, BY SOURCE, 2019–2026 (USD MILLION)
TABLE 100 US: COLLAGEN MARKET, BY APPLICATION, 2019–2026 (USD MILLION)
TABLE 101 US: COLLAGEN MARKET, BY END USER, 2019–2026 (USD MILLION)
TABLE 102 US: GELATIN MARKET, BY SOURCE, 2019–2026 (USD MILLION)
10.2.2 CANADA
10.2.2.1 Growing geriatric population and increasing volume of surgeries to drive the demand for collagen and gelatin products in Canada
TABLE 103 CANADA: COLLAGEN AND GELATIN MARKET, BY SOURCE, 2019–2026 (USD MILLION)
TABLE 104 CANADA: COLLAGEN MARKET, BY APPLICATION, 2019–2026 (USD MILLION)
TABLE 105 CANADA: COLLAGEN MARKET, BY END USER, 2019–2026 (USD MILLION)
TABLE 106 CANADA: GELATIN MARKET, BY SOURCE, 2019–2026 (USD MILLION)
TABLE 107 CANADA: GELATIN MARKET, BY APPLICATION, 2019–2026 (USD MILLION)
TABLE 108 CANADA: GELATIN MARKET, BY END USER, 2019–2026 (USD MILLION)
10.3 EUROPE
TABLE 109 EUROPE: COLLAGEN AND GELATIN MARKET, BY COUNTRY, 2019–2026 (USD MILLION)
TABLE 110 EUROPE: COLLAGEN MARKET, BY SOURCE, 2019–2026 (USD MILLION)
TABLE 111 EUROPE: COLLAGEN MARKET, BY APPLICATION, 2019–2026 (USD MILLION)
TABLE 112 EUROPE: COLLAGEN MARKET, BY END USER, 2019–2026 (USD MILLION)
TABLE 113 EUROPE: GELATIN MARKET, BY COUNTRY, 2019–2026 (USD MILLION)
TABLE 114 EUROPE: GELATIN MARKET, BY SOURCE, 2019–2026 (USD MILLION)
TABLE 115 EUROPE: GELATIN MARKET, BY APPLICATION, 2019–2026 (USD MILLION)
TABLE 116 EUROPE: GELATIN MARKET, BY END USER, 2019–2026 (USD MILLION)
10.3.1 GERMANY
10.3.1.1 Increase in healthcare expenditure to support the adoption of collagen and gelatin products
TABLE 117 GERMANY: COLLAGEN AND GELATIN MARKET, BY SOURCE, 2019–2026 (USD MILLION)
TABLE 118 GERMANY: COLLAGEN MARKET, BY APPLICATION, 2019–2026 (USD MILLION)
TABLE 119 GERMANY: COLLAGEN MARKET, BY END USER, 2019–2026 (USD MILLION)
TABLE 120 GERMANY: GELATIN MARKET, BY SOURCE, 2019–2026 (USD MILLION)
TABLE 121 GERMANY: GELATIN MARKET, BY APPLICATION, 2019–2026 (USD MILLION)
TABLE 122 GERMANY: GELATIN MARKET, BY END USER, 2019–2026 (USD MILLION)
10.3.2 UK
10.3.2.1 Increasing incidence of chronic wounds and growing focus on R&D to drive market growth in the UK
TABLE 123 UK: COLLAGEN AND GELATIN MARKET, BY SOURCE, 2019–2026 (USD MILLION)
TABLE 124 UK: COLLAGEN MARKET, BY APPLICATION, 2019–2026 (USD MILLION)
TABLE 125 UK: COLLAGEN MARKET, BY END USER, 2019–2026 (USD MILLION)
TABLE 126 UK: GELATIN MARKET, BY SOURCE, 2019–2026 (USD MILLION)
TABLE 127 UK: GELATIN MARKET, BY APPLICATION, 2019–2026 (USD MILLION)
TABLE 128 UK: GELATIN MARKET, BY END USER, 2019–2026 (USD MILLION)
10.3.3 FRANCE
10.3.3.1 Presence of a well-established healthcare system and growing geriatric population to boost market growth
TABLE 129 FRANCE: COLLAGEN AND GELATIN MARKET, BY SOURCE, 2019–2026 (USD MILLION)
TABLE 130 FRANCE: COLLAGEN MARKET, BY APPLICATION, 2019–2026 (USD MILLION)
TABLE 131 FRANCE: COLLAGEN MARKET, BY END USER, 2019–2026 (USD MILLION)
TABLE 132 FRANCE: GELATIN MARKET, BY SOURCE, 2019–2026 (USD MILLION)
TABLE 133 FRANCE: GELATIN MARKET, BY APPLICATION, 2019–2026 (USD MILLION)
TABLE 134 FRANCE: GELATIN MARKET, BY END USER, 2019–2026 (USD MILLION)
10.3.4 REST OF EUROPE
TABLE 135 ROE: COLLAGEN AND GELATIN MARKET, BY SOURCE, 2019–2026 (USD MILLION)
TABLE 136 ROE: COLLAGEN MARKET, BY APPLICATION, 2019–2026 (USD MILLION)
TABLE 137 ROE: COLLAGEN MARKET, BY END USER, 2019–2026 (USD MILLION)
TABLE 138 ROE: GELATIN MARKET, BY SOURCE, 2019–2026 (USD MILLION)
TABLE 139 ROE: GELATIN MARKET, BY APPLICATION, 2019–2026 (USD MILLION)
TABLE 140 ROE: GELATIN MARKET, BY END USER, 2019–2026 (USD MILLION)
10.4 ASIA PACIFIC
FIGURE 33 ASIA PACIFIC: COLLAGEN AND GELATIN MARKET SNAPSHOT
TABLE 141 ASIA PACIFIC: COLLAGEN MARKET, BY COUNTRY, 2019–2026 (USD MILLION)
TABLE 142 ASIA PACIFIC: COLLAGEN MARKET, BY SOURCE, 2019–2026 (USD MILLION)
TABLE 143 ASIA PACIFIC: COLLAGEN MARKET, BY APPLICATION, 2019–2026 (USD MILLION)
TABLE 144 ASIA PACIFIC: COLLAGEN MARKET, BY END USER, 2019–2026 (USD MILLION)
FIGURE 34 ASIA PACIFIC: GELATIN MARKET SNAPSHOT
TABLE 145 ASIA PACIFIC: GELATIN MARKET, BY COUNTRY, 2019–2026 (USD MILLION)
TABLE 146 ASIA PACIFIC: GELATIN MARKET, BY SOURCE, 2019–2026 (USD MILLION)
TABLE 147 ASIA PACIFIC: GELATIN MARKET, BY APPLICATION, 2019–2026 (USD MILLION)
TABLE 148 ASIA PACIFIC: GELATIN MARKET, BY END USER, 2019–2026 (USD MILLION)
10.4.1 JAPAN
10.4.1.1 Strong healthcare system and rising geriatric population to support market growth in Japan
TABLE 149 JAPAN: COLLAGEN AND GELATIN MARKET, BY SOURCE, 2019–2026 (USD MILLION)
TABLE 150 JAPAN: COLLAGEN MARKET, BY APPLICATION, 2019–2026 (USD MILLION)
TABLE 151 JAPAN: COLLAGEN MARKET, BY END USER, 2019–2026 (USD MILLION)
TABLE 152 JAPAN: GELATIN MARKET, BY SOURCE, 2019–2026 (USD MILLION)
TABLE 153 JAPAN: GELATIN MARKET, BY APPLICATION, 2019–2026 (USD MILLION)
TABLE 154 JAPAN: GELATIN MARKET, BY END USER, 2019–2026 (USD MILLION)
10.4.2 CHINA
10.4.2.1 Growing number of hospitals stimulating the growth of the market
TABLE 155 CHINA: COLLAGEN AND GELATIN MARKET, BY SOURCE, 2019–2026 (USD MILLION)
TABLE 156 CHINA: COLLAGEN MARKET, BY APPLICATION, 2019–2026 (USD MILLION)
TABLE 157 CHINA: COLLAGEN MARKET, BY END USER, 2019–2026 (USD MILLION)
TABLE 158 CHINA: GELATIN MARKET, BY SOURCE, 2019–2026 (USD MILLION)
TABLE 159 CHINA: GELATIN MARKET, BY APPLICATION, 2019–2026 (USD MILLION)
TABLE 160 CHINA: GELATIN MARKET, BY END USER, 2019–2026 (USD MILLION)
10.4.3 INDIA
10.4.3.1 Rising healthcare awareness and favorable government support to stimulate market growth in India
TABLE 161 INDIA: COLLAGEN AND GELATIN MARKET, BY SOURCE, 2019–2026 (USD MILLION)
TABLE 162 INDIA: COLLAGEN MARKET, BY APPLICATION, 2019–2026 (USD MILLION)
TABLE 163 INDIA: COLLAGEN MARKET, BY END USER, 2019–2026 (USD MILLION)
TABLE 164 INDIA: GELATIN MARKET, BY SOURCE, 2019–2026 (USD MILLION)
TABLE 165 INDIA: GELATIN MARKET, BY APPLICATION, 2019–2026 (USD MILLION)
TABLE 166 INDIA: GELATIN MARKET, BY END USER, 2019–2026 (USD MILLION)
10.4.4 REST OF ASIA PACIFIC
TABLE 167 ROAPAC: COLLAGEN AND GELATIN MARKET, BY SOURCE, 2019–2026 (USD MILLION)
TABLE 168 ROAPAC: COLLAGEN MARKET, BY APPLICATION, 2019–2026 (USD MILLION)
TABLE 169 ROAPAC: COLLAGEN MARKET, BY END USER, 2019–2026 (USD MILLION)
TABLE 170 ROAPAC: GELATIN MARKET, BY SOURCE, 2019–2026 (USD MILLION)
TABLE 171 ROAPAC: GELATIN MARKET, BY APPLICATION, 2019–2026 (USD MILLION)
TABLE 172 ROAPAC: GELATIN MARKET, BY END USER, 2019–2026 (USD MILLION)
10.5 REST OF THE WORLD
TABLE 173 ROW: COLLAGEN AND GELATIN MARKET, BY REGION, 2019–2026 (USD MILLION)
TABLE 174 ROW: COLLAGEN MARKET, BY SOURCE, 2019–2026 (USD MILLION)
TABLE 175 ROW: COLLAGEN MARKET, BY APPLICATION, 2019–2026 (USD MILLION)
TABLE 176 ROW: COLLAGEN MARKET, BY END USER, 2019–2026 (USD MILLION)
TABLE 177 ROW: GELATIN MARKET, BY SOURCE, 2019–2026 (USD MILLION)
TABLE 178 ROW: GELATIN MARKET, BY APPLICATION, 2019–2026 (USD MILLION)
TABLE 179 ROW: GELATIN MARKET, BY END USER, 2019–2026 (USD MILLION)
10.6 LATIN AMERICA
10.6.1 INCREASING PREVALENCE OF DIABETES TO DRIVE MARKET GROWTH IN LATIN AMERICA
TABLE 180 LATIN AMERICA: COLLAGEN AND GELATIN MARKETMARKET, BY SOURCE, 2019–2026 (USD MILLION)
TABLE 181 LATIN AMERICA: COLLAGEN MARKET, BY APPLICATION, 2019–2026 (USD MILLION)
TABLE 182 LATIN AMERICA: COLLAGEN MARKET, BY END USER, 2019–2026 (USD MILLION)
10.7 MIDDLE EAST & AFRICA
10.7.1 HEALTHCARE INFRASTRUCTURE IMPROVEMENTS TO DRIVE MARKET GROWTH
TABLE 183 MEA: COLLAGEN MARKET, BY SOURCE, 2019–2026 (USD MILLION)
TABLE 184 MEA: COLLAGEN MARKET, BY END USER, 2019–2026 (USD MILLION)
11 COMPETITIVE LANDSCAPE (Page No. - 157)
11.1 INTRODUCTION
11.2 KEY STRATEGIES ADOPTED BY PLAYERS IN THE COLLAGEN AND GELATIN MARKET
11.3 REVENUE ANALYSIS
FIGURE 35 REVENUE ANALYSIS FOR THE KEY PLAYERS IN THE COLLAGEN AND GELATIN MARKET
11.4 MARKET RANKING
FIGURE 36 COLLAGEN AND GELATIN MARKET: MARKET RANKING OF KEY PLAYERS (2020)
11.5 COMPANY EVALUATION QUADRANT
11.5.1 STARS
11.5.2 EMERGING LEADERS
11.5.3 PERVASIVE PLAYERS
11.5.4 PARTICIPANTS
FIGURE 37 COLLAGEN AND GELATIN MARKET: COMPANY EVALUATION QUADRANT, 2020
11.6 COMPANY EVALUATION QUADRANT FOR START-UPS/SMES
11.6.1 PROGRESSIVE COMPANIES
11.6.2 STARTING BLOCKS
11.6.3 RESPONSIVE COMPANIES
11.6.4 DYNAMIC COMPANIES
FIGURE 38 COLLAGEN AND GELATIN MARKET: COMPANY EVALUATION QUADRANT FOR START-UPS/SMES, 2020
11.7 COMPETITIVE BENCHMARKING
11.7.1 COMPANY PRODUCT FOOTPRINT
11.7.2 COMPANY INDUSTRY FOOTPRINT
11.7.3 COMPANY REGIONAL FOOTPRINT
11.7.4 COMPANY APPLICATION FOOTPRINT
11.8 GROWTH STRATEGIES ADOPTED BY MAJOR AND EMERGING PLAYERS
11.8.1 COLLAGEN AND GELATIN MARKET: PRODUCT LAUNCHES (JANUARY 2018–JUNE 2021)
11.8.2 COLLAGEN AND GELATIN MARKET: KEY DEALS (JANUARY 2018–JUNE 2021)
11.8.3 COLLAGEN AND GELATIN MARKET: OTHER DEVELOPMENTS (JANUARY 2018–JUNE 2021)
12 COMPANY PROFILES (Page No. - 169)
12.1 KEY COMPANIES
(Business Overview, Products Offered, Recent Developments, MnM View)*
12.1.1 INTEGRA LIFESCIENCES
TABLE 185 INTEGRA LIFESCIENCES: BUSINESS OVERVIEW
FIGURE 39 INTEGRA LIFESCIENCES: COMPANY SNAPSHOT (2020)
TABLE 186 INTEGRA LIFESCIENCES: PRODUCT OFFERINGS
TABLE 187 INTEGRA LIFESCIENCES: DEALS
12.1.2 ROYAL DSM
TABLE 188 ROYAL DSM: BUSINESS OVERVIEW
FIGURE 40 ROYAL DSM: COMPANY SNAPSHOT (2020)
TABLE 189 ROYAL DSM: PRODUCT OFFERINGS
TABLE 190 ROYAL DSM: DEALS
12.1.3 COLLPLANT BIOTECHNOLOGIES LTD.
TABLE 191 COLLPLANT BIOTECHNOLOGIES LTD.: BUSINESS OVERVIEW
FIGURE 41 COLLPLANT BIOTECHNOLOGIES LTD.: COMPANY SNAPSHOT (2020)
TABLE 192 COLLPLANT BIOTECHNOLOGIES LTD.: PRODUCT OFFERINGS
TABLE 193 COLLPLANT BIOTECHNOLOGIES LTD.: DEALS
12.1.4 NITTA GELATIN INC.
TABLE 194 NITTA GELATIN INC.: BUSINESS OVERVIEW
FIGURE 42 NITTA GELATIN INC.: COMPANY SNAPSHOT (2020)
TABLE 195 NITTA GELATIN INC.: PRODUCT OFFERINGS
12.1.5 COLLAGEN SOLUTIONS PLC
TABLE 196 COLLAGEN SOLUTIONS PLC: BUSINESS OVERVIEW
FIGURE 43 COLLAGEN SOLUTIONS PLC: COMPANY SNAPSHOT (2020)
TABLE 197 COLLAGEN SOLUTIONS: PRODUCT OFFERINGS
12.1.6 COLLAGEN MATRIX, INC.
TABLE 198 COLLAGEN MATRIX, INC.: BUSINESS OVERVIEW
TABLE 199 COLLAGEN MATRIX, INC.: PRODUCT OFFERINGS
TABLE 200 COLLAGEN MATRIX, INC.: PRODUCT LAUNCHES
TABLE 201 COLLAGEN MATRIX, INC.: DEALS
TABLE 202 COLLAGEN MATRIX, INC.: OTHER DEVELOPMENTS
12.1.7 SYMATESE
TABLE 203 SYMATESE: BUSINESS OVERVIEW
TABLE 204 SYMATESE: PRODUCT OFFERINGS
12.1.8 GELITA AG
TABLE 205 GELITA AG: BUSINESS OVERVIEW
TABLE 206 GELITA AG: PRODUCT OFFERINGS
TABLE 207 GELITA AG: DEALS
12.1.9 PB LEINER
TABLE 208 PB LEINER: BUSINESS OVERVIEW
TABLE 209 PB LEINER: PRODUCT OFFERINGS
TABLE 210 PB LEINER: DEALS
12.1.10 SMITH & NEPHEW PLC
TABLE 211 SMITH & NEPHEW PLC: BUSINESS OVERVIEW
FIGURE 44 SMITH & NEPHEW PLC: COMPANY SNAPSHOT (2020)
TABLE 212 SMITH & NEPHEW PLC: PRODUCT OFFERINGS
12.1.11 ZIMMER BIOMET
TABLE 213 ZIMMER BIOMET: BUSINESS OVERVIEW
FIGURE 45 ZIMMER BIOMET: COMPANY SNAPSHOT (2020)
TABLE 214 ZIMMER BIOMET: PRODUCT OFFERINGS
12.1.12 JELLAGEN
TABLE 215 JELLAGEN: BUSINESS OVERVIEW
TABLE 216 JELLAGEN: PRODUCT OFFERINGS
12.2 OTHER PLAYERS
12.2.1 ADVANCED BIOMATRIX
TABLE 217 ADVANCED BIOMATRIX: COMPANY OVERVIEW
12.2.2 MATRICEL GMBH
TABLE 218 MATRICEL GMBH: COMPANY OVERVIEW
12.2.3 ROUSSELOT
TABLE 219 ROUSSELOT: COMPANY OVERVIEW
12.2.4 WEISHARDT
TABLE 220 WEISHARDT: COMPANY OVERVIEW
12.2.5 XIAMEN HYFINE GELATIN
TABLE 221 XIAMEN HYFINE GELATIN: COMPANY OVERVIEW
12.2.6 GEISTLICH PHARMA AG
TABLE 222 GEISTLICH PHARMA AG: COMPANY OVERVIEW
12.2.7 SYNERHEAL PHARMACEUTICALS
TABLE 223 SYNERHEAL PHARMACEUTICALS: COMPANY OVERVIEW
12.2.8 BIOREGEN TECHNOLOGIES
TABLE 224 BIOREGEN TECHNOLOGIES: COMPANY OVERVIEW
12.2.9 MERIL LIFE SCIENCES PVT. LTD.
TABLE 225 MERIL LIFE SCIENCES PVT. LTD.: COMPANY OVERVIEW
12.2.10 MEDSKIN SOLUTIONS DR. SUWELACK
TABLE 226 MEDSKIN SOLUTIONS DR. SUWELACK: COMPANY OVERVIEW
12.2.11 COLOGENESIS HEALTHCARE PVT. LTD.
TABLE 227 COLOGENESIS HEALTHCARE PVT. LTD.: COMPANY OVERVIEW
12.2.12 DERMARITE INDUSTRIES, LLC
TABLE 228 DERMARITE INDUSTRIES, LLC: COMPANY OVERVIEW
12.2.13 EUCARE PHARMACEUTICALS PRIVATE LIMITED
TABLE 229 EUCARE PHARMACEUTICALS PRIVATE LIMITED: COMPANY OVERVIEW
*Business Overview, Products Offered, Recent Developments, MnM View might not be captured in case of unlisted companies.
13 APPENDIX (Page No. - 202)
13.1 DISCUSSION GUIDE
13.2 KNOWLEDGE STORE: MARKETSANDMARKETS’ SUBSCRIPTION PORTAL
13.3 AVAILABLE CUSTOMIZATIONS
13.4 RELATED REPORTS
13.5 AUTHOR DETAILS
This study involved four major activities in estimating the current size of the collagen and gelatin market. Exhaustive secondary research was carried out to collect information on the market, its peer markets, and its parent market. The next step was to validate these findings, assumptions, and sizing with industry experts across the value chain through primary research. Both top-down and bottom-up approaches were employed to estimate the complete market size. After that, market breakdown and data triangulation procedures were used to estimate the market size of segments and subsegments.
Secondary Research
Secondary research was used mainly to identify and collect information for the extensive, technical, market-oriented, and commercial study of the collagen and gelatin market. Some of the key secondary sources referred to for this study include publications from government sources World Health Organization (WHO), US Food and Drug Administration (FDA), National Institutes of Health (NIH), National Center for Biotechnology Information (NCBI), Organisation for Economic Co-operation and Development (OECD), American Diabetes Association (ADA), Academy of Physicians in Wound Healing (APWH), American Academy and Board of Regenerative Medicine, Canadian Association for Research in Regenerative Medicine. These sources were also used to obtain key information about major players, market classification, and segmentation according to industry trends, regional/country-level markets, market developments, and technology perspectives.
Primary Research
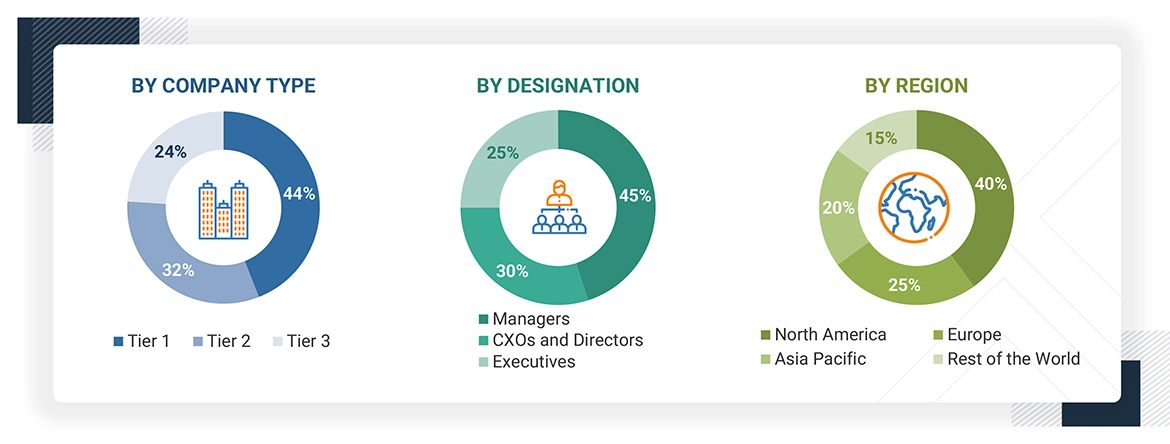
In-depth interviews were conducted with various primary respondents, including key industry participants, subject-matter experts (SMEs), C-level executives of key market players, and industry consultants, among other experts, to obtain and verify the critical qualitative and quantitative information as well as assess future prospects of the market. Various primary sources from both the supply and demand sides of the market were interviewed to obtain qualitative and quantitative information. The following is a breakdown of the primary respondents:
To know about the assumptions considered for the study, download the pdf brochure
Collagen and Gelatin Market Size Estimation
Both top-down and bottom-up approaches were used to estimate and validate the total size of the collagen and gelatin market. These methods were also used extensively to estimate the size of various subsegments in the market. The research methodology used to estimate the market size includes the following:
- The key players in the industry and market have been identified through extensive secondary research
- The revenues generated from the collagen and gelatin business of leading players have been determined through primary and secondary research
- All percentage shares, splits, and breakdowns have been determined using secondary sources and verified through primary sources.
Data Triangulation
After arriving at the overall market size from the market size estimation process, the total market was split into several segments and subsegments. To complete the overall market engineering process and arrive at the exact statistics for all segments and subsegments, data triangulation and market breakdown procedures were employed, wherever applicable. The data was triangulated by studying various factors and trends from both the demand and supply sides.
Report Objectives
- To define, describe, and forecast the collagen and gelatin market based on source, application, end users and region
- To provide detailed information regarding the major factors influencing the growth of the market (such as drivers, restraints, opportunities, and trends)
- To strategically analyze micromarkets with respect to individual growth trends, future prospects, and contributions to the overall collagen and gelatin market
- To analyze opportunities in the market for stakeholders and provide details of the competitive landscape for market leaders
- To forecast the size of the market segments with respect to five main regions, namely, North America, Europe, Asia Pacific, Rest of the World
- To strategically profile the key players and comprehensively analyze their product portfolios, market positions, and core competencies
- To track and analyze competitive developments such as acquisitions, product launches, expansions, agreements, partnerships, and R&D activities in the collagen and gelatin market.
Available Customizations
With the given market data, MarketsandMarkets offers customizations as per the company’s specific needs. The following customization options are available for this report:
Company Information
- An additional five company profiles
Growth opportunities and latent adjacency in Collagen and Gelatin Market