2
RESEARCH METHODOLOGY
59
5
MARKET OVERVIEW AND INDUSTRY TRENDS
Generative AI's rapid evolution drives market growth amid cost, bias, and security challenges.
82
5.2.1.1
INNOVATION OF CLOUD STORAGE TO ENABLE EASY DATA ACCESS
5.2.1.2
EVOLUTION OF AI AND DEEP LEARNING
5.2.1.3
RISE IN CONTENT CREATION AND CREATIVE APPLICATIONS
5.2.2.1
HIGH COSTS ASSOCIATED WITH TRAINING DATA PREPARATION
5.2.2.2
ISSUES RELATED TO BIAS AND INACCURATELY GENERATED OUTPUT
5.2.2.3
RISKS ASSOCIATED WITH DATA BREACHES AND SENSITIVE INFORMATION LEAKAGE
5.2.3.1
INCREASING DEPLOYMENT OF LARGE LANGUAGE MODELS
5.2.3.2
GROWING INTEREST OF ENTERPRISES IN COMMERCIALIZING SYNTHETIC IMAGES
5.2.3.3
ROBUST IMPROVEMENT IN GENERATIVE AI MODELS LEADING TO HUMAN BASELINE PERFORMANCE
5.2.4.1
USE OF GENERATIVE AI FOR ILLEGAL ACTIVITIES
5.2.4.2
QUALITY OF OUTPUT GENERATED BY GENERATIVE AI MODELS
5.2.4.3
COMPUTATIONAL COMPLEXITY AND TECHNICAL CHALLENGES OF GENERATIVE AI
5.3
EVOLUTION OF GENERATIVE AI
5.4
GENERATIVE AI MATURITY CURVE
5.5
SUPPLY CHAIN ANALYSIS
5.6.1
GENERATIVE AI INFRASTRUCTURE PROVIDERS
5.6.2
GENERATIVE AI SOFTWARE PROVIDERS
5.6.3
GENERATIVE AI SERVICE PROVIDERS
5.7
IMPACT OF 2025 US TARIFF – GENERATIVE AI MARKET
5.7.3
PRICE IMPACT ANALYSIS
5.7.3.1
STRATEGIC SHIFTS AND EMERGING TRENDS
5.7.4
IMPACT ON COUNTRY/REGION
5.7.4.4
ASIA PACIFIC (EXCLUDING CHINA)
5.7.5
IMPACT ON END-USE INDUSTRIES
5.7.5.2
TELECOMMUNICATIONS
5.7.5.3
GOVERNMENT & PUBLIC SECTOR
5.7.5.4
HEALTHCARE & LIFE SCIENCES
5.7.5.6
MEDIA & ENTERTAINMENT
5.7.5.7
RETAIL & E-COMMERCE
5.7.5.8
SOFTWARE & TECHNOLOGY PROVIDERS
5.8
INVESTMENT AND FUNDING SCENARIO
5.9.1
FORTUNE ANALYTICS – AI-DRIVEN BUSINESS INSIGHTS THROUGH ACCENTURE TECHNOLOGY
5.9.2
VODAFONE GROUP PLC UNCOVERED KEY TRENDS AND RICH INSIGHTS THROUGH PERSADO’S MOTIVATION AI
5.9.3
WPP PARTNERED WITH SYNTHESIA - TRAINED 50,000 EMPLOYEES WITH AI VIDEOS
5.9.4
OPPLUS & INBENTA – AI-DRIVEN CUSTOMER SERVICE TRANSFORMATION FOR BBVA
5.9.5
CISCO SCALED VIDEO CONTENT LOCALIZATION USING LUMEN5
5.10.1.1
FOUNDATION MODELS
5.10.1.2
TRANSFORMER ARCHITECTURES
5.10.1.3
DIFFUSION MODELS
5.10.1.4
GENERATIVE ADVERSARIAL NETWORKS (GANS)
5.10.1.5
REINFORCEMENT LEARNING WITH HUMAN FEEDBACK (RLHF)
5.10.2
COMPLEMENTARY TECHNOLOGIES
5.10.2.1
HIGH-PERFORMANCE COMPUTING (HPC)
5.10.2.2
VECTOR DATABASES
5.10.2.3
RETRIEVAL-AUGMENTED GENERATION (RAG)
5.10.2.5
MODEL MONITORING & GOVERNANCE
5.10.3
ADJACENT TECHNOLOGIES
5.10.3.1
NATURAL LANGUAGE PROCESSING (NLP)
5.10.3.4
KNOWLEDGE GRAPHS
5.10.3.5
SPEECH RECOGNITION & SYNTHESIS
5.11
TARIFF AND REGULATORY LANDSCAPE
5.11.1
TARIFF RELATED TO PROCESSORS AND CONTROLLERS (HSN: 854231)
5.11.2
REGULATORY BODIES, GOVERNMENT AGENCIES, AND OTHER ORGANIZATIONS
5.11.3.1.1
SCR 17: ARTIFICIAL INTELLIGENCE BILL (CALIFORNIA)
5.11.3.1.2
S1103: ARTIFICIAL INTELLIGENCE AUTOMATED DECISION BILL (CONNECTICUT)
5.11.3.1.3
NATIONAL ARTIFICIAL INTELLIGENCE INITIATIVE ACT (NAIIA) (US)
5.11.3.1.4
ARTIFICIAL INTELLIGENCE AND DATA ACT (AIDA) (CANADA)
5.11.3.2.1
EUROPEAN UNION (EU) - ARTIFICIAL INTELLIGENCE ACT (AIA)
5.11.3.2.2
GENERAL DATA PROTECTION REGULATION (EUROPE)
5.11.3.3.1
INTERIM ADMINISTRATIVE MEASURES FOR GENERATIVE ARTIFICIAL INTELLIGENCE SERVICES (CHINA)
5.11.3.3.2
NATIONAL AI STRATEGY (SINGAPORE)
5.11.3.3.3
HIROSHIMA AI PROCESS COMPREHENSIVE POLICY FRAMEWORK (JAPAN)
5.11.3.4
MIDDLE EAST & AFRICA
5.11.3.4.1
NATIONAL STRATEGY FOR ARTIFICIAL INTELLIGENCE (UAE)
5.11.3.4.2
NATIONAL ARTIFICIAL INTELLIGENCE STRATEGY (QATAR)
5.11.3.4.3
AI ETHICS PRINCIPLES AND GUIDELINES (DUBAI)
5.11.3.5.1
SANTIAGO DECLARATION (CHILE)
5.11.3.5.2
BRAZILIAN ARTIFICIAL INTELLIGENCE STRATEGY (EBIA)
5.12.1
EXPORT SCENARIO OF PROCESSORS AND CONTROLLERS
5.12.2
IMPORT SCENARIO OF PROCESSORS AND CONTROLLERS
5.13.2
PATENTS FILED, BY DOCUMENT TYPE
5.13.3
INNOVATION AND PATENT APPLICATIONS
5.14.1
AVERAGE SELLING PRICE OF OFFERING, BY KEY PLAYER, 2025
5.14.2
AVERAGE SELLING PRICE, BY APPLICATION, 2025
5.15
KEY CONFERENCES AND EVENTS
5.16
PORTER’S FIVE FORCES ANALYSIS
5.16.1
THREAT OF NEW ENTRANTS
5.16.2
THREAT OF SUBSTITUTES
5.16.3
BARGAINING POWER OF SUPPLIERS
5.16.4
BARGAINING POWER OF BUYERS
5.16.5
INTENSITY OF COMPETITION RIVALRY
5.17
KEY STAKEHOLDERS AND BUYING CRITERIA
5.17.1
KEY STAKEHOLDERS IN BUYING PROCESS
5.18
TRENDS/DISRUPTIONS IMPACTING CUSTOMER BUSINESS
6
GENERATIVE AI MARKET, BY OFFERING
Market Size & Growth Rate Forecast Analysis to 2032 in USD Million and Units | 74 Data Tables
142
6.1.1
OFFERING: GENERATIVE AI MARKET DRIVERS
6.2.1.1
COMPUTE POWER DRIVES MODEL TRAINING AND INFERENCE
6.2.1.2
GRAPHICS PROCESSING UNITS (GPUS)
6.2.1.3
CENTRAL PROCESSING UNITS (CPUS)
6.2.1.4
FIELD-PROGRAMMABLE GATE ARRAYS (FPGAS)
6.2.2.1
HIGH-PERFORMANCE MEMORY TO SUSTAIN AI WORKLOAD DEMANDS
6.2.2.2
DOUBLE DATA RATE (DDR)
6.2.2.3
HIGH BANDWIDTH MEMORY (HBM)
6.2.3
NETWORKING HARDWARE
6.2.3.1
FAST, SCALABLE CONNECTIVITY TO SUPPORT DISTRIBUTED AI SYSTEMS
6.2.3.2
NIC/NETWORK ADAPTERS
6.2.4.1
STORAGE SYSTEMS BUILT FOR SPEED, SCALE, AND AI READINESS
6.3.1.1
FOUNDATION MODELS POWER DIVERSE, SCALABLE GENERATIVE AI APPLICATIONS
6.3.2
MODEL ENABLEMENT & ORCHESTRATION TOOLS
6.3.2.1
TOOLING ECOSYSTEM CRITICAL TO OPERATIONALIZING GENERATIVE AI AT SCALE
6.3.2.2
MODEL HOSTING & ACCESS PLATFORMS
6.3.2.3
LLMOPS & PROMPT ENGINEERING TOOLS
6.3.2.4
MODEL FINE-TUNING TOOLS
6.3.2.5
MODEL MONITORING & EVALUATION TOOLS
6.3.2.6
GOVERNANCE & RISK PLATFORMS
6.3.3.1
PACKAGED GENERATIVE AI SAAS UNLOCKS BUSINESS VALUE ACROSS FUNCTIONS
6.3.3.3
GENERATIVE DESIGN & PROTOTYPING TOOLS
6.3.3.4
SYNTHETIC DATA GENERATORS
6.3.3.5
GENERATIVE AI AGENTS
6.3.3.6
DOMAIN-SPECIFIC GEN AI TOOLS
6.4.1
GEN AI TRAINING & CONSULTING SERVICES
6.4.1.1
EMPOWERING ENTERPRISES WITH STRATEGIC GENERATIVE AI ADVISORY AND TRAINING PROGRAMS
6.4.2
MODEL DEVELOPMENT & FINE-TUNING SERVICES
6.4.2.1
DELIVERING CUSTOMIZED GENERATIVE AI MODELS THROUGH DEVELOPMENT AND FINE-TUNING EXPERTISE
6.4.3
PROMPT ENGINEERING SERVICES
6.4.3.1
OPTIMIZING GENERATIVE AI OUTCOMES WITH ADVANCED PROMPT ENGINEERING TECHNIQUES
6.4.4
INTEGRATION & DEPLOYMENT SERVICES
6.4.4.1
ACCELERATING ENTERPRISE TRANSFORMATION THROUGH SEAMLESS GENERATIVE AI INTEGRATION AND DEPLOYMENT
6.4.5
SUPPORT & MAINTENANCE SERVICES
6.4.5.1
ENSURING RELIABILITY AND COMPLIANCE WITH ONGOING GENERATIVE AI SUPPORT AND MAINTENANCE
6.4.6
GEN AI TRAINING DATA SERVICES
6.4.6.1
ENABLING HIGH-PERFORMANCE GENERATIVE AI WITH CURATED AND DOMAIN-SPECIFIC TRAINING DATA SERVICES
6.4.7
MANAGED GEN AI SERVICES
6.4.7.1
SIMPLIFYING AI OPERATIONS WITH COMPREHENSIVE MANAGED GENERATIVE AI SOLUTIONS
7
GENERATIVE AI MARKET, BY DATA MODALITY
Market Size & Growth Rate Forecast Analysis to 2032 in USD Million | 14 Data Tables
181
7.1.1
DATA MODALITY: GENERATIVE AI MARKET DRIVERS
7.2.1
TEXT-BASED AI POWERS HUMAN-LIKE CONTENT CREATION
7.3.1
TRANSFORMING DESIGN AND MARKETING WITH GENERATIVE IMAGES
7.4.1
COMPLEX VIDEO GENERATION THROUGH AI
7.5.1
ENHANCING HUMAN-MACHINE DIALOGUE THROUGH SPEECH AI
7.6.1
ACCELERATING SOFTWARE DEVELOPMENT THROUGH EXECUTABLE OUTPUT GENERATION
7.7.1
MERGING TEXT, IMAGE, AND AUDIO FOR RICHER AI EXPERIENCES
8
GENERATIVE AI MARKET, BY APPLICATION
Market Size & Growth Rate Forecast Analysis to 2032 in USD Million | 56 Data Tables
190
8.1.1
APPLICATION: GENERATIVE AI MARKET DRIVERS
8.2
BUSINESS INTELLIGENCE & VISUALIZATION
8.2.1
ENABLING SMARTER INSIGHTS ACROSS BUSINESS FUNCTIONS
8.2.3
MARKETING INTELLIGENCE
8.2.4
HUMAN RESOURCE INTELLIGENCE
8.2.5
FINANCE INTELLIGENCE
8.2.6
OPERATIONS & SUPPLY CHAIN INTELLIGENCE
8.3.1
ACCELERATING DIGITAL CONTENT WORKFLOWS THROUGH AI
8.3.3
CONTENT CURATION, TAGGING, & CATEGORIZATION
8.4
SYNTHETIC DATA MANAGEMENT
8.4.1
AI-GENERATED DATA FOR FASTER, FAIRER MODEL TRAINING
8.4.2
SYNTHETIC DATA AUGMENTATION
8.4.3
SYNTHETIC DATA TRAINING
8.5.1
INTELLIGENT INFORMATION ACCESS THROUGH GENERATIVE MODELS
8.6
AUTOMATION & INTEGRATION
8.6.1
CONNECTING SYSTEMS AND AUTOMATING WORKFLOWS USING GENERATIVE AI
8.6.2
PERSONALIZATION & RECOMMENDATION SYSTEMS
8.6.3
CUSTOMER EXPERIENCE MANAGEMENT
8.6.4
APPLICATION DEVELOPMENT & API INTEGRATION
8.6.5
CYBERSECURITY INTELLIGENCE
8.7.1
ACCELERATING AND EXPANDING CREATIVE POSSIBILITIES WITH GENERATIVE DESIGN AI
8.7.2
DESIGN EXPLORATION & VARIATION
8.7.3
MODELING & PROTOTYPING
8.7.4
PRODUCT RENDERING & VISUAL COLLATERALS
9
GENERATIVE AI MARKET, BY END USER
Market Size & Growth Rate Forecast Analysis to 2032 in USD Million | 48 Data Tables
220
9.1.1
END USER: GENERATIVE AI MARKET DRIVERS
9.3.1.1
INTELLIGENT AUTOMATION TRANSFORMS BFSI WORKFLOWS FROM KYC TO REGULATORY COMPLIANCE
9.3.1.2
PERSONALIZED FINANCE ADVISORS
9.3.1.3
AUTOMATED REPORT & COMMENTARY GENERATION
9.3.1.4
INTELLIGENT UNDERWRITING & CLAIMS
9.3.1.5
FRAUD DETECTION & PREVENTION
9.3.1.6
REGULATORY REPORTING & COMPLIANCE
9.3.1.7
OTHER BFSI USE CASES
9.3.2
RETAIL & E-COMMERCE
9.3.2.1
AI TRANSFORMS E-COMMERCE THROUGH VIRTUAL ASSISTANTS, SEO CONTENT, AND DEMAND FORECASTING
9.3.2.2
PRODUCT DESCRIPTION & SEO CONTENT GENERATION
9.3.2.3
VIRTUAL SHOPPING ASSISTANTS
9.3.2.4
PERSONALIZED PRODUCT RECOMMENDATIONS
9.3.2.5
CUSTOMER QUERY RESOLUTION
9.3.2.6
DEMAND FORECASTING & INVENTORY MANAGEMENT
9.3.2.7
OTHER RETAIL & E-COMMERCE USE CASES
9.3.3
GOVERNMENT & DEFENSE
9.3.3.1
AI ENHANCES DEFENSE READINESS AND SERVICE DELIVERY THROUGH SCENARIO SIMULATIONS AND LEGISLATIVE SUMMARIES
9.3.3.2
POLICY DRAFTING & LEGISLATIVE SUMMARIZATION
9.3.3.3
CITIZEN SERVICES CHATBOTS
9.3.3.4
OSINT BRIEFING & REPORTING
9.3.3.5
DOCUMENT CLASSIFICATION & KNOWLEDGE RETRIEVAL
9.3.3.6
THREAT SCENARIO SIMULATION
9.3.3.7
OTHER GOVERNMENT & DEFENSE USE CASES
9.3.4.1
ENHANCING TELECOM EFFICIENCY WITH AI-POWERED CONTACT CENTERS, FIELD SERVICES, AND FRAUD DETECTION
9.3.4.2
NETWORK OPERATIONS & FAULT DIAGNOSIS
9.3.4.3
AUTOMATED SLA REPORTING
9.3.4.4
CONTACT CENTER INTELLIGENCE
9.3.4.5
MARKETING CONTENT & CAMPAIGN PERSONALIZATION
9.3.4.6
REVENUE ASSURANCE & FRAUD PREVENTION
9.3.4.7
OTHER TELECOMMUNICATIONS USE CASES
9.3.5
MEDIA & ENTERTAINMENT
9.3.5.1
GENERATIVE AI REDEFINES CONTENT CREATION ACROSS FILM, GAMING, AND MARKETING
9.3.5.2
SCRIPTWRITING & NARRATIVE GENERATION
9.3.5.3
AI VOICEOVER & DUBBING
9.3.5.4
VISUAL ASSETS GENERATION & MOTION DESIGN
9.3.5.5
MULTILINGUAL CONTENT LOCALIZATION
9.3.5.6
ADVERTISING & CAMPAIGN COPYWRITING
9.3.5.7
SYNTHETIC INFLUENCERS, HOSTS, & DIGITAL AVATARS
9.3.5.8
DIGITAL RIGHTS & IP PROTECTION
9.3.5.9
OTHER MEDIA & ENTERTAINMENT USE CASES
9.3.6
TRANSPORTATION & LOGISTICS
9.3.6.1
GENERATIVE AI EMPOWERS LOGISTICS FIRMS WITH PREDICTIVE ROUTING, SMART DOCUMENTATION, AND EFFICIENT WAREHOUSE PLANNING
9.3.6.2
ROUTE OPTIMIZATION
9.3.6.3
FREIGHT DOCUMENTATION
9.3.6.5
WAREHOUSE MANAGEMENT
9.3.6.6
TRAFFIC SCENARIO SIMULATION
9.3.6.7
OTHER TRANSPORTATION & LOGISTICS USE CASES
9.3.7.1
GENERATIVE AI TRANSFORMS PRODUCT LIFECYCLE FROM PLANNING AND DESIGN TO MAINTENANCE AND TECHNICAL CONTENT
9.3.7.2
DESIGN GENERATION
9.3.7.3
PREDICTIVE MAINTENANCE
9.3.7.4
QUALITY INSPECTION & CONTROL
9.3.7.5
PROCUREMENT & SUPPLIER MANAGEMENT
9.3.7.6
PRODUCT PLANNING & SIMULATION
9.3.7.7
OTHER MANUFACTURING USE CASES
9.3.8
HEALTHCARE & LIFE SCIENCES
9.3.8.1
IMPROVING PATIENT OUTCOMES AND MEDICAL RESEARCH WITH GEN AI TOOLS AND APPLICATIONS
9.3.8.2
ELECTRONIC HEALTH RECORD (EHR) AUTOMATION
9.3.8.4
VIRTUAL HEALTH ASSISTANTS
9.3.8.5
DRUG DISCOVERY & MOLECULE DESIGN
9.3.8.6
CLINICAL TRIAL PROTOCOL DESIGN
9.3.8.7
PERSONALIZED TREATMENT PLANS
9.3.8.8
OTHER HEALTHCARE & LIFE SCIENCES USE CASES
9.3.9
SOFTWARE & TECHNOLOGY PROVIDERS
9.3.9.1
AUTOMATING KNOWLEDGE DISCOVERY AND WORKFLOWS WITH GEN AI IN SOFTWARE & TECHNOLOGY FIRMS
9.3.9.2
CODE GENERATION & DEBUGGING
9.3.9.3
TEST CASE GENERATION & QA AUTOMATION
9.3.9.4
GEN AI-ASSISTED ITSM
9.3.9.5
CUSTOMER SUPPORT AUTOMATION
9.3.9.6
KNOWLEDGE DISCOVERY
9.3.9.7
BUSINESS PROCESS AUTOMATION
9.3.9.8
OTHER SOFTWARE & TECHNOLOGY PROVIDER USE CASES
9.3.10
ENERGY & UTILITIES
9.3.10.1
ENHANCING GRID OPERATIONS, ASSET MAINTENANCE, AND FORECASTING USING GENERATIVE AI
9.3.10.2
CONDITION-BASED ASSET MAINTENANCE
9.3.10.3
GRID OPERATIONS MANAGEMENT
9.3.10.4
RENEWABLE ENERGY FORECASTING
9.3.10.5
SUSTAINABILITY & EMISSIONS REPORTING
9.3.10.6
DIGITAL TWIN SIMULATIONS
9.3.10.7
OTHER ENERGY & UTILITIES USE CASES
10
GENERATIVE AI MARKET, BY REGION
Comprehensive coverage of 7 Regions with country-level deep-dive of 20 Countries | 242 Data Tables.
264
10.2.1
NORTH AMERICA: GENERATIVE AI MARKET DRIVERS
10.2.2
NORTH AMERICA: MACROECONOMIC OUTLOOK
10.2.3.1
ADVANCEMENTS IN FOUNDATIONAL MODELS AND CLOUD INFRASTRUCTURE TO DRIVE MARKET
10.2.4.1
FOCUS ON TALENT DEVELOPMENT, ETHICAL AI POLICIES, AND ECOSYSTEM COLLABORATION TO DRIVE MARKET
10.3.1
EUROPE: GENERATIVE AI MARKET DRIVERS
10.3.2
EUROPE: MACROECONOMIC OUTLOOK
10.3.3.1
AI SAFETY SUMMIT TO DRIVE DEMAND FOR RESPONSIBLE AI DEVELOPMENT
10.3.4.1
STRONG PUBLIC-PRIVATE PARTNERSHIPS AND COLLABORATIONS BETWEEN COMPANIES, STARTUPS, AND UNIVERSITIES TO DRIVE MARKET
10.3.5.1
PROMOTION OF FLEXIBLE AI INNOVATION THROUGH REGULATORY SANDBOXES AND STARTUP-FRIENDLY LAWS TO DRIVE MARKET
10.3.6.1
ADVANCEMENTS IN GENERATIVE AI RESEARCH TO DRIVE MARKET
10.3.7.1
INTEGRATION OF GENERATIVE AI WITH GOVERNMENT-BACKED PILOT PROGRAMS TO DRIVE MARKET
10.3.8.1
SUPPORT FOR HOMEGROWN BUSINESSES THROUGH BUSINESS FINLAND GRANTS TO DRIVE MARKET
10.4.1
ASIA PACIFIC: GENERATIVE AI MARKET DRIVERS
10.4.2
ASIA PACIFIC: MACROECONOMIC OUTLOOK
10.4.3.1
STRUCTURED FRAMEWORKS FOR SAFE AI DEVELOPMENT AND DEPLOYMENT TO DRIVE MARKET
10.4.4.1
STRONG STARTUP ECOSYSTEM TO ACCELERATE COMMERCIALIZATION OF AI RESEARCH AND INNOVATION
10.4.5.1
GOVERNMENT INITIATIVES LIKE MOONSHOT R&D AND SOCIETY 5.0 TO DRIVE MARKET
10.4.6.1
ESTABLISHMENT OF AI REGULATORY SANDBOXES AND ETHICS GUIDELINES FOR RESPONSIBLE EXPERIMENTATION TO DRIVE MARKET
10.4.7.1
NATIONAL AI STRATEGY 2.0 OUTLINING AI INTEGRATION ACROSS HEALTHCARE, FINANCE, AND URBAN PLANNING TO DRIVE MARKET
10.4.8
AUSTRALIA & NEW ZEALAND
10.4.8.1
SUPPORT FOR AI STARTUP ECOSYSTEMS THROUGH ACCELERATORS AND R&D TAX INCENTIVES TO DRIVE MARKET
10.4.9
REST OF ASIA PACIFIC
10.5
MIDDLE EAST & AFRICA
10.5.1
MIDDLE EAST & AFRICA: GENERATIVE AI MARKET DRIVERS
10.5.2
MIDDLE EAST & AFRICA: MACROECONOMIC OUTLOOK
10.5.3.1
STARTUP SUPPORT PROGRAMS AND PARTNERSHIPS WITH GLOBAL AI FIRMS TO DRIVE MARKET
10.5.4.1
FUNDING AND MENTORSHIP TO AI STARTUPS TO DRIVE MARKET
10.5.5.1
APPLICATION OF GENERATIVE AI IN PLATFORMS TAILORED TO DIVERSE LINGUISTIC AND CULTURAL NEEDS TO DRIVE MARKET
10.5.6.1
STRONG RESEARCH INSTITUTIONS, MATURE TECH ECOSYSTEM, AND GOVERNMENT SUPPORT TO DRIVE MARKET
10.5.7
REST OF MIDDLE EAST & AFRICA
10.6.1
LATIN AMERICA: GENERATIVE AI MARKET DRIVERS
10.6.2
LATIN AMERICA: MACROECONOMIC OUTLOOK
10.6.3.1
SUPPORT FROM BRAZILIAN DEVELOPMENT BANK (BNDES) FOR AI STARTUPS THROUGH FUNDING PROGRAMS TO DRIVE MARKET
10.6.4.1
DEVELOPMENT OF GENERATIVE AI TOOLS TAILORED TO SPANISH LANGUAGE AND MEXICAN CULTURAL CONTEXT TO DRIVE MARKET
10.6.5.1
SUPPORT FOR AI-DRIVEN STARTUPS THROUGH CO-WORKING SPACES, GRANTS, AND MENTORSHIP TO DRIVE MARKET
10.6.6
REST OF LATIN AMERICA
11
COMPETITIVE LANDSCAPE
Uncover strategic dominance and market shares in AI content generation across leading tech giants.
376
11.2
KEY PLAYER STRATEGIES/RIGHT TO WIN, 2020–2024
11.3
REVENUE ANALYSIS, 2020–2024
11.4
MARKET SHARE ANALYSIS, 2024
11.4.1
MARKET RANKING ANALYSIS, 2024
11.5.1
PRODUCT COMPARATIVE ANALYSIS, BY TEXT GENERATOR
11.5.1.3
ANTHROPIC (CLAUDE)
11.5.1.4
PERPLEXITY (PERPLEXITY AI)
11.5.1.5
DEEPSEEK (DEEPSEEK)
11.5.2
PRODUCT COMPARATIVE ANALYSIS, BY IMAGE GENERATOR
11.5.2.2
MIDJOURNEY (MIDJOURNEY V6)
11.5.2.3
STABILITY AI (STABLE DIFFUSION)
11.5.2.4
ADOBE (ADOBE FIREFLY)
11.5.2.5
RUNWAY (RUNWAY GEN-2)
11.5.3
PRODUCT COMPARATIVE ANALYSIS, BY VIDEO GENERATOR
11.5.3.2
RUNWAY (RUNWAY GEN-2)
11.5.3.3
SYNTHESIA (SYNTHESIA STUDIO)
11.5.3.4
LUMEN5 (LUMEN5 VIDEO MAKER)
11.5.3.5
COLOSSYAN (COLOSSYAN CREATOR)
11.5.3.6
PIKA LABS (PIKA)
11.5.4
PRODUCT COMPARATIVE ANALYSIS, BY AUDIO & SPEECH GENERATOR
11.5.4.1
ELEVENLABS (ELEVEN MULTILINGUAL VOICE AI)
11.5.4.2
OPENAI (VOICE ENGINE)
11.5.4.3
PLAY.HT (PLAYAI PLATFORM)
11.5.4.4
AWS (AMAZON POLLY)
11.5.4.6
SOUNDFUL (AI MUSIC GENERATOR)
11.6
COMPANY VALUATION AND FINANCIAL METRICS
11.7
COMPANY EVALUATION MATRIX: KEY PLAYERS, 2024
11.7.5
COMPANY FOOTPRINT: KEY PLAYERS, 2024
11.7.5.1
COMPANY FOOTPRINT
11.7.5.2
REGION FOOTPRINT
11.7.5.3
OFFERING FOOTPRINT
11.7.5.4
DATA MODALITY FOOTPRINT
11.7.5.5
END USER FOOTPRINT
11.8
COMPANY EVALUATION MATRIX: STARTUPS/SMES, 2024
11.8.1
PROGRESSIVE COMPANIES
11.8.2
RESPONSIVE COMPANIES
11.8.5
COMPETITIVE BENCHMARKING: STARTUPS/SMES, 2024
11.8.5.1
DETAILED LIST OF KEY STARTUPS/SMES
11.8.5.2
COMPETITIVE BENCHMARKING OF KEY STARTUPS/SMES
11.9
COMPETITIVE SCENARIO
11.9.1
PRODUCT LAUNCHES AND ENHANCEMENTS
12
COMPANY PROFILES
In-depth Company Profiles of Leading Market Players with detailed Business Overview, Product and Service Portfolio, Recent Developments, and Unique Analyst Perspective (MnM View)
458
12.2.1.1
BUSINESS OVERVIEW
12.2.1.2
PRODUCTS OFFERED
12.2.1.3
RECENT DEVELOPMENTS
12.2.1.3.1
PRODUCT LAUNCHES AND ENHANCEMENTS
12.2.1.4.2
STRATEGIC CHOICES
12.2.1.4.3
WEAKNESSES AND COMPETITIVE THREATS
12.2.16
TELUS INTERNATIONAL
12.2.21
FRACTAL ANALYTICS
12.4
OPEN-SOURCE COMPANIES
12.4.6
TECHNOLOGY INNOVATION INSTITUTE
13
ADJACENT AND RELATED MARKETS
600
13.2
LARGE LANGUAGE MODEL MARKET – GLOBAL FORECAST TO 2030
13.2.2.1
LARGE LANGUAGE MODEL MARKET, BY OFFERING
13.2.2.2
LARGE LANGUAGE MODEL MARKET, BY ARCHITECTURE
13.2.2.3
LARGE LANGUAGE MODEL MARKET, BY MODALITY
13.2.2.4
LARGE LANGUAGE MODEL MARKET, BY MODEL SIZE
13.2.2.5
LARGE LANGUAGE MODEL MARKET, BY APPLICATION
13.2.2.6
LARGE LANGUAGE MODEL MARKET, BY END USER
13.2.2.7
LARGE LANGUAGE MODEL MARKET, BY REGION
13.3
ARTIFICIAL INTELLIGENCE MARKET – GLOBAL FORECAST TO 2032
13.3.2.1
ARTIFICIAL INTELLIGENCE (AI) MARKET, BY OFFERING
13.3.2.2
ARTIFICIAL INTELLIGENCE (AI) MARKET, BY TECHNOLOGY
13.3.2.3
ARTIFICIAL INTELLIGENCE (AI) MARKET, BY BUSINESS FUNCTION
13.3.2.4
ARTIFICIAL INTELLIGENCE (AI) MARKET, BY ENTERPRISE APPLICATION
13.3.2.5
ARTIFICIAL INTELLIGENCE (AI) MARKET, BY END USER
13.3.2.6
ARTIFICIAL INTELLIGENCE (AI) MARKET, BY REGION
14.2
KNOWLEDGESTORE: MARKETSANDMARKETS’ SUBSCRIPTION PORTAL
14.3
CUSTOMIZATION OPTIONS
TABLE 1
GENERATIVE AI MARKET DETAILED SEGMENTATION
TABLE 2
USD EXCHANGE RATE, 2019–2023
TABLE 3
PRIMARY INTERVIEWS
TABLE 5
GENERATIVE AI MARKET: RESEARCH ASSUMPTIONS
TABLE 6
GENERATIVE AI MARKET SIZE AND GROWTH RATE, 2020–2024 (USD MILLION, Y-O-Y %)
TABLE 7
GENERATIVE AI MARKET SIZE AND GROWTH RATE, 2025–2032 (USD MILLION, Y-O-Y %)
TABLE 8
GENERATIVE AI MARKET: SUPPLY CHAIN ANALYSIS
TABLE 9
GENERATIVE AI MARKET: ECOSYSTEM
TABLE 10
US ADJUSTED RECIPROCAL TARIFF RATES
TABLE 11
TARIFF RELATED TO GEN AI PROCESSORS AND CONTROLLERS (HSN: 854231), 2024
TABLE 12
NORTH AMERICA: REGULATORY BODIES, GOVERNMENT AGENCIES, AND OTHER ORGANIZATIONS
TABLE 13
EUROPE: REGULATORY BODIES, GOVERNMENT AGENCIES, AND OTHER ORGANIZATIONS
TABLE 14
ASIA PACIFIC: REGULATORY BODIES, GOVERNMENT AGENCIES, AND OTHER ORGANIZATIONS
TABLE 15
MIDDLE EAST & AFRICA: REGULATORY BODIES, GOVERNMENT AGENCIES, AND OTHER ORGANIZATIONS
TABLE 16
LATIN AMERICA: REGULATORY BODIES, GOVERNMENT AGENCIES, AND OTHER ORGANIZATIONS
TABLE 17
PATENTS FILED, 2016–2025
TABLE 18
LIST OF FEW PATENTS IN GENERATIVE AI MARKET, 2024–2025
TABLE 19
AVERAGE SELLING PRICE OF OFFERING, BY KEY PLAYER, 2025
TABLE 20
AVERAGE SELLING PRICE, BY APPLICATION, 2025
TABLE 21
GENERATIVE AI MARKET: LIST OF KEY CONFERENCES AND EVENTS, 2025–2026
TABLE 22
IMPACT OF PORTER’S FIVE FORCES ON GENERATIVE AI MARKET
TABLE 23
INFLUENCE OF STAKEHOLDERS ON BUYING PROCESS FOR TOP THREE ENTERPRISE END USERS
TABLE 24
KEY BUYING CRITERIA FOR TOP THREE ENTERPRISE END-USERS
TABLE 25
GENERATIVE AI MARKET, BY OFFERING, 2020–2024 (USD MILLION)
TABLE 26
GENERATIVE AI MARKET, BY OFFERING, 2025–2032 (USD MILLION)
TABLE 27
GENERATIVE AI MARKET, BY INFRASTRUCTURE, 2020–2024 (USD MILLION)
TABLE 28
GENERATIVE AI MARKET, BY INFRASTRUCTURE, 2025–2032 (USD MILLION)
TABLE 29
GENERATIVE AI MARKET, BY COMPUTE, 2020–2024 (USD MILLION)
TABLE 30
GENERATIVE AI MARKET, BY COMPUTE, 2025–2032 (USD MILLION)
TABLE 31
GRAPHICS PROCESSING UNITS: GENERATIVE AI MARKET, BY REGION, 2020–2024 (USD MILLION)
TABLE 32
GRAPHICS PROCESSING UNITS: GENERATIVE AI MARKET, BY REGION, 2025–2032 (USD MILLION)
TABLE 33
CENTRAL PROCESSING UNITS: GENERATIVE AI MARKET, BY REGION, 2020–2024 (USD MILLION)
TABLE 34
CENTRAL PROCESSING UNITS: GENERATIVE AI MARKET, BY REGION, 2025–2032 (USD MILLION)
TABLE 35
FIELD-PROGRAMMABLE GATE ARRAYS: GENERATIVE AI MARKET, BY REGION, 2020–2024 (USD MILLION)
TABLE 36
FIELD-PROGRAMMABLE GATE ARRAYS: GENERATIVE AI MARKET, BY REGION, 2025–2032 (USD MILLION)
TABLE 37
GENERATIVE AI MARKET, BY MEMORY, 2020–2024 (USD MILLION)
TABLE 38
GENERATIVE AI MARKET, BY MEMORY 2025–2032 (USD MILLION)
TABLE 39
DDR: GENERATIVE AI MARKET, BY REGION, 2020–2024 (USD MILLION)
TABLE 40
DDR: GENERATIVE AI MARKET, BY REGION, 2025–2032 (USD MILLION)
TABLE 41
HBM: GENERATIVE AI MARKET, BY REGION, 2020–2024 (USD MILLION)
TABLE 42
HBM: GENERATIVE AI MARKET, BY REGION, 2025–2032 (USD MILLION)
TABLE 43
GENERATIVE AI MARKET, BY NETWORKING HARDWARE, 2020–2024 (USD MILLION)
TABLE 44
GENERATIVE AI MARKET, BY NETWORKING HARDWARE, 2025–2032 (USD MILLION)
TABLE 45
GENERATIVE AI MARKET, BY NIC/NETWORK ADAPTER, 2020–2024 (USD MILLION)
TABLE 46
GENERATIVE AI MARKET, BY NIC/NETWORK ADAPTER, 2025–2032 (USD MILLION)
TABLE 47
ETHERNET: GENERATIVE AI MARKET, BY REGION, 2020–2024 (USD MILLION)
TABLE 48
ETHERNET: GENERATIVE AI MARKET, BY REGION, 2025–2032 (USD MILLION)
TABLE 49
INFINIBAND: GENERATIVE AI MARKET, BY REGION, 2020–2024 (USD MILLION)
TABLE 50
INFINIBAND: GENERATIVE AI MARKET, BY REGION, 2025–2032 (USD MILLION)
TABLE 51
INTERCONNECTS: GENERATIVE AI MARKET, BY REGION, 2020–2024 (USD MILLION)
TABLE 52
INTERCONNECTS: GENERATIVE AI MARKET, BY REGION, 2025–2032 (USD MILLION)
TABLE 53
STORAGE: GENERATIVE AI MARKET, BY REGION, 2020–2024 (USD MILLION)
TABLE 54
STORAGE: GENERATIVE AI MARKET, BY REGION, 2025–2032 (USD MILLION)
TABLE 55
GENERATIVE AI MARKET, BY SOFTWARE, 2020–2024 (USD MILLION)
TABLE 56
GENERATIVE AI MARKET, BY SOFTWARE, 2025–2032 (USD MILLION)
TABLE 57
FOUNDATION MODELS: GENERATIVE AI MARKET, BY REGION, 2020–2024 (USD MILLION)
TABLE 58
FOUNDATION MODELS: GENERATIVE AI MARKET, BY REGION, 2025–2032 (USD MILLION)
TABLE 59
GENERATIVE AI MARKET, BY MODEL ENABLEMENT & ORCHESTRATION TOOL, 2020–2024 (USD MILLION)
TABLE 60
GENERATIVE AI MARKET, BY MODEL ENABLEMENT & ORCHESTRATION TOOL, 2025–2032 (USD MILLION)
TABLE 61
MODEL HOSTING & ACCESS PLATFORMS: GENERATIVE AI MARKET, BY REGION, 2020–2024 (USD MILLION)
TABLE 62
MODEL HOSTING & ACCESS PLATFORMS: GENERATIVE AI MARKET, BY REGION, 2025–2032 (USD MILLION)
TABLE 63
LLMOPS & PROMPT ENGINEERING TOOLS: GENERATIVE AI MARKET, BY REGION, 2020–2024 (USD MILLION)
TABLE 64
LLMOPS & PROMPT ENGINEERING TOOLS: GENERATIVE AI MARKET, BY REGION, 2025–2032 (USD MILLION)
TABLE 65
MODEL FINE-TUNING TOOLS: GENERATIVE AI MARKET, BY REGION, 2020–2024 (USD MILLION)
TABLE 66
MODEL FINE-TUNING TOOLS: GENERATIVE AI MARKET, BY REGION, 2025–2032 (USD MILLION)
TABLE 67
MODEL MONITORING & EVALUATION TOOLS: GENERATIVE AI MARKET, BY REGION, 2020–2024 (USD MILLION)
TABLE 68
MODEL MONITORING & EVALUATION TOOLS: GENERATIVE AI MARKET, BY REGION, 2025–2032 (USD MILLION)
TABLE 69
GOVERNANCE & RISK PLATFORMS: GENERATIVE AI MARKET, BY REGION, 2020–2024 (USD MILLION)
TABLE 70
GOVERNANCE & RISK PLATFORMS: GENERATIVE AI MARKET, BY REGION, 2025–2032 (USD MILLION)
TABLE 71
GENERATIVE AI MARKET, BY GEN AI SAAS, 2020–2024 (USD MILLION)
TABLE 72
GENERATIVE AI MARKET, BY GEN AI SAAS, 2025–2032 (USD MILLION)
TABLE 73
CODE GENERATORS: GENERATIVE AI MARKET, BY REGION, 2020–2024 (USD MILLION)
TABLE 74
CODE GENERATORS: GENERATIVE AI MARKET, BY REGION, 2025–2032 (USD MILLION)
TABLE 75
GENERATIVE DESIGN & PROTOTYPING TOOLS: GENERATIVE AI MARKET, BY REGION, 2020–2024 (USD MILLION)
TABLE 76
GENERATIVE DESIGN & PROTOTYPING TOOLS: GENERATIVE AI MARKET, BY REGION, 2025–2032 (USD MILLION)
TABLE 77
SYNTHETIC DATA GENERATORS: GENERATIVE AI MARKET, BY REGION, 2020–2024 (USD MILLION)
TABLE 78
SYNTHETIC DATA GENERATORS: GENERATIVE AI MARKET, BY REGION, 2025–2032 (USD MILLION)
TABLE 79
GENERATIVE AI AGENTS: GENERATIVE AI MARKET, BY REGION, 2020–2024 (USD MILLION)
TABLE 80
GENERATIVE AI AGENTS: GENERATIVE AI MARKET, BY REGION, 2025–2032 (USD MILLION)
TABLE 81
DOMAIN-SPECIFIC GEN AI TOOLS: GENERATIVE AI MARKET, BY REGION, 2020–2024 (USD MILLION)
TABLE 82
DOMAIN-SPECIFIC GEN AI TOOLS: GENERATIVE AI MARKET, BY REGION, 2025–2032 (USD MILLION)
TABLE 83
GENERATIVE AI MARKET, BY SERVICE, 2020–2024 (USD MILLION)
TABLE 84
GENERATIVE AI MARKET, BY SERVICE, 2025–2032 (USD MILLION)
TABLE 85
GEN AI TRAINING & CONSULTING SERVICES: GENERATIVE AI MARKET, BY REGION, 2020–2024 (USD MILLION)
TABLE 86
GEN AI TRAINING & CONSULTING SERVICES: GENERATIVE AI MARKET, BY REGION, 2025–2032 (USD MILLION)
TABLE 87
MODEL DEVELOPMENT & FINE-TUNING SERVICES: GENERATIVE AI MARKET, BY REGION, 2020–2024 (USD MILLION)
TABLE 88
MODEL DEVELOPMENT & FINE-TUNING SERVICES: GENERATIVE AI MARKET, BY REGION, 2025–2032 (USD MILLION)
TABLE 89
PROMPT ENGINEERING SERVICES: GENERATIVE AI MARKET, BY REGION, 2020–2024 (USD MILLION)
TABLE 90
PROMPT ENGINEERING SERVICES: GENERATIVE AI MARKET, BY REGION, 2025–2032 (USD MILLION)
TABLE 91
INTEGRATION & DEPLOYMENT SERVICES: GENERATIVE AI MARKET, BY REGION, 2020–2024 (USD MILLION)
TABLE 92
INTEGRATION & DEPLOYMENT SERVICES: GENERATIVE AI MARKET, BY REGION, 2025–2032 (USD MILLION)
TABLE 93
SUPPORT & MAINTENANCE SERVICES: GENERATIVE AI MARKET, BY REGION, 2020–2024 (USD MILLION)
TABLE 94
SUPPORT & MAINTENANCE SERVICES: GENERATIVE AI MARKET, BY REGION, 2025–2032 (USD MILLION)
TABLE 95
GEN AI TRAINING DATA SERVICES: GENERATIVE AI MARKET, BY REGION, 2020–2024 (USD MILLION)
TABLE 96
GEN AI TRAINING DATA SERVICES: GENERATIVE AI MARKET, BY REGION, 2025–2032 (USD MILLION)
TABLE 97
MANAGED GEN AI SERVICES: GENERATIVE AI MARKET, BY REGION, 2020–2024 (USD MILLION)
TABLE 98
MANAGED GEN AI SERVICES: GENERATIVE AI MARKET, BY REGION, 2025–2032 (USD MILLION)
TABLE 99
GENERATIVE AI MARKET, BY DATA MODALITY, 2020–2024 (USD MILLION)
TABLE 100
GENERATIVE AI MARKET, BY DATA MODALITY, 2025–2032 (USD MILLION)
TABLE 101
TEXT: GENERATIVE AI MARKET, BY REGION, 2020–2024 (USD MILLION)
TABLE 102
TEXT: GENERATIVE AI MARKET, BY REGION, 2025–2032 (USD MILLION)
TABLE 103
IMAGE: GENERATIVE AI MARKET, BY REGION, 2020–2024 (USD MILLION)
TABLE 104
IMAGE: GENERATIVE AI MARKET, BY REGION, 2025–2032 (USD MILLION)
TABLE 105
VIDEO: GENERATIVE AI MARKET, BY REGION, 2020–2024 (USD MILLION)
TABLE 106
VIDEO: GENERATIVE AI MARKET, BY REGION, 2025–2032 (USD MILLION)
TABLE 107
AUDIO & SPEECH: GENERATIVE AI MARKET, BY REGION, 2020–2024 (USD MILLION)
TABLE 108
AUDIO & SPEECH: GENERATIVE AI MARKET, BY REGION, 2025–2032 (USD MILLION)
TABLE 109
CODE: GENERATIVE AI MARKET, BY REGION, 2020–2024 (USD MILLION)
TABLE 110
CODE: GENERATIVE AI MARKET, BY REGION, 2025–2032 (USD MILLION)
TABLE 111
MULTIMODAL: GENERATIVE AI MARKET, BY REGION, 2020–2024 (USD MILLION)
TABLE 112
MULTIMODAL: GENERATIVE AI MARKET, BY REGION, 2025–2032 (USD MILLION)
TABLE 113
GENERATIVE AI MARKET, BY APPLICATION, 2020–2024 (USD MILLION)
TABLE 114
GENERATIVE AI MARKET, BY APPLICATION, 2025–2032 (USD MILLION)
TABLE 115
APPLICATION: GENERATIVE AI MARKET, BY BUSINESS INTELLIGENCE & VISUALIZATION, 2020–2024 (USD MILLION)
TABLE 116
APPLICATION: GENERATIVE AI MARKET, BY BUSINESS INTELLIGENCE & VISUALIZATION, 2025–2032 (USD MILLION)
TABLE 117
SALES INTELLIGENCE: GENERATIVE AI MARKET, BY REGION, 2020–2024 (USD MILLION)
TABLE 118
SALES INTELLIGENCE: GENERATIVE AI MARKET, BY REGION, 2025–2032 (USD MILLION)
TABLE 119
MARKETING INTELLIGENCE: GENERATIVE AI MARKET, BY REGION, 2020–2024 (USD MILLION)
TABLE 120
MARKETING INTELLIGENCE: GENERATIVE AI MARKET, BY REGION, 2025–2032 (USD MILLION)
TABLE 121
HUMAN RESOURCE INTELLIGENCE: GENERATIVE AI MARKET, BY REGION, 2020–2024 (USD MILLION)
TABLE 122
HUMAN RESOURCE INTELLIGENCE: GENERATIVE AI MARKET, BY REGION, 2025–2032 (USD MILLION)
TABLE 123
FINANCE INTELLIGENCE: GENERATIVE AI MARKET, BY REGION, 2020–2024 (USD MILLION)
TABLE 124
FINANCE INTELLIGENCE: GENERATIVE AI MARKET, BY REGION, 2025–2032 (USD MILLION)
TABLE 125
OPERATIONS & SUPPLY CHAIN INTELLIGENCE: GENERATIVE AI MARKET, BY REGION, 2020–2024 (USD MILLION)
TABLE 126
OPERATIONS & SUPPLY CHAIN INTELLIGENCE: GENERATIVE AI MARKET, BY REGION, 2025–2032 (USD MILLION)
TABLE 127
APPLICATION: GENERATIVE AI MARKET, BY CONTENT MANAGEMENT, 2020–2024 (USD MILLION)
TABLE 128
APPLICATION: GENERATIVE AI MARKET, BY CONTENT MANAGEMENT, 2025–2032 (USD MILLION)
TABLE 129
CONTENT GENERATION: GENERATIVE AI MARKET, BY REGION, 2020–2024 (USD MILLION)
TABLE 130
CONTENT GENERATION: GENERATIVE AI MARKET, BY REGION, 2025–2032 (USD MILLION)
TABLE 131
CONTENT CURATION, TAGGING, & CATEGORIZATION: GENERATIVE AI MARKET, BY REGION, 2020–2024 (USD MILLION)
TABLE 132
CONTENT CURATION, TAGGING, & CATEGORIZATION: GENERATIVE AI MARKET, BY REGION, 2025–2032 (USD MILLION)
TABLE 133
DIGITAL MARKETING: GENERATIVE AI MARKET, BY REGION, 2020–2024 (USD MILLION)
TABLE 134
DIGITAL MARKETING: GENERATIVE AI MARKET, BY REGION, 2025–2032 (USD MILLION)
TABLE 135
MEDIA EDITING: GENERATIVE AI MARKET, BY REGION, 2020–2024 (USD MILLION)
TABLE 136
MEDIA EDITING: GENERATIVE AI MARKET, BY REGION, 2025–2032 (USD MILLION)
TABLE 137
APPLICATION: GENERATIVE AI MARKET, BY SYNTHETIC DATA MANAGEMENT, 2020–2024 (USD MILLION)
TABLE 138
APPLICATION: GENERATIVE AI MARKET, BY SYNTHETIC DATA MANAGEMENT, 2025–2032 (USD MILLION)
TABLE 139
SYNTHETIC DATA AUGMENTATION: GENERATIVE AI MARKET, BY REGION, 2020–2024 (USD MILLION)
TABLE 140
SYNTHETIC DATA AUGMENTATION: GENERATIVE AI MARKET, BY REGION, 2025–2032 (USD MILLION)
TABLE 141
SYNTHETIC DATA TRAINING: GENERATIVE AI MARKET, BY REGION, 2020–2024 (USD MILLION)
TABLE 142
SYNTHETIC DATA TRAINING: GENERATIVE AI MARKET, BY REGION, 2025–2032 (USD MILLION)
TABLE 143
APPLICATION: GENERATIVE AI MARKET, BY SEARCH & DISCOVERY, 2020–2024 (USD MILLION)
TABLE 144
APPLICATION: GENERATIVE AI MARKET, BY SEARCH & DISCOVERY, 2025–2032 (USD MILLION)
TABLE 145
GENERAL SEARCH: GENERATIVE AI MARKET, BY REGION, 2020–2024 (USD MILLION)
TABLE 146
GENERAL SEARCH: GENERATIVE AI MARKET, BY REGION, 2025–2032 (USD MILLION)
TABLE 147
INSIGHT GENERATION: GENERATIVE AI MARKET, BY REGION, 2020–2024 (USD MILLION)
TABLE 148
INSIGHT GENERATION: GENERATIVE AI MARKET, BY REGION, 2025–2032 (USD MILLION)
TABLE 149
APPLICATION: GENERATIVE AI MARKET, BY AUTOMATION & INTEGRATION, 2020–2024 (USD MILLION)
TABLE 150
APPLICATION: GENERATIVE AI MARKET, BY AUTOMATION & INTEGRATION, 2025–2032 (USD MILLION)
TABLE 151
PERSONALIZATION & RECOMMENDATION SYSTEMS: GENERATIVE AI MARKET, BY REGION, 2020–2024 (USD MILLION)
TABLE 152
PERSONALIZATION & RECOMMENDATION SYSTEMS: GENERATIVE AI MARKET, BY REGION, 2025–2032 (USD MILLION)
TABLE 153
CUSTOMER EXPERIENCE MANAGEMENT: GENERATIVE AI MARKET, BY REGION, 2020–2024 (USD MILLION)
TABLE 154
CUSTOMER EXPERIENCE MANAGEMENT: GENERATIVE AI MARKET, BY REGION, 2025–2032 (USD MILLION)
TABLE 155
APPLICATION DEVELOPMENT & API INTEGRATION: GENERATIVE AI MARKET, BY REGION, 2020–2024 (USD MILLION)
TABLE 156
APPLICATION DEVELOPMENT & API INTEGRATION: GENERATIVE AI MARKET, BY REGION, 2025–2032 (USD MILLION)
TABLE 157
CYBERSECURITY INTELLIGENCE: GENERATIVE AI MARKET, BY REGION, 2020–2024 (USD MILLION)
TABLE 158
CYBERSECURITY INTELLIGENCE: GENERATIVE AI MARKET, BY REGION, 2025–2032 (USD MILLION)
TABLE 159
APPLICATION: GENERATIVE AI MARKET, BY GENERATIVE DESIGN AI, 2020–2024 (USD MILLION)
TABLE 160
APPLICATION: GENERATIVE AI MARKET, BY GENERATIVE DESIGN AI, 2025–2032 (USD MILLION)
TABLE 161
DESIGN EXPLORATION & VARIATION: GENERATIVE AI MARKET, BY REGION, 2020–2024 (USD MILLION)
TABLE 162
DESIGN EXPLORATION & VARIATION: GENERATIVE AI MARKET, BY REGION, 2025–2032 (USD MILLION)
TABLE 163
MODELING & PROTOTYPING: GENERATIVE AI MARKET, BY REGION, 2020–2024 (USD MILLION)
TABLE 164
MODELING & PROTOTYPING: GENERATIVE AI MARKET, BY REGION, 2025–2032 (USD MILLION)
TABLE 165
PRODUCT RENDERING & VISUAL COLLATERALS: GENERATIVE AI MARKET, BY REGION, 2020–2024 (USD MILLION)
TABLE 166
PRODUCT RENDERING & VISUAL COLLATERALS: GENERATIVE AI MARKET, BY REGION, 2025–2032 (USD MILLION)
TABLE 167
OTHER APPLICATIONS: GENERATIVE AI MARKET, BY REGION, 2020–2024 (USD MILLION)
TABLE 168
OTHER APPLICATIONS: GENERATIVE AI MARKET, BY REGION, 2025–2032 (USD MILLION)
TABLE 169
GENERATIVE AI MARKET, BY END USER, 2020–2024 (USD MILLION)
TABLE 170
GENERATIVE AI MARKET, BY END USER, 2025–2032 (USD MILLION)
TABLE 171
CONSUMERS: GENERATIVE AI MARKET, BY REGION, 2020–2024 (USD MILLION)
TABLE 172
CONSUMERS: GENERATIVE AI MARKET, BY REGION, 2025–2032 (USD MILLION)
TABLE 173
ENTERPRISES: GENERATIVE AI MARKET, BY TYPE, 2020–2024 (USD MILLION)
TABLE 174
ENTERPRISES: GENERATIVE AI MARKET, BY TYPE, 2025–2032 (USD MILLION)
TABLE 175
BFSI: GENERATIVE AI MARKET, BY USE CASE, 2020–2024 (USD MILLION)
TABLE 176
BFSI: GENERATIVE AI MARKET, BY USE CASE, 2025–2032 (USD MILLION)
TABLE 177
BFSI: GENERATIVE AI MARKET, BY REGION, 2020–2024 (USD MILLION)
TABLE 178
BFSI: GENERATIVE AI MARKET, BY REGION, 2025–2032 (USD MILLION)
TABLE 179
RETAIL & E-COMMERCE: GENERATIVE AI MARKET, BY USE CASE, 2020–2024 (USD MILLION)
TABLE 180
RETAIL & E-COMMERCE: GENERATIVE AI MARKET, BY USE CASE, 2025–2032 (USD MILLION)
TABLE 181
RETAIL & E-COMMERCE: GENERATIVE AI MARKET, BY REGION, 2020–2024 (USD MILLION)
TABLE 182
RETAIL & E-COMMERCE: GENERATIVE AI MARKET, BY REGION, 2025–2032 (USD MILLION)
TABLE 183
GOVERNMENT & DEFENSE: GENERATIVE AI MARKET, BY USE CASE, 2020–2024 (USD MILLION)
TABLE 184
GOVERNMENT & DEFENSE: GENERATIVE AI MARKET, BY USE CASE, 2025–2032 (USD MILLION)
TABLE 185
GOVERNMENT & DEFENSE: GENERATIVE AI MARKET, BY REGION, 2020–2024 (USD MILLION)
TABLE 186
GOVERNMENT & DEFENSE: GENERATIVE AI MARKET, BY REGION, 2025–2032 (USD MILLION)
TABLE 187
TELECOMMUNICATIONS: GENERATIVE AI MARKET, BY USE CASE, 2020–2024 (USD MILLION)
TABLE 188
TELECOMMUNICATIONS: GENERATIVE AI MARKET, BY USE CASE, 2025–2032 (USD MILLION)
TABLE 189
TELECOMMUNICATIONS: GENERATIVE AI MARKET, BY REGION, 2020–2024 (USD MILLION)
TABLE 190
TELECOMMUNICATIONS: GENERATIVE AI MARKET, BY REGION, 2025–2032 (USD MILLION)
TABLE 191
MEDIA & ENTERTAINMENT: GENERATIVE AI MARKET, BY USE CASE, 2020–2024 (USD MILLION)
TABLE 192
MEDIA & ENTERTAINMENT: GENERATIVE AI MARKET, BY USE CASE, 2025–2032 (USD MILLION)
TABLE 193
MEDIA & ENTERTAINMENT: GENERATIVE AI MARKET, BY REGION, 2020–2024 (USD MILLION)
TABLE 194
MEDIA & ENTERTAINMENT: GENERATIVE AI MARKET, BY REGION, 2025–2032 (USD MILLION)
TABLE 195
TRANSPORTATION & LOGISTICS: GENERATIVE AI MARKET, BY USE CASE, 2020–2024 (USD MILLION)
TABLE 196
TRANSPORTATION & LOGISTICS: GENERATIVE AI MARKET, BY USE CASE, 2025–2032 (USD MILLION)
TABLE 197
TRANSPORTATION & LOGISTICS: GENERATIVE AI MARKET, BY REGION, 2020–2024 (USD MILLION)
TABLE 198
TRANSPORTATION & LOGISTICS: GENERATIVE AI MARKET, BY REGION, 2025–2032 (USD MILLION)
TABLE 199
MANUFACTURING: GENERATIVE AI MARKET, BY USE CASE, 2020–2024 (USD MILLION)
TABLE 200
MANUFACTURING: GENERATIVE AI MARKET, BY USE CASE, 2025–2032 (USD MILLION)
TABLE 201
MANUFACTURING: GENERATIVE AI MARKET, BY REGION, 2020–2024 (USD MILLION)
TABLE 202
MANUFACTURING: GENERATIVE AI MARKET, BY REGION, 2025–2032 (USD MILLION)
TABLE 203
HEALTHCARE & LIFE SCIENCES: GENERATIVE AI MARKET, BY USE CASE, 2020–2024 (USD MILLION)
TABLE 204
HEALTHCARE & LIFE SCIENCES: GENERATIVE AI MARKET, BY USE CASE, 2025–2032 (USD MILLION)
TABLE 205
HEALTHCARE & LIFE SCIENCES: GENERATIVE AI MARKET, BY REGION, 2020–2024 (USD MILLION)
TABLE 206
HEALTHCARE & LIFE SCIENCES: GENERATIVE AI MARKET, BY REGION, 2025–2032 (USD MILLION)
TABLE 207
SOFTWARE & TECHNOLOGY PROVIDERS: GENERATIVE AI MARKET, BY USE CASE, 2020–2024 (USD MILLION)
TABLE 208
SOFTWARE & TECHNOLOGY PROVIDERS: GENERATIVE AI MARKET, BY USE CASE, 2025–2032 (USD MILLION)
TABLE 209
SOFTWARE & TECHNOLOGY PROVIDERS: GENERATIVE AI MARKET, BY REGION, 2020–2024 (USD MILLION)
TABLE 210
SOFTWARE & TECHNOLOGY PROVIDERS: GENERATIVE AI MARKET, BY REGION, 2025–2032 (USD MILLION)
TABLE 211
ENERGY & UTILITIES: GENERATIVE AI MARKET, BY USE CASE, 2020–2024 (USD MILLION)
TABLE 212
ENERGY & UTILITIES: GENERATIVE AI MARKET, BY USE CASE, 2025–2032 (USD MILLION)
TABLE 213
ENERGY & UTILITIES: GENERATIVE AI MARKET, BY REGION, 2020–2024 (USD MILLION)
TABLE 214
ENERGY & UTILITIES: GENERATIVE AI MARKET, BY REGION, 2025–2032 (USD MILLION)
TABLE 215
OTHER ENTERPRISES: GENERATIVE AI MARKET, BY REGION, 2020–2024 (USD MILLION)
TABLE 216
OTHER ENTERPRISES: GENERATIVE AI MARKET, BY REGION, 2025–2032 (USD MILLION)
TABLE 217
GENERATIVE AI MARKET, BY REGION, 2020–2024 (USD MILLION)
TABLE 218
GENERATIVE AI MARKET, BY REGION, 2025–2032 (USD MILLION)
TABLE 219
NORTH AMERICA: GENERATIVE AI MARKET, BY OFFERING, 2020–2024 (USD MILLION)
TABLE 220
NORTH AMERICA: GENERATIVE AI MARKET, BY OFFERING, 2025–2032 (USD MILLION)
TABLE 221
NORTH AMERICA: GENERATIVE AI MARKET, BY INFRASTRUCTURE, 2020–2024 (USD MILLION)
TABLE 222
NORTH AMERICA: GENERATIVE AI MARKET, BY INFRASTRUCTURE, 2025–2032 (USD MILLION)
TABLE 223
NORTH AMERICA: GENERATIVE AI MARKET, BY SOFTWARE, 2020–2024 (USD MILLION)
TABLE 224
NORTH AMERICA: GENERATIVE AI MARKET, BY SOFTWARE, 2025–2032 (USD MILLION)
TABLE 225
NORTH AMERICA: GENERATIVE AI MARKET, BY SERVICE, 2020–2024 (USD MILLION)
TABLE 226
NORTH AMERICA: GENERATIVE AI MARKET, BY SERVICE, 2025–2032 (USD MILLION)
TABLE 227
NORTH AMERICA: GENERATIVE AI MARKET, BY DATA MODALITY, 2020–2024 (USD MILLION)
TABLE 228
NORTH AMERICA: GENERATIVE AI MARKET, BY DATA MODALITY, 2025–2032 (USD MILLION)
TABLE 229
NORTH AMERICA: GENERATIVE AI MARKET, BY APPLICATION, 2020–2024 (USD MILLION)
TABLE 230
NORTH AMERICA: GENERATIVE AI MARKET, BY APPLICATION, 2025–2032 (USD MILLION)
TABLE 231
NORTH AMERICA: GENERATIVE AI MARKET, BY END USER, 2020–2024 (USD MILLION)
TABLE 232
NORTH AMERICA: GENERATIVE AI MARKET, BY END USER, 2025–2032 (USD MILLION)
TABLE 233
NORTH AMERICA: GENERATIVE AI MARKET, BY ENTERPRISE, 2020–2024 (USD MILLION)
TABLE 234
NORTH AMERICA: GENERATIVE AI MARKET, BY ENTERPRISE, 2025–2032 (USD MILLION)
TABLE 235
NORTH AMERICA: GENERATIVE AI MARKET, BY BFSI, 2020–2024 (USD MILLION)
TABLE 236
NORTH AMERICA: GENERATIVE AI MARKET, BY BFSI, 2025–2032 (USD MILLION)
TABLE 237
NORTH AMERICA: GENERATIVE AI MARKET, BY RETAIL & E-COMMERCE, 2020–2024 (USD MILLION)
TABLE 238
NORTH AMERICA: GENERATIVE AI MARKET, BY RETAIL & E-COMMERCE, 2025–2032 (USD MILLION)
TABLE 239
NORTH AMERICA: GENERATIVE AI MARKET, BY GOVERNMENT & DEFENSE, 2020–2024 (USD MILLION)
TABLE 240
NORTH AMERICA: GENERATIVE AI MARKET, BY GOVERNMENT & DEFENSE, 2025–2032 (USD MILLION)
TABLE 241
NORTH AMERICA: GENERATIVE AI MARKET, BY TELECOMMUNICATION, 2020–2024 (USD MILLION)
TABLE 242
NORTH AMERICA: GENERATIVE AI MARKET, BY TELECOMMUNICATION, 2025–2032 (USD MILLION)
TABLE 243
NORTH AMERICA: GENERATIVE AI MARKET, BY MEDIA & ENTERTAINMENT, 2020–2024 (USD MILLION)
TABLE 244
NORTH AMERICA: GENERATIVE AI MARKET, BY MEDIA & ENTERTAINMENT, 2025–2032 (USD MILLION)
TABLE 245
NORTH AMERICA: GENERATIVE AI MARKET, BY TRANSPORTATION & LOGISTICS, 2020–2024 (USD MILLION)
TABLE 246
NORTH AMERICA: GENERATIVE AI MARKET, BY TRANSPORTATION & LOGISTICS, 2025–2032 (USD MILLION)
TABLE 247
NORTH AMERICA: GENERATIVE AI MARKET, BY MANUFACTURING, 2020–2024 (USD MILLION)
TABLE 248
NORTH AMERICA: GENERATIVE AI MARKET, BY MANUFACTURING, 2025–2032 (USD MILLION)
TABLE 249
NORTH AMERICA: GENERATIVE AI MARKET, BY HEALTHCARE & LIFE SCIENCE, 2020–2024 (USD MILLION)
TABLE 250
NORTH AMERICA: GENERATIVE AI MARKET, BY HEALTHCARE & LIFE SCIENCE, 2025–2032 (USD MILLION)
TABLE 251
NORTH AMERICA: GENERATIVE AI MARKET, BY SOFTWARE & TECHNOLOGY PROVIDER, 2020–2024 (USD MILLION)
TABLE 252
NORTH AMERICA: GENERATIVE AI MARKET, BY SOFTWARE & TECHNOLOGY PROVIDER, 2025–2032 (USD MILLION)
TABLE 253
NORTH AMERICA: GENERATIVE AI MARKET, BY ENERGY & UTILITY, 2020–2024 (USD MILLION)
TABLE 254
NORTH AMERICA: GENERATIVE AI MARKET, BY ENERGY & UTILITY, 2025–2032 (USD MILLION)
TABLE 255
NORTH AMERICA: GENERATIVE AI MARKET, BY COUNTRY, 2020–2024 (USD MILLION)
TABLE 256
NORTH AMERICA: GENERATIVE AI MARKET, BY COUNTRY, 2025–2032 (USD MILLION)
TABLE 257
US: GENERATIVE AI MARKET, BY OFFERING, 2020–2024 (USD MILLION)
TABLE 258
US: GENERATIVE AI MARKET, BY OFFERING, 2025–2032 (USD MILLION)
TABLE 259
CANADA: GENERATIVE AI MARKET, BY OFFERING, 2020–2024 (USD MILLION)
TABLE 260
CANADA: GENERATIVE AI MARKET, BY OFFERING, 2025–2032 (USD MILLION)
TABLE 261
EUROPE: GENERATIVE AI MARKET, BY OFFERING, 2020–2024 (USD MILLION)
TABLE 262
EUROPE: GENERATIVE AI MARKET, BY OFFERING, 2025–2032 (USD MILLION)
TABLE 263
EUROPE: GENERATIVE AI MARKET, BY INFRASTRUCTURE, 2020–2024 (USD MILLION)
TABLE 264
EUROPE: GENERATIVE AI MARKET, BY INFRASTRUCTURE, 2025–2032 (USD MILLION)
TABLE 265
EUROPE: GENERATIVE AI MARKET, BY SOFTWARE, 2020–2024 (USD MILLION)
TABLE 266
EUROPE: GENERATIVE AI MARKET, BY SOFTWARE, 2025–2032 (USD MILLION)
TABLE 267
EUROPE: GENERATIVE AI MARKET, BY SERVICE, 2020–2024 (USD MILLION)
TABLE 268
EUROPE: GENERATIVE AI MARKET, BY SERVICE, 2025–2032 (USD MILLION)
TABLE 269
EUROPE: GENERATIVE AI MARKET, BY DATA MODALITY, 2020–2024 (USD MILLION)
TABLE 270
EUROPE: GENERATIVE AI MARKET, BY DATA MODALITY, 2025–2032 (USD MILLION)
TABLE 271
EUROPE: GENERATIVE AI MARKET, BY APPLICATION, 2020–2024 (USD MILLION)
TABLE 272
EUROPE: GENERATIVE AI MARKET, BY APPLICATION, 2025–2032 (USD MILLION)
TABLE 273
EUROPE: GENERATIVE AI MARKET, BY END USER, 2020–2024 (USD MILLION)
TABLE 274
EUROPE: GENERATIVE AI MARKET, BY END USER, 2025–2032 (USD MILLION)
TABLE 275
EUROPE: GENERATIVE AI MARKET, BY ENTERPRISE, 2020–2024 (USD MILLION)
TABLE 276
EUROPE: GENERATIVE AI MARKET, BY ENTERPRISE, 2025–2032 (USD MILLION)
TABLE 277
EUROPE: GENERATIVE AI MARKET, BY BFSI, 2020–2024 (USD MILLION)
TABLE 278
EUROPE: GENERATIVE AI MARKET, BY BFSI, 2025–2032 (USD MILLION)
TABLE 279
EUROPE: GENERATIVE AI MARKET, BY RETAIL & E-COMMERCE, 2020–2024 (USD MILLION)
TABLE 280
EUROPE: GENERATIVE AI MARKET, BY RETAIL & E-COMMERCE, 2025–2032 (USD MILLION)
TABLE 281
EUROPE: GENERATIVE AI MARKET, BY GOVERNMENT & DEFENSE, 2020–2024 (USD MILLION)
TABLE 282
EUROPE: GENERATIVE AI MARKET, BY GOVERNMENT & DEFENSE, 2025–2032 (USD MILLION)
TABLE 283
EUROPE: GENERATIVE AI MARKET, BY TELECOMMUNICATION, 2020–2024 (USD MILLION)
TABLE 284
EUROPE: GENERATIVE AI MARKET, BY TELECOMMUNICATION, 2025–2032 (USD MILLION)
TABLE 285
EUROPE: GENERATIVE AI MARKET, BY MEDIA & ENTERTAINMENT, 2020–2024 (USD MILLION)
TABLE 286
EUROPE: GENERATIVE AI MARKET, BY MEDIA & ENTERTAINMENT, 2025–2032 (USD MILLION)
TABLE 287
EUROPE: GENERATIVE AI MARKET, BY TRANSPORTATION & LOGISTICS, 2020–2024 (USD MILLION)
TABLE 288
EUROPE: GENERATIVE AI MARKET, BY TRANSPORTATION & LOGISTICS, 2025–2032 (USD MILLION)
TABLE 289
EUROPE: GENERATIVE AI MARKET, BY MANUFACTURING, 2020–2024 (USD MILLION)
TABLE 290
EUROPE: GENERATIVE AI MARKET, BY MANUFACTURING, 2025–2032 (USD MILLION)
TABLE 291
EUROPE: GENERATIVE AI MARKET, BY HEALTHCARE & LIFE SCIENCE, 2020–2024 (USD MILLION)
TABLE 292
EUROPE: GENERATIVE AI MARKET, BY HEALTHCARE & LIFE SCIENCE, 2025–2032 (USD MILLION)
TABLE 293
EUROPE: GENERATIVE AI MARKET, BY SOFTWARE & TECHNOLOGY PROVIDER, 2020–2024 (USD MILLION)
TABLE 294
EUROPE: GENERATIVE AI MARKET, BY SOFTWARE & TECHNOLOGY PROVIDER, 2025–2032 (USD MILLION)
TABLE 295
EUROPE: GENERATIVE AI MARKET, BY ENERGY & UTILITY, 2020–2024 (USD MILLION)
TABLE 296
EUROPE: GENERATIVE AI MARKET, BY ENERGY & UTILITY, 2025–2032 (USD MILLION)
TABLE 297
EUROPE: GENERATIVE AI MARKET, BY COUNTRY, 2020–2024 (USD MILLION)
TABLE 298
EUROPE: GENERATIVE AI MARKET, BY COUNTRY, 2025–2032 (USD MILLION)
TABLE 299
UK: GENERATIVE AI MARKET, BY OFFERING, 2020–2024 (USD MILLION)
TABLE 300
UK: GENERATIVE AI MARKET, BY OFFERING, 2025–2032 (USD MILLION)
TABLE 301
GERMANY: GENERATIVE AI MARKET, BY OFFERING, 2020–2024 (USD MILLION)
TABLE 302
GERMANY: GENERATIVE AI MARKET, BY OFFERING, 2025–2032 (USD MILLION)
TABLE 303
FRANCE: GENERATIVE AI MARKET, BY OFFERING, 2020–2024 (USD MILLION)
TABLE 304
FRANCE: GENERATIVE AI MARKET, BY OFFERING, 2025–2032 (USD MILLION)
TABLE 305
ITALY: GENERATIVE AI MARKET, BY OFFERING, 2020–2024 (USD MILLION)
TABLE 306
ITALY: GENERATIVE AI MARKET, BY OFFERING, 2025–2032 (USD MILLION)
TABLE 307
SPAIN: GENERATIVE AI MARKET, BY OFFERING, 2020–2024 (USD MILLION)
TABLE 308
SPAIN: GENERATIVE AI MARKET, BY OFFERING, 2025–2032 (USD MILLION)
TABLE 309
FINLAND: GENERATIVE AI MARKET, BY OFFERING, 2020–2024 (USD MILLION)
TABLE 310
FINLAND: GENERATIVE AI MARKET, BY OFFERING, 2025–2032 (USD MILLION)
TABLE 311
REST OF EUROPE: GENERATIVE AI MARKET, BY OFFERING, 2020–2024 (USD MILLION)
TABLE 312
REST OF EUROPE: GENERATIVE AI MARKET, BY OFFERING, 2025–2032 (USD MILLION)
TABLE 313
ASIA PACIFIC: GENERATIVE AI MARKET, BY OFFERING, 2020–2024 (USD MILLION)
TABLE 314
ASIA PACIFIC: GENERATIVE AI MARKET, BY OFFERING, 2025–2032 (USD MILLION)
TABLE 315
ASIA PACIFIC: GENERATIVE AI MARKET, BY INFRASTRUCTURE, 2020–2024 (USD MILLION)
TABLE 316
ASIA PACIFIC: GENERATIVE AI MARKET, BY INFRASTRUCTURE, 2025–2032 (USD MILLION)
TABLE 317
ASIA PACIFIC: GENERATIVE AI MARKET, BY SOFTWARE, 2020–2024 (USD MILLION)
TABLE 318
ASIA PACIFIC: GENERATIVE AI MARKET, BY SOFTWARE, 2025–2032 (USD MILLION)
TABLE 319
ASIA PACIFIC: GENERATIVE AI MARKET, BY SERVICE, 2020–2024 (USD MILLION)
TABLE 320
ASIA PACIFIC: GENERATIVE AI MARKET, BY SERVICE, 2025–2032 (USD MILLION)
TABLE 321
ASIA PACIFIC: GENERATIVE AI MARKET, BY DATA MODALITY, 2020–2024 (USD MILLION)
TABLE 322
ASIA PACIFIC: GENERATIVE AI MARKET, BY DATA MODALITY, 2025–2032 (USD MILLION)
TABLE 323
ASIA PACIFIC: GENERATIVE AI MARKET, BY APPLICATION, 2020–2024 (USD MILLION)
TABLE 324
ASIA PACIFIC: GENERATIVE AI MARKET, BY APPLICATION, 2025–2032 (USD MILLION)
TABLE 325
ASIA PACIFIC: GENERATIVE AI MARKET, BY END USER, 2020–2024 (USD MILLION)
TABLE 326
ASIA PACIFIC: GENERATIVE AI MARKET, BY END USER, 2025–2032 (USD MILLION)
TABLE 327
ASIA PACIFIC: GENERATIVE AI MARKET, BY ENTERPRISE, 2020–2024 (USD MILLION)
TABLE 328
ASIA PACIFIC: GENERATIVE AI MARKET, BY ENTERPRISE, 2025–2032 (USD MILLION)
TABLE 329
ASIA PACIFIC: GENERATIVE AI MARKET, BY BFSI, 2020–2024 (USD MILLION)
TABLE 330
ASIA PACIFIC: GENERATIVE AI MARKET, BY BFSI, 2025–2032 (USD MILLION)
TABLE 331
ASIA PACIFIC: GENERATIVE AI MARKET, BY RETAIL & E-COMMERCE, 2020–2024 (USD MILLION)
TABLE 332
ASIA PACIFIC: GENERATIVE AI MARKET, BY RETAIL & E-COMMERCE, 2025–2032 (USD MILLION)
TABLE 333
ASIA PACIFIC: GENERATIVE AI MARKET, BY GOVERNMENT & DEFENSE, 2020–2024 (USD MILLION)
TABLE 334
ASIA PACIFIC: GENERATIVE AI MARKET, BY GOVERNMENT & DEFENSE, 2025–2032 (USD MILLION)
TABLE 335
ASIA PACIFIC: GENERATIVE AI MARKET, BY TELECOMMUNICATION, 2020–2024 (USD MILLION)
TABLE 336
ASIA PACIFIC: GENERATIVE AI MARKET, BY TELECOMMUNICATION, 2025–2032 (USD MILLION)
TABLE 337
ASIA PACIFIC: GENERATIVE AI MARKET, BY MEDIA & ENTERTAINMENT, 2020–2024 (USD MILLION)
TABLE 338
ASIA PACIFIC: GENERATIVE AI MARKET, BY MEDIA & ENTERTAINMENT, 2025–2032 (USD MILLION)
TABLE 339
ASIA PACIFIC: GENERATIVE AI MARKET, BY TRANSPORTATION & LOGISTICS, 2020–2024 (USD MILLION)
TABLE 340
ASIA PACIFIC: GENERATIVE AI MARKET, BY TRANSPORTATION & LOGISTICS, 2025–2032 (USD MILLION)
TABLE 341
ASIA PACIFIC: GENERATIVE AI MARKET, BY MANUFACTURING, 2020–2024 (USD MILLION)
TABLE 342
ASIA PACIFIC: GENERATIVE AI MARKET, BY MANUFACTURING, 2025–2032 (USD MILLION)
TABLE 343
ASIA PACIFIC: GENERATIVE AI MARKET, BY HEALTHCARE & LIFE SCIENCE, 2020–2024 (USD MILLION)
TABLE 344
ASIA PACIFIC: GENERATIVE AI MARKET, BY HEALTHCARE & LIFE SCIENCE, 2025–2032 (USD MILLION)
TABLE 345
ASIA PACIFIC: GENERATIVE AI MARKET, BY SOFTWARE & TECHNOLOGY PROVIDER, 2020–2024 (USD MILLION)
TABLE 346
ASIA PACIFIC: GENERATIVE AI MARKET, BY SOFTWARE & TECHNOLOGY PROVIDER, 2025–2032 (USD MILLION)
TABLE 347
ASIA PACIFIC: GENERATIVE AI MARKET, BY ENERGY & UTILITY, 2020–2024 (USD MILLION)
TABLE 348
ASIA PACIFIC: GENERATIVE AI MARKET, BY ENERGY & UTILITY, 2025–2032 (USD MILLION)
TABLE 349
ASIA PACIFIC: GENERATIVE AI MARKET, BY COUNTRY, 2020–2024 (USD MILLION)
TABLE 350
ASIA PACIFIC: GENERATIVE AI MARKET, BY COUNTRY, 2025–2032 (USD MILLION)
TABLE 351
CHINA: GENERATIVE AI MARKET, BY OFFERING, 2020–2024 (USD MILLION)
TABLE 352
CHINA: GENERATIVE AI MARKET, BY OFFERING, 2025–2032 (USD MILLION)
TABLE 353
INDIA: GENERATIVE AI MARKET, BY OFFERING, 2020–2024 (USD MILLION)
TABLE 354
INDIA: GENERATIVE AI MARKET, BY OFFERING, 2025–2032 (USD MILLION)
TABLE 355
JAPAN: GENERATIVE AI MARKET, BY OFFERING, 2020–2024 (USD MILLION)
TABLE 356
JAPAN: GENERATIVE AI MARKET, BY OFFERING, 2025–2032 (USD MILLION)
TABLE 357
SOUTH KOREA: GENERATIVE AI MARKET, BY OFFERING, 2020–2024 (USD MILLION)
TABLE 358
SOUTH KOREA: GENERATIVE AI MARKET, BY OFFERING, 2025–2032 (USD MILLION)
TABLE 359
SINGAPORE: GENERATIVE AI MARKET, BY OFFERING, 2020–2024 (USD MILLION)
TABLE 360
SINGAPORE: GENERATIVE AI MARKET, BY OFFERING, 2025–2032 (USD MILLION)
TABLE 361
AUSTRALIA & NEW ZEALAND: GENERATIVE AI MARKET, BY OFFERING, 2020–2024 (USD MILLION)
TABLE 362
AUSTRALIA & NEW ZEALAND: GENERATIVE AI MARKET, BY OFFERING, 2025–2032 (USD MILLION)
TABLE 363
REST OF ASIA PACIFIC: GENERATIVE AI MARKET, BY OFFERING, 2020–2024 (USD MILLION)
TABLE 364
REST OF ASIA PACIFIC: GENERATIVE AI MARKET, BY OFFERING, 2025–2032 (USD MILLION)
TABLE 365
MIDDLE EAST & AFRICA: GENERATIVE AI MARKET, BY OFFERING, 2020–2024 (USD MILLION)
TABLE 366
MIDDLE EAST & AFRICA: GENERATIVE AI MARKET, BY OFFERING, 2025–2032 (USD MILLION)
TABLE 367
MIDDLE EAST & AFRICA: GENERATIVE AI MARKET, BY INFRASTRUCTURE, 2020–2024 (USD MILLION)
TABLE 368
MIDDLE EAST & AFRICA: GENERATIVE AI MARKET, BY INFRASTRUCTURE, 2025–2032 (USD MILLION)
TABLE 369
MIDDLE EAST & AFRICA: GENERATIVE AI MARKET, BY SOFTWARE, 2020–2024 (USD MILLION)
TABLE 370
MIDDLE EAST & AFRICA: GENERATIVE AI MARKET, BY SOFTWARE, 2025–2032 (USD MILLION)
TABLE 371
MIDDLE EAST & AFRICA: GENERATIVE AI MARKET, BY SERVICE, 2020–2024 (USD MILLION)
TABLE 372
MIDDLE EAST & AFRICA: GENERATIVE AI MARKET, BY SERVICE, 2025–2032 (USD MILLION)
TABLE 373
MIDDLE EAST & AFRICA: GENERATIVE AI MARKET, BY DATA MODALITY, 2020–2024 (USD MILLION)
TABLE 374
MIDDLE EAST & AFRICA: GENERATIVE AI MARKET, BY DATA MODALITY, 2025–2032 (USD MILLION)
TABLE 375
MIDDLE EAST & AFRICA: GENERATIVE AI MARKET, BY APPLICATION, 2020–2024 (USD MILLION)
TABLE 376
MIDDLE EAST & AFRICA: GENERATIVE AI MARKET, BY APPLICATION, 2025–2032 (USD MILLION)
TABLE 377
MIDDLE EAST & AFRICA: GENERATIVE AI MARKET, BY END USER, 2020–2024 (USD MILLION)
TABLE 378
MIDDLE EAST & AFRICA: GENERATIVE AI MARKET, BY END USER, 2025–2032 (USD MILLION)
TABLE 379
MIDDLE EAST & AFRICA: GENERATIVE AI MARKET, BY ENTERPRISE, 2020–2024 (USD MILLION)
TABLE 380
MIDDLE EAST & AFRICA: GENERATIVE AI MARKET, BY ENTERPRISE, 2025–2032 (USD MILLION)
TABLE 381
MIDDLE EAST & AFRICA: GENERATIVE AI MARKET, BY BFSI, 2020–2024 (USD MILLION)
TABLE 382
MIDDLE EAST & AFRICA: GENERATIVE AI MARKET, BY BFSI, 2025–2032 (USD MILLION)
TABLE 383
MIDDLE EAST & AFRICA: GENERATIVE AI MARKET, BY RETAIL & E-COMMERCE, 2020–2024 (USD MILLION)
TABLE 384
MIDDLE EAST & AFRICA: GENERATIVE AI MARKET, BY RETAIL & E-COMMERCE, 2025–2032 (USD MILLION)
TABLE 385
MIDDLE EAST & AFRICA: GENERATIVE AI MARKET, BY GOVERNMENT & DEFENSE, 2020–2024 (USD MILLION)
TABLE 386
MIDDLE EAST & AFRICA: GENERATIVE AI MARKET, BY GOVERNMENT & DEFENSE, 2025–2032 (USD MILLION)
TABLE 387
MIDDLE EAST & AFRICA: GENERATIVE AI MARKET, BY TELECOMMUNICATION, 2020–2024 (USD MILLION)
TABLE 388
MIDDLE EAST & AFRICA: GENERATIVE AI MARKET, BY TELECOMMUNICATION, 2025–2032 (USD MILLION)
TABLE 389
MIDDLE EAST & AFRICA: GENERATIVE AI MARKET, BY MEDIA & ENTERTAINMENT, 2020–2024 (USD MILLION)
TABLE 390
MIDDLE EAST & AFRICA: GENERATIVE AI MARKET, BY MEDIA & ENTERTAINMENT, 2025–2032 (USD MILLION)
TABLE 391
MIDDLE EAST & AFRICA: GENERATIVE AI MARKET, BY TRANSPORTATION & LOGISTICS, 2020–2024 (USD MILLION)
TABLE 392
MIDDLE EAST & AFRICA: GENERATIVE AI MARKET, BY TRANSPORTATION & LOGISTICS, 2025–2032 (USD MILLION)
TABLE 393
MIDDLE EAST & AFRICA: GENERATIVE AI MARKET, BY MANUFACTURING, 2020–2024 (USD MILLION)
TABLE 394
MIDDLE EAST & AFRICA: GENERATIVE AI MARKET, BY MANUFACTURING, 2025–2032 (USD MILLION)
TABLE 395
MIDDLE EAST & AFRICA: GENERATIVE AI MARKET, BY HEALTHCARE & LIFE SCIENCE, 2020–2024 (USD MILLION)
TABLE 396
MIDDLE EAST & AFRICA: GENERATIVE AI MARKET, BY HEALTHCARE & LIFE SCIENCE, 2025–2032 (USD MILLION)
TABLE 397
MIDDLE EAST & AFRICA: GENERATIVE AI MARKET, BY SOFTWARE & TECHNOLOGY PROVIDER, 2020–2024 (USD MILLION)
TABLE 398
MIDDLE EAST & AFRICA: GENERATIVE AI MARKET, BY SOFTWARE & TECHNOLOGY PROVIDER, 2025–2032 (USD MILLION)
TABLE 399
MIDDLE EAST & AFRICA: GENERATIVE AI MARKET, BY ENERGY & UTILITY, 2020–2024 (USD MILLION)
TABLE 400
MIDDLE EAST & AFRICA: GENERATIVE AI MARKET, BY ENERGY & UTILITY, 2025–2032 (USD MILLION)
TABLE 401
MIDDLE EAST & AFRICA: GENERATIVE AI MARKET, BY COUNTRY, 2020–2024 (USD MILLION)
TABLE 402
MIDDLE EAST & AFRICA: GENERATIVE AI MARKET, BY COUNTRY, 2025–2032 (USD MILLION)
TABLE 403
SAUDI ARABIA: GENERATIVE AI MARKET, BY OFFERING, 2020–2024 (USD MILLION)
TABLE 404
SAUDI ARABIA: GENERATIVE AI MARKET, BY OFFERING, 2025–2032 (USD MILLION)
TABLE 405
UAE: GENERATIVE AI MARKET, BY OFFERING, 2020–2024 (USD MILLION)
TABLE 406
UAE: GENERATIVE AI MARKET, BY OFFERING, 2025–2032 (USD MILLION)
TABLE 407
SOUTH AFRICA: GENERATIVE AI MARKET, BY OFFERING, 2020–2024 (USD MILLION)
TABLE 408
SOUTH AFRICA: GENERATIVE AI MARKET, BY OFFERING, 2025–2032 (USD MILLION)
TABLE 409
ISRAEL: GENERATIVE AI MARKET, BY OFFERING, 2020–2024 (USD MILLION)
TABLE 410
ISRAEL: GENERATIVE AI MARKET, BY OFFERING, 2025–2032 (USD MILLION)
TABLE 411
REST OF MIDDLE EAST & AFRICA: GENERATIVE AI MARKET, BY OFFERING, 2020–2024 (USD MILLION)
TABLE 412
REST OF MIDDLE EAST & AFRICA: GENERATIVE AI MARKET, BY OFFERING, 2025–2032 (USD MILLION)
TABLE 413
LATIN AMERICA: GENERATIVE AI MARKET, BY OFFERING, 2020–2024 (USD MILLION)
TABLE 414
LATIN AMERICA: GENERATIVE AI MARKET, BY OFFERING, 2025–2032 (USD MILLION)
TABLE 415
LATIN AMERICA: GENERATIVE AI MARKET, BY INFRASTRUCTURE, 2020–2024 (USD MILLION)
TABLE 416
LATIN AMERICA: GENERATIVE AI MARKET, BY INFRASTRUCTURE, 2025–2032 (USD MILLION)
TABLE 417
LATIN AMERICA: GENERATIVE AI MARKET, BY SOFTWARE, 2020–2024 (USD MILLION)
TABLE 418
LATIN AMERICA: GENERATIVE AI MARKET, BY SOFTWARE, 2025–2032 (USD MILLION)
TABLE 419
LATIN AMERICA: GENERATIVE AI MARKET, BY SERVICE, 2020–2024 (USD MILLION)
TABLE 420
LATIN AMERICA: GENERATIVE AI MARKET, BY SERVICE, 2025–2032 (USD MILLION)
TABLE 421
LATIN AMERICA: GENERATIVE AI MARKET, BY DATA MODALITY, 2020–2024 (USD MILLION)
TABLE 422
LATIN AMERICA: GENERATIVE AI MARKET, BY DATA MODALITY, 2025–2032 (USD MILLION)
TABLE 423
LATIN AMERICA: GENERATIVE AI MARKET, BY APPLICATION, 2020–2024 (USD MILLION)
TABLE 424
LATIN AMERICA: GENERATIVE AI MARKET, BY APPLICATION, 2025–2032 (USD MILLION)
TABLE 425
LATIN AMERICA: GENERATIVE AI MARKET, BY END USER, 2020–2024 (USD MILLION)
TABLE 426
LATIN AMERICA: GENERATIVE AI MARKET, BY END USER, 2025–2032 (USD MILLION)
TABLE 427
LATIN AMERICA: GENERATIVE AI MARKET, BY ENTERPRISE, 2020–2024 (USD MILLION)
TABLE 428
LATIN AMERICA: GENERATIVE AI MARKET, BY ENTERPRISE, 2025–2032 (USD MILLION)
TABLE 429
LATIN AMERICA: GENERATIVE AI MARKET, BY BFSI, 2020–2024 (USD MILLION)
TABLE 430
LATIN AMERICA: GENERATIVE AI MARKET, BY BFSI, 2025–2032 (USD MILLION)
TABLE 431
LATIN AMERICA: GENERATIVE AI MARKET, BY RETAIL & E-COMMERCE, 2020–2024 (USD MILLION)
TABLE 432
LATIN AMERICA: GENERATIVE AI MARKET, BY RETAIL & E-COMMERCE, 2025–2032 (USD MILLION)
TABLE 433
LATIN AMERICA: GENERATIVE AI MARKET, BY GOVERNMENT & DEFENSE, 2020–2024 (USD MILLION)
TABLE 434
LATIN AMERICA: GENERATIVE AI MARKET, BY GOVERNMENT & DEFENSE, 2025–2032 (USD MILLION)
TABLE 435
LATIN AMERICA: GENERATIVE AI MARKET, BY TELECOMMUNICATION, 2020–2024 (USD MILLION)
TABLE 436
LATIN AMERICA: GENERATIVE AI MARKET, BY TELECOMMUNICATION, 2025–2032 (USD MILLION)
TABLE 437
LATIN AMERICA: GENERATIVE AI MARKET, BY MEDIA & ENTERTAINMENT, 2020–2024 (USD MILLION)
TABLE 438
LATIN AMERICA: GENERATIVE AI MARKET, BY MEDIA & ENTERTAINMENT, 2025–2032 (USD MILLION)
TABLE 439
LATIN AMERICA: GENERATIVE AI MARKET, BY TRANSPORTATION & LOGISTICS, 2020–2024 (USD MILLION)
TABLE 440
LATIN AMERICA: GENERATIVE AI MARKET, BY TRANSPORTATION & LOGISTICS, 2025–2032 (USD MILLION)
TABLE 441
LATIN AMERICA: GENERATIVE AI MARKET, BY MANUFACTURING, 2020–2024 (USD MILLION)
TABLE 442
LATIN AMERICA: GENERATIVE AI MARKET, BY MANUFACTURING, 2025–2032 (USD MILLION)
TABLE 443
LATIN AMERICA: GENERATIVE AI MARKET, BY HEALTHCARE & LIFE SCIENCE, 2020–2024 (USD MILLION)
TABLE 444
LATIN AMERICA: GENERATIVE AI MARKET, BY HEALTHCARE & LIFE SCIENCE, 2025–2032 (USD MILLION)
TABLE 445
LATIN AMERICA: GENERATIVE AI MARKET, BY SOFTWARE & TECHNOLOGY PROVIDER, 2020–2024 (USD MILLION)
TABLE 446
LATIN AMERICA: GENERATIVE AI MARKET, BY SOFTWARE & TECHNOLOGY PROVIDER, 2025–2032 (USD MILLION)
TABLE 447
LATIN AMERICA: GENERATIVE AI MARKET, BY ENERGY & UTILITY, 2020–2024 (USD MILLION)
TABLE 448
LATIN AMERICA: GENERATIVE AI MARKET, BY ENERGY & UTILITY, 2025–2032 (USD MILLION)
TABLE 449
LATIN AMERICA: GENERATIVE AI MARKET, BY COUNTRY, 2020–2024 (USD MILLION)
TABLE 450
LATIN AMERICA: GENERATIVE AI MARKET, BY COUNTRY, 2025–2032 (USD MILLION)
TABLE 451
BRAZIL: GENERATIVE AI MARKET, BY OFFERING, 2020–2024 (USD MILLION)
TABLE 452
BRAZIL: GENERATIVE AI MARKET, BY OFFERING, 2025–2032 (USD MILLION)
TABLE 453
MEXICO: GENERATIVE AI MARKET, BY OFFERING, 2020–2024 (USD MILLION)
TABLE 454
MEXICO: GENERATIVE AI MARKET, BY OFFERING, 2025–2032 (USD MILLION)
TABLE 455
ARGENTINA: GENERATIVE AI MARKET, BY OFFERING, 2020–2024 (USD MILLION)
TABLE 456
ARGENTINA: GENERATIVE AI MARKET, BY OFFERING, 2025–2032 (USD MILLION)
TABLE 457
REST OF LATIN AMERICA: GENERATIVE AI MARKET, BY OFFERING, 2020–2024 (USD MILLION)
TABLE 458
REST OF LATIN AMERICA: GENERATIVE AI MARKET, BY OFFERING, 2025–2032 (USD MILLION)
TABLE 459
OVERVIEW OF STRATEGIES ADOPTED BY KEY GENERATIVE AI VENDORS, 2020–2024
TABLE 460
GENERATIVE AI MARKET: DEGREE OF COMPETITION
TABLE 461
GENERATIVE AI MARKET: REGION FOOTPRINT
TABLE 462
GENERATIVE AI MARKET: OFFERING FOOTPRINT
TABLE 463
GENERATIVE AI MARKET: DATA MODALITY FOOTPRINT
TABLE 464
GENERATIVE AI MARKET: END USER FOOTPRINT
TABLE 465
GENERATIVE AI MARKET: KEY STARTUPS/SMES
TABLE 466
GENERATIVE AI MARKET: COMPETITIVE BENCHMARKING OF STARTUPS/SMES
TABLE 467
GENERATIVE AI MARKET: PRODUCT LAUNCHES AND ENHANCEMENTS, JANUARY 2023–MAY 2025
TABLE 468
GENERATIVE AI MARKET: DEALS, JANUARY 2023–MAY 2025
TABLE 469
MICROSOFT: COMPANY OVERVIEW
TABLE 470
MICROSOFT: PRODUCTS OFFERED
TABLE 471
MICROSOFT: PRODUCT LAUNCHES AND ENHANCEMENTS
TABLE 472
MICROSOFT: DEALS
TABLE 473
AWS: COMPANY OVERVIEW
TABLE 474
AWS: PRODUCTS OFFERED
TABLE 475
AWS: PRODUCT LAUNCHES AND ENHANCEMENTS
TABLE 477
GOOGLE: COMPANY OVERVIEW
TABLE 478
GOOGLE: PRODUCTS OFFERED
TABLE 479
GOOGLE: PRODUCT LAUNCHES AND ENHANCEMENTS
TABLE 481
ADOBE: COMPANY OVERVIEW
TABLE 482
ADOBE: PRODUCTS OFFERED
TABLE 483
ADOBE: PRODUCT LAUNCHES AND ENHANCEMENTS
TABLE 485
OPENAI: COMPANY OVERVIEW
TABLE 486
OPENAI: PRODUCTS OFFERED
TABLE 487
OPENAI: PRODUCT LAUNCHES AND ENHANCEMENTS
TABLE 489
IBM: COMPANY OVERVIEW
TABLE 490
IBM: PRODUCTS OFFERED
TABLE 491
IBM: PRODUCT LAUNCHES AND ENHANCEMENTS
TABLE 493
META: COMPANY OVERVIEW
TABLE 494
META: PRODUCTS OFFERED
TABLE 495
META: PRODUCT LAUNCHES AND ENHANCEMENTS
TABLE 497
ANTHROPIC: COMPANY OVERVIEW
TABLE 498
ANTHROPIC: PRODUCTS OFFERED
TABLE 499
ANTHROPIC: PRODUCT LAUNCHES AND ENHANCEMENTS
TABLE 500
ANTHROPIC: DEALS
TABLE 501
NVIDIA: COMPANY OVERVIEW
TABLE 502
NVIDIA: PRODUCTS OFFERED
TABLE 503
NVIDIA: PRODUCT LAUNCHES AND ENHANCEMENTS
TABLE 505
ACCENTURE: COMPANY OVERVIEW
TABLE 506
ACCENTURE: PRODUCTS OFFERED
TABLE 507
ACCENTURE: DEALS
TABLE 508
CAPGEMINI: COMPANY OVERVIEW
TABLE 509
CAPGEMINI: PRODUCTS OFFERED
TABLE 510
CAPGEMINI: PRODUCT LAUNCHES AND ENHANCEMENTS
TABLE 511
CAPGEMINI: DEALS
TABLE 512
HPE: COMPANY OVERVIEW
TABLE 513
HPE: PRODUCTS OFFERED
TABLE 514
HPE: PRODUCT LAUNCHES AND ENHANCEMENTS
TABLE 516
AMD: COMPANY OVERVIEW
TABLE 517
AMD: PRODUCTS OFFERED
TABLE 518
AMD: PRODUCT LAUNCHES AND ENHANCEMENTS
TABLE 520
ORACLE: COMPANY OVERVIEW
TABLE 521
ORACLE: PRODUCTS OFFERED
TABLE 522
ORACLE: PRODUCT LAUNCHES AND ENHANCEMENTS
TABLE 524
SALESFORCE: COMPANY OVERVIEW
TABLE 525
SALESFORCE: PRODUCTS OFFERED
TABLE 526
SALESFORCE: PRODUCT LAUNCHES AND ENHANCEMENTS
TABLE 527
SALESFORCE: DEALS
TABLE 528
TELUS INTERNATIONAL: COMPANY OVERVIEW
TABLE 529
TELUS INTERNATIONAL: PRODUCTS OFFERED
TABLE 530
INNODATA: COMPANY OVERVIEW
TABLE 531
INNODATA: PRODUCTS OFFERED
TABLE 532
INNODATA: PRODUCT LAUNCHES AND ENHANCEMENTS
TABLE 533
CENTIFIC: COMPANY OVERVIEW
TABLE 534
CENTIFIC: PRODUCTS OFFERED
TABLE 535
CENTIFIC: PRODUCT LAUNCHES AND ENHANCEMENTS
TABLE 536
CENTIFIC: DEALS
TABLE 537
HQE SYSTEMS: COMPANY OVERVIEW
TABLE 538
HQE SYSTEMS: PRODUCTS OFFERED
TABLE 539
LARGE LANGUAGE MODEL MARKET, BY OFFERING, 2020–2023 (USD MILLION)
TABLE 540
LARGE LANGUAGE MODEL MARKET, BY OFFERING, 2024–2030 (USD MILLION)
TABLE 541
LARGE LANGUAGE MODEL MARKET, BY ARCHITECTURE, 2020–2023 (USD MILLION)
TABLE 542
LARGE LANGUAGE MODEL MARKET, BY ARCHITECTURE, 2024–2030 (USD MILLION)
TABLE 543
LARGE LANGUAGE MODEL MARKET, BY MODALITY, 2020–2023 (USD MILLION)
TABLE 544
LARGE LANGUAGE MODEL MARKET, BY MODALITY, 2024–2030 (USD MILLION)
TABLE 545
LARGE LANGUAGE MODEL MARKET, BY MODEL SIZE, 2020–2023 (USD MILLION)
TABLE 546
LARGE LANGUAGE MODEL MARKET, BY MODEL SIZE, 2024–2030 (USD MILLION)
TABLE 547
LARGE LANGUAGE MODEL MARKET, BY APPLICATION, 2020–2023 (USD MILLION)
TABLE 548
LARGE LANGUAGE MODEL MARKET, BY APPLICATION, 2024–2030 (USD MILLION)
TABLE 549
LARGE LANGUAGE MODEL MARKET, BY END USER, 2020–2023 (USD MILLION)
TABLE 550
LARGE LANGUAGE MODEL MARKET, BY END USER, 2024–2030 (USD MILLION)
TABLE 551
LARGE LANGUAGE MODEL MARKET, BY REGION, 2020–2023 (USD MILLION)
TABLE 552
LARGE LANGUAGE MODEL MARKET, BY REGION, 2024–2030 (USD MILLION)
TABLE 553
ARTIFICIAL INTELLIGENCE MARKET, BY OFFERING, 2020–2024 (USD BILLION)
TABLE 554
ARTIFICIAL INTELLIGENCE MARKET, BY OFFERING, 2025–2032 (USD BILLION)
TABLE 555
ARTIFICIAL INTELLIGENCE MARKET, BY TECHNOLOGY, 2020–2024 (USD BILLION)
TABLE 556
ARTIFICIAL INTELLIGENCE MARKET, BY TECHNOLOGY, 2025–2032 (USD BILLION)
TABLE 557
ARTIFICIAL INTELLIGENCE MARKET, BY BUSINESS FUNCTION, 2020–2024 (USD BILLION)
TABLE 558
ARTIFICIAL INTELLIGENCE MARKET, BY BUSINESS FUNCTION, 2025–2032 (USD BILLION)
TABLE 559
ARTIFICIAL INTELLIGENCE MARKET, BY ENTERPRISE APPLICATION, 2020–2024 (USD BILLION)
TABLE 560
ARTIFICIAL INTELLIGENCE MARKET, BY ENTERPRISE APPLICATION, 2025–2032 (USD BILLION)
TABLE 561
ARTIFICIAL INTELLIGENCE MARKET, BY END USER, 2020–2024 (USD BILLION)
TABLE 562
ARTIFICIAL INTELLIGENCE MARKET, BY END USER, 2025–2032 (USD BILLION)
TABLE 563
ARTIFICIAL INTELLIGENCE MARKET, BY REGION, 2020–2024 (USD BILLION)
TABLE 564
ARTIFICIAL INTELLIGENCE MARKET, BY REGION, 2025–2032 (USD BILLION)
FIGURE 1
GENERATIVE AI MARKET: RESEARCH DESIGN
FIGURE 2
DATA TRIANGULATION
FIGURE 3
GENERATIVE AI MARKET: TOP-DOWN AND BOTTOM-UP APPROACHES
FIGURE 4
MARKET SIZE ESTIMATION METHODOLOGY - APPROACH 1, BOTTOM-UP (SUPPLY-SIDE): REVENUE FROM SOFTWARE/INFRASTRUCTURE/SERVICES OF GENERATIVE AI MARKET
FIGURE 5
MARKET SIZE ESTIMATION METHODOLOGY - APPROACH 2, BOTTOM-UP (SUPPLY-SIDE): COLLECTIVE REVENUE FROM ALL SOFTWARE/INFRASTRUCTURE/SERVICES OF GENERATIVE AI MARKET
FIGURE 6
MARKET SIZE ESTIMATION METHODOLOGY - APPROACH 3, BOTTOM-UP (SUPPLY-SIDE): COLLECTIVE REVENUE FROM ALL SOFTWARE/INFRASTRUCTURE/ SERVICES OF GENERATIVE AI MARKET
FIGURE 7
MARKET SIZE ESTIMATION METHODOLOGY - APPROACH 4, BOTTOM-UP (DEMAND-SIDE): SHARE OF GENERATIVE AI THROUGH OVERALL IT SPENDING
FIGURE 8
GENERATIVE AI MARKET: RESEARCH LIMITATIONS
FIGURE 9
INFRASTRUCTURE SEGMENT TO ACCOUNT FOR LARGEST MARKET SIZE IN 2025
FIGURE 10
COMPUTE SEGMENT TO ACCOUNT FOR LARGEST MARKET SHARE IN 2025
FIGURE 11
GENERATIVE AI SAAS TO BE LARGEST SOFTWARE SEGMENT IN 2025
FIGURE 12
MODEL DEVELOPMENT & FINE-TUNING SERVICES SEGMENT TO ACCOUNT FOR LARGEST MARKET SHARE IN 2025
FIGURE 13
TEXT SEGMENT TO DOMINATE MARKET IN 2025
FIGURE 14
CONTENT MANAGEMENT SEGMENT TO LEAD MARKET IN 2025
FIGURE 15
ENTERPRISES SEGMENT TO DOMINATE MARKET IN 2025
FIGURE 16
HEALTHCARE & LIFE SCIENCES SEGMENT TO REGISTER HIGHEST GROWTH RATE DURING FORECAST PERIOD
FIGURE 17
ASIA PACIFIC TO REGISTER FASTEST GROWTH RATE BETWEEN 2024 AND 2030
FIGURE 18
INCREASING DEMAND FOR FOUNDATION MODELS AND IMPROVING PERFORMANCE OF GEN AI-POWERED SEARCH TO DRIVE MARKET
FIGURE 19
MULTIMODAL SEGMENT TO REGISTER HIGHEST GROWTH RATE DURING FORECAST PERIOD
FIGURE 20
INFRASTRUCTURE AND SOFTWARE & TECHNOLOGY PROVIDERS SEGMENTS TO ACCOUNT FOR LARGEST MARKET SHARES IN NORTH AMERICA IN 2025
FIGURE 21
NORTH AMERICA TO HOLD LARGEST MARKET SHARE IN 2025
FIGURE 22
GENERATIVE AI MARKET: DRIVERS, RESTRAINTS, OPPORTUNITIES, AND CHALLENGES
FIGURE 23
EVOLUTION OF GENERATIVE AI
FIGURE 24
GENERATIVE AI MATURITY CURVE
FIGURE 25
GENERATIVE AI MARKET: SUPPLY CHAIN ANALYSIS
FIGURE 26
KEY PLAYERS IN GENERATIVE AI MARKET ECOSYSTEM
FIGURE 27
GENERATIVE AI EQUITY FUNDING AND DEALS, 2020–2024
FIGURE 28
GENERATIVE AI EQUITY FUNDING, BY GEN AI STACK, 2020–2024
FIGURE 29
LARGEST FUNDING ROUNDS IN GENERATIVE AI, 2024 (USD BILLION)
FIGURE 30
LEADING AI STARTUPS, BY FUNDING VALUE (MILLION) AND FUNDING ROUND, UNTIL 2025
FIGURE 31
EXPORT OF PROCESSORS AND CONTROLLERS, BY KEY COUNTRY, 2017–2024 (USD BILLION)
FIGURE 32
IMPORT OF PROCESSORS AND CONTROLLERS, BY KEY COUNTRY, 2017–2024 (USD BILLION)
FIGURE 33
NUMBER OF PATENTS GRANTED IN LAST 10 YEARS, 2016–2025
FIGURE 34
REGIONAL ANALYSIS OF PATENTS GRANTED, 2016–2025
FIGURE 35
GENERATIVE AI MARKET: PORTER’S FIVE FORCES ANALYSIS
FIGURE 36
INFLUENCE OF STAKEHOLDERS ON BUYING PROCESS FOR TOP THREE ENTERPRISE END USERS
FIGURE 37
KEY BUYING CRITERIA FOR TOP THREE ENTERPRISE END USERS
FIGURE 38
TRENDS/DISRUPTIONS IMPACTING CUSTOMER BUSINESS
FIGURE 39
SERVICES SEGMENT TO REGISTER HIGHEST CAGR DURING FORECAST PERIOD
FIGURE 40
MULTIMODAL SEGMENT TO REGISTER HIGHEST CAGR DURING FORECAST PERIOD
FIGURE 41
SYNTHETIC DATA MANAGEMENT SEGMENT TO REGISTER HIGHEST CAGR DURING FORECAST PERIOD
FIGURE 42
ENTERPRISES SEGMENT TO REGISTER HIGHER CAGR THAN CONSUMERS SEGMENT DURING FORECAST PERIOD
FIGURE 43
HEALTHCARE & LIFE SCIENCES SEGMENT TO REGISTER HIGHEST CAGR DURING FORECAST PERIOD
FIGURE 44
ASIA PACIFIC TO REGISTER HIGHEST CAGR DURING FORECAST PERIOD
FIGURE 45
INDIA TO WITNESS HIGHEST GROWTH RATE IN GENERATIVE AI MARKET DURING FORECAST PERIOD
FIGURE 46
NORTH AMERICA: GENERATIVE AI MARKET SNAPSHOT
FIGURE 47
ASIA PACIFIC: GENERATIVE AI MARKET SNAPSHOT
FIGURE 48
GENERATIVE AI MARKET: REVENUE ANALYSIS OF FIVE KEY PLAYERS, 2020–2024
FIGURE 49
SHARE ANALYSIS OF LEADING COMPANIES IN GENERATIVE AI MARKET, 2024
FIGURE 50
PRODUCT COMPARATIVE ANALYSIS, BY TEXT GENERATOR
FIGURE 51
PRODUCT COMPARATIVE ANALYSIS, BY IMAGE GENERATOR
FIGURE 52
PRODUCT COMPARATIVE ANALYSIS, BY VIDEO GENERATOR
FIGURE 53
PRODUCT COMPARATIVE ANALYSIS, BY AUDIO & SPEECH GENERATOR
FIGURE 54
COMPANY VALUATION AND FINANCIAL METRICS OF KEY VENDORS
FIGURE 55
YEAR-TO-DATE (YTD) PRICE TOTAL RETURN AND 5-YEAR STOCK BETA OF KEY VENDORS
FIGURE 56
GENERATIVE AI MARKET: COMPANY EVALUATION MATRIX (KEY PLAYERS), 2024
FIGURE 57
GENERATIVE AI MARKET: COMPANY FOOTPRINT
FIGURE 58
GENERATIVE AI MARKET: COMPANY EVALUATION MATRIX (STARTUPS/SMES), 2024
FIGURE 59
MICROSOFT: COMPANY SNAPSHOT
FIGURE 60
AWS: COMPANY SNAPSHOT
FIGURE 61
GOOGLE: COMPANY SNAPSHOT
FIGURE 62
ADOBE: COMPANY SNAPSHOT
FIGURE 63
IBM: COMPANY SNAPSHOT
FIGURE 64
META: COMPANY SNAPSHOT
FIGURE 65
NVIDIA: COMPANY SNAPSHOT
FIGURE 66
ACCENTURE: COMPANY SNAPSHOT
FIGURE 67
CAPGEMINI: COMPANY SNAPSHOT
FIGURE 68
HPE: COMPANY SNAPSHOT
FIGURE 69
AMD: COMPANY SNAPSHOT
FIGURE 70
ORACLE: COMPANY SNAPSHOT
FIGURE 71
SALESFORCE: COMPANY SNAPSHOT
FIGURE 72
TELUS INTERNATIONAL: COMPANY SNAPSHOT
FIGURE 73
INNODATA: COMPANY SNAPSHOT


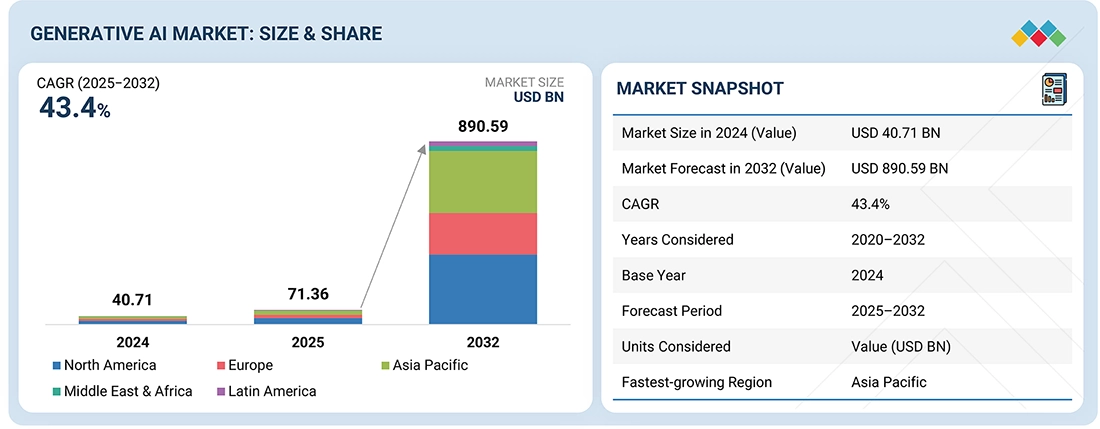
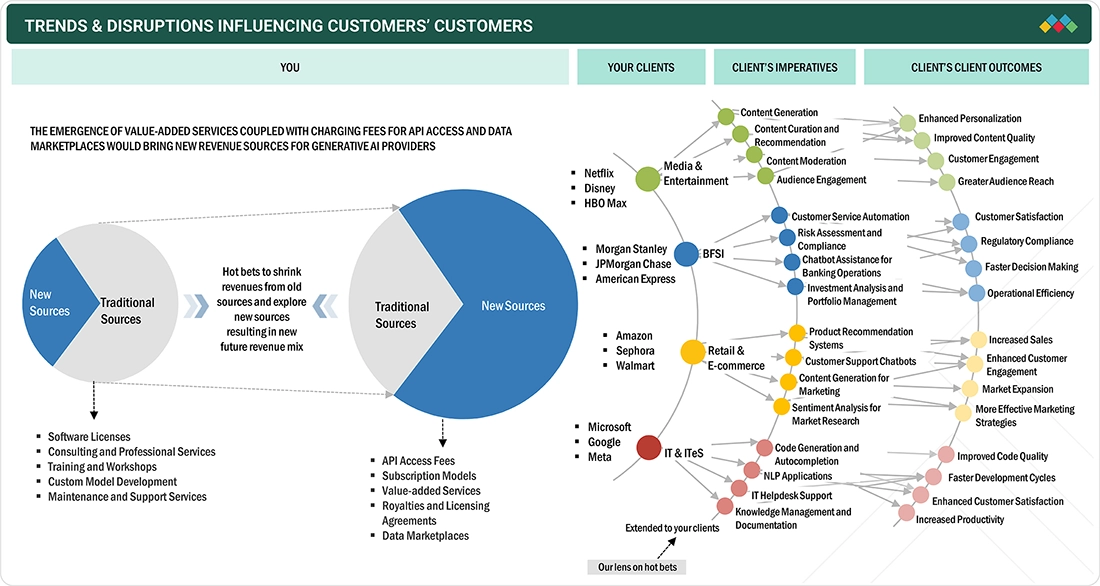


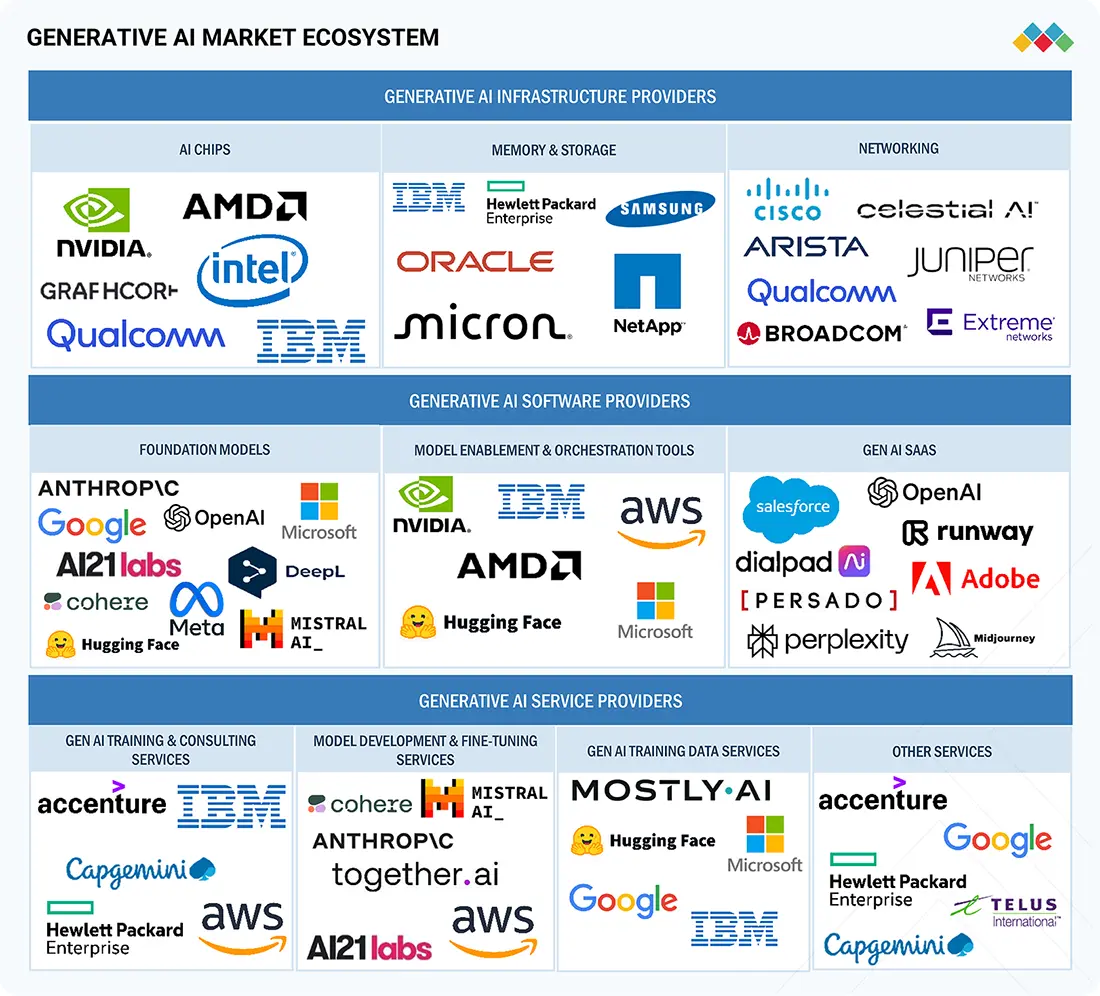
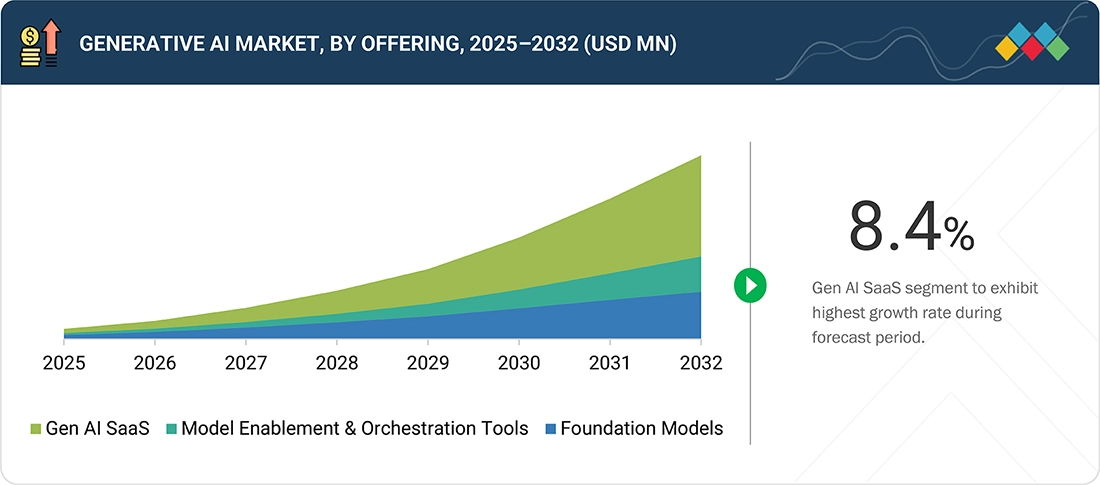
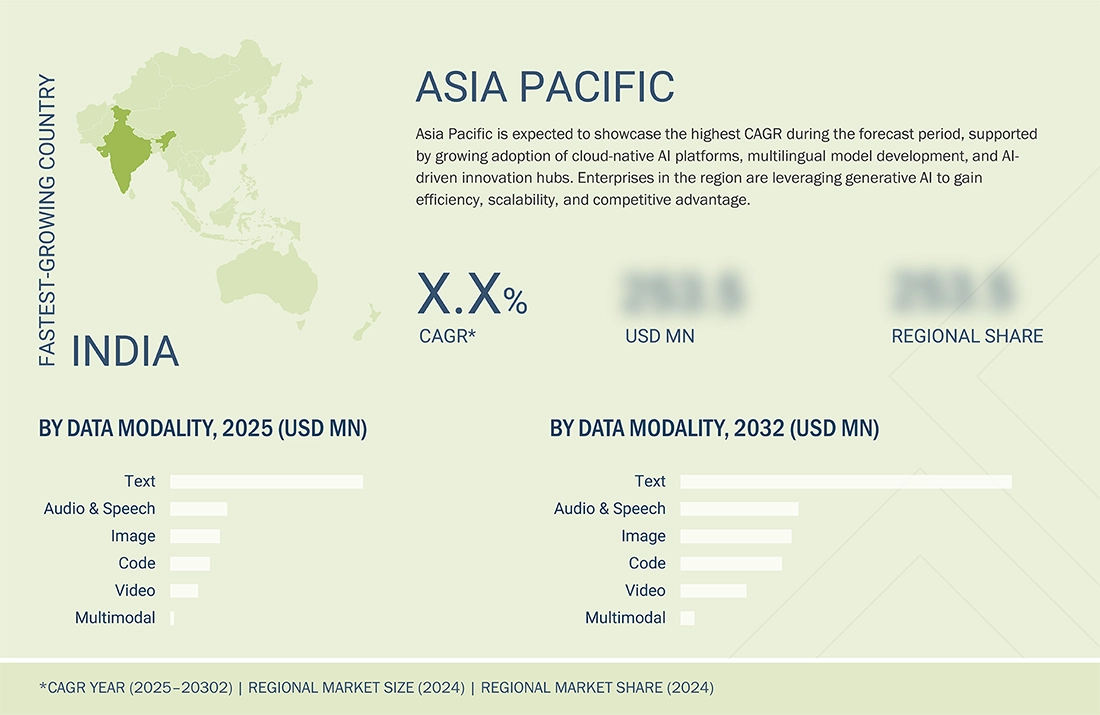
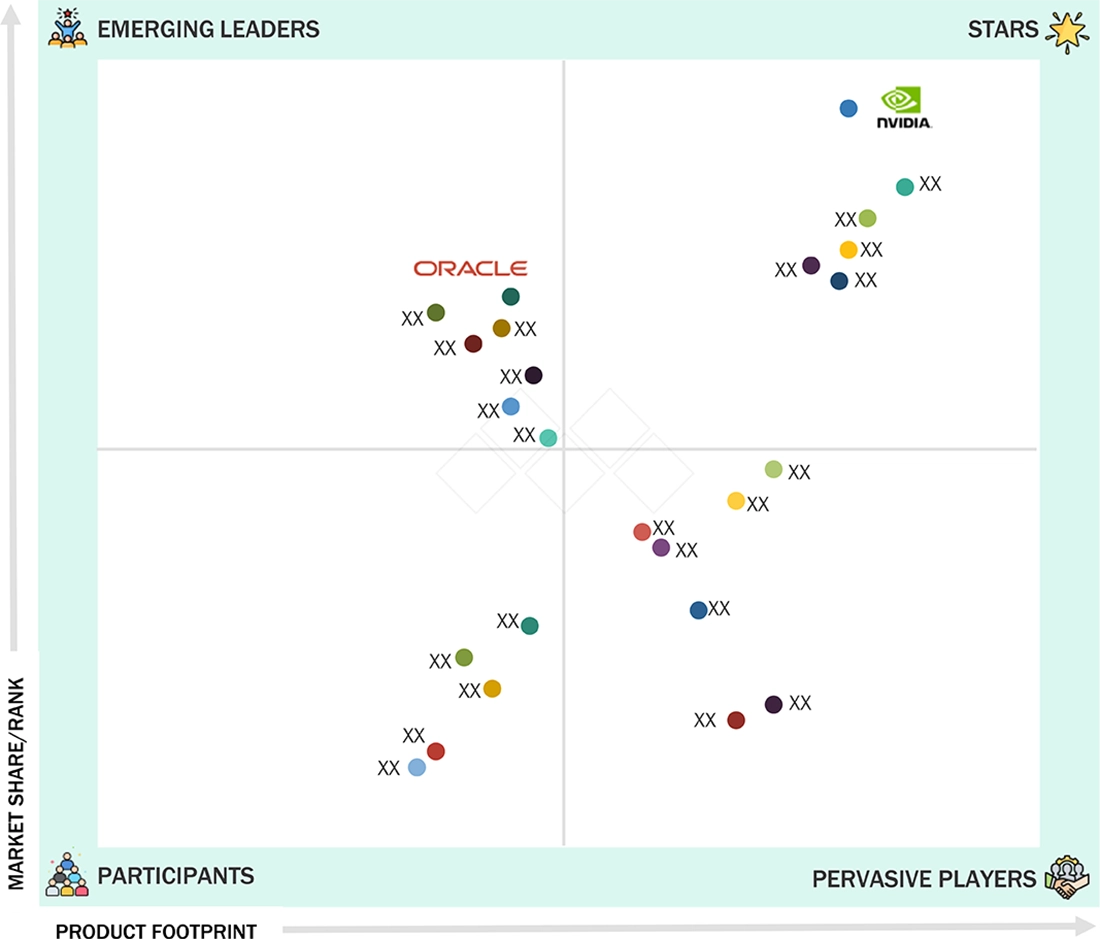
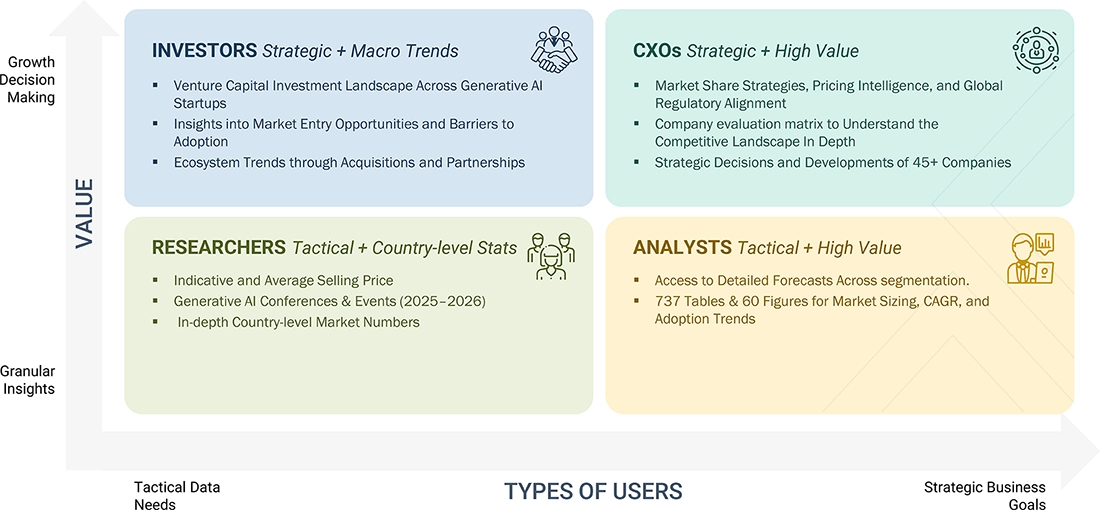
 Exclusive indicates content/data unique to MarketsandMarkets and not available with any competitors.


Caleb
Jul, 2026
How are data and AI technologies shaping the overall growth of the generative AI market?.
Luke
Jul, 2026
How important is AI risk management becoming within the generative AI market?.
Dennis
Jul, 2026
Interesting to see foundation models and AI-native infrastructure becoming major growth drivers. Are enterprises now prioritizing scalable AI platforms over building custom AI stacks internally?.
Harley
Jul, 2026
The report mentions increasing demand for GPUs, vector databases, and low-latency infrastructure. Are infrastructure and compute costs still one of the biggest barriers for enterprise-scale generative AI deployment?.