Grain Protectants Market by Control Method (Chemical (Insecticides, Fumigants, Rodenticides), Physical (Traps, Baits, Aeration, Heat Treatment), Biological), Target Pest (Insects, Rodents), Grain Type, and Region - Global Forecast to 2023


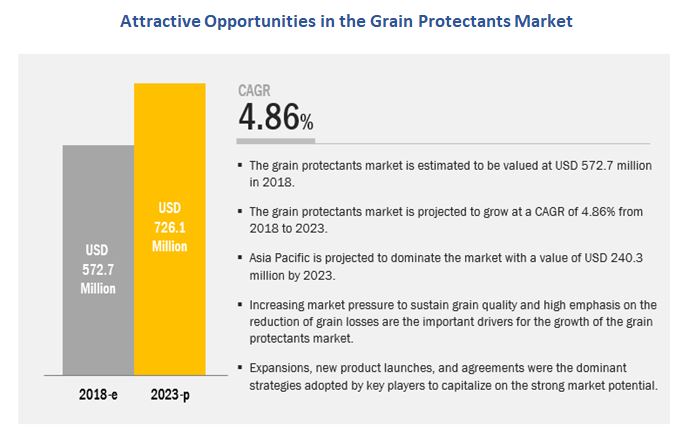
[146 Pages Report] The grain protectants market is estimated at USD 572.7 million in 2018 and is projected to reach USD 726.1 million by 2023, at a CAGR of 4.86%. Grain protectants offer several advantages such as security from pests for long-term storage and are also used to treat the entire grain transfer system. The global market is driven by the need to reduce grain losses during storage and the growing market pressure on farmers to gain better grain prices during the post-harvest stage. However, the increasing insect pest resistance to certain active substances and stringent regulations on maximum residue levels (MRLs) emphasize the need to develop new active substances that are effective and less hazardous to the environment and human health. Investment in R&D for the introduction of new products would be focused in the coming years due to the increasingly positive effects of some biologically sourced products such as INSECTO and Protect-It. These products contain diatomaceous earth (silicon dioxide) and are recognized as an essential component of Integrated Pest Management (IPM) for stored products.
As per a Lancaster University research report dated September 1998, grain spoilage is usually the cumulative result of several different handling and management operations and decisions. The report states that the overall chance of maintaining grain quality depends on the entire management program. Hence, just one or two methods applied individually may not provide the desired results when it comes to grain protection from pests or other damage.
The chemical segment accounted for the largest share among all control products in 2018. The large share of this segment is due to its effectiveness compared to other control methods such as physical and biological. Also, manufacturers in the grain protectants market offer a wide range of chemical-based compounds such as insecticides, rodenticides, and grain fumigants for their use in grain storage spaces to prevent pests such as insects, rodents, and fungal species.
On the basis of grain type, the grain protectants market is estimated to be dominated by the corn segment in 2018. This dominance is attributed to the increased preference for corn-based products for food, chemical, and fuel purposes, especially in developed countries such as the US. As a result, large amounts of corn grains are stored to meet the growing demand for these crops, from different industries.
In this report, the target pest market has been segmented into insects; rodents; and others; which include fungal species, mites, and birds. The insects segment is estimated to account for the largest share in 2018. This dominance can be attributed to the high amount of infestations and damages that occur in the storage spaces due to insects. Additionally, there are a wide variety of insects that infest different types of grains either by feeding on them or by making a cavity in them for habitation.
North America accounted for the largest share in the market in 2017, followed by Asia Pacific and Europe. The rising population and decreasing arable land have led to an increase in the demand for food security and food safety, globally. Additionally, the growing concerns of food grain damage and deterioration due to pest manifestations have led to the increased use of grain fumigation chemicals for food grains. Developing regions such as Asia Pacific and Africa lack the infrastructure needed for technological advancements and the awareness of efficient stored grain pest control methods.
Although a steady growth is projected for the next 5 years for the global market, increasing pest resistance is a restraining factor affecting the growth of the market. Due to stringent regulations pertaining to the use of chemicals in terms of health, environment, safety, and economic considerations, a very limited number of chemicals are available in the market for application on stored grains.
The global market for grain protectants is dominated by key players such as Bayer (Germany), Sumitomo Chemical (Japan), BASF (Germany), Nufarm (Australia), UPL (India), and DowDuPont (US). These players adopted growth strategies such as expansions and new product launches to gain a larger share of the grain protectants market. Some other key players in the market are Syngenta (Switzerland), FMC Corporation (US), Degesch America (US), Arysta LifeScience Corporation (US), Central Life Sciences (US), and Hedley Technologies (Canada).
To speak to our analyst for a discussion on the above findings, click Speak to Analyst
 Exclusive indicates content/data unique to MarketsandMarkets and not available with any competitors.
Table of Contents
1 Introduction (Page No. - 15)
1.1 Objectives of the Study
1.2 Market Definition
1.3 Study Scope
1.4 Regional Segmentation
1.5 Periodization Considered
1.6 Currency Considered
1.7 Unit Considered
1.8 Stakeholders
2 Research Methodology (Page No. - 20)
2.1 Research Data
2.1.1 Secondary Data
2.1.1.1 Key Data From Secondary Sources
2.1.2 Primary Data
2.1.2.1 Key Industry Insights
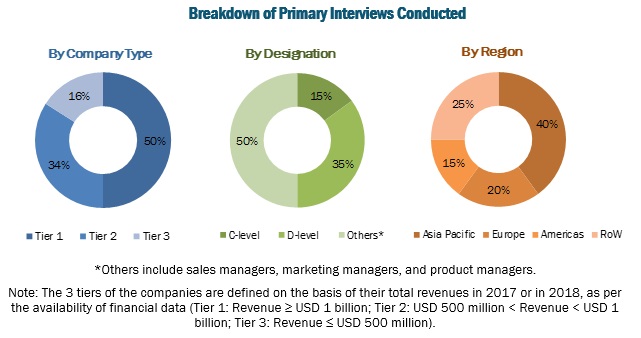
2.1.2.2 Breakdown of Primary Interviews
2.2 Market Size Estimation
2.3 Data Triangulation
2.4 Research Assumptions
2.5 Limitations
3 Executive Summary (Page No. - 29)
4 Premium Insights (Page No. - 34)
4.1 Attractive Opportunities in the Global Market
4.2 Grain Protectants Market Share, By Grain Type
4.3 Asia Pacific: Grain Protectants Market, By Target Insect & Country
4.4 Market For Grain Protectants, By Control Method & Region
4.5 Grain Protectants Market Share, By Key Country
5 Market Overview (Page No. - 39)
5.1 Introduction
5.2 Macroeconomic Indicators
5.2.1 Growing Food Production to Meet the Increasing Global Demand
5.3 Market Dynamics
5.3.1 Drivers
5.3.1.1 to Sustain Market Pressure for Better Price Range During the Post-Harvest Stage
5.3.1.2 to Reduce Grain Losses
5.3.2 Restraints
5.3.2.1 Insect Pest Resistance
5.3.3 Opportunities
5.3.3.1 Development of New Products to Replace Banned Products
5.3.3.2 Increased Future Prospects for Ipm Systems for Stored Grains
5.3.4 Challenges
5.3.4.1 Reducing Residues in Chemical-Based Protectants
5.3.4.2 Low Adoption Rate and Inefficient Post-Harvest Practices
5.4 Regulatory Framework
5.4.1 Introduction
5.4.2 Us
5.4.3 Canada
5.4.4 European Union
5.4.5 Uk
5.4.6 Australia
6 Grain Protectants Market, By Control Method (Page No. - 49)
6.1 Introduction
6.2 Chemical
6.2.1 Insecticides
6.2.1.1 Pyrethroids
6.2.1.1.1 Pyrethroids Segment Held the Largest Market Share for Insecticide-Based Grain Protectants
6.2.1.2 Organophosphates
6.2.1.2.1 Organophosphates Segment Still Gained Significant Market Demand in Developing Economies Due to Its Cheaper Cost
6.2.1.3 Insect Growth Regulators (IGRS)
6.2.1.3.1 IGRS are Projected to Grow at the Highest CAGR as an Effective Solution to Combat Insect Pest Resistance
6.2.2 Fumigants
6.2.2.1 Fumigants are Likely to Grow at the Second-Fastest Growing Segment for Its Effective Control in Stored Grains
6.2.3 Rodenticides
6.2.3.1 Anticoagulating Agents are Normally Used to Control Rodents
6.3 Physical
6.3.1 Physical Control Methods has Been Gaining High Preference With Respect to Ipm Approaches in Warehouses
6.4 Biological
6.4.1 Biological Control are Expected to Witness Significant Adoption for Its Less Or No Residual Impact on Grains
7 Grain Protectants Market, By Target Pest (Page No. - 58)
7.1 Introduction
7.2 Insects
7.2.1 Grain Borers
7.2.1.1 Grain Borers are Considered as the Major Storage Pests in Asian Countries
7.2.2 Weevils
7.2.2.1 Grain Protectants is Projected to Highly Sought for Weevil-Based Damage Issues in Rice Crops
7.2.3 Beetles
7.2.3.1 Beetles are the Highly Targeted Pest Across the World for Grain Protection
7.2.4 Moths
7.2.4.1 Moths has Become A Ubiquitous Pest for Grain Storage Across the World
7.3 Rodents
7.3.1 Rats
7.3.1.1 Rats are Known to Create A Lot of Nuisance in the Stored Food Products, Especially Grains
7.3.2 Squirrels
7.3.2.1 Squirrels Tend to Feed on Grains, Which Emphasizes the Need for Effective Storage Design and Bait Placements
7.4 Others
8 Grain Protectants Market, By Grain Type (Page No. - 65)
8.1 Introduction
8.2 Corn
8.2.1 Corn Segment is Projected to Grow at the Highest CAGR During the Forecast Period
8.3 Wheat
8.3.1 Wheat Storage Protection Practices has Been Significantly Adopted in the European Countries
8.4 Rice
8.4.1 Rice Not Only A Widely Preferred Grain in Asia But Also Holds the Highest Post-Harvest Loss Ratio
8.5 Others
9 Grain Protectants Market, By Region (Page No. - 71)
9.1 Introduction
9.2 North America
9.2.1 US
9.2.1.1 US Accounted for the Largest Market Size in Grain Protectant Market in North America
9.2.2 Canada
9.2.2.1 Canada is Expected to Witness the Highest Growth Rate in the Grain Protectant Market in North America
9.2.3 Mexico
9.2.3.1 Demand for Grain Protectants in Mexico is Expected to Drive Growth of the Overall Market
9.3 Europe
9.3.1 France
9.3.1.1 France Accounted A One of the Largest Adopters of Grain Protectants Among European Countries
9.3.2 Germany
9.3.2.1 Germany is Projected to Grow at the Highest CAGR During the Forecast Period
9.3.3 Spain
9.3.3.1 Significant Market Demand Expected for Crops Such as Wheat, Corn, and Barley in Spain
9.3.4 Poland
9.3.4.1 Significant Demand for Grain Protectants Expected for Wheat Crops in Poland
9.3.5 UK
9.3.5.1 Increasing Need to Imported Grain Quality in Storages Would Drive the Market Demand in the Uk
9.3.6 Rest of Europe
9.4 Asia Pacific
9.4.1 China
9.4.1.1 Being the Largest Producer of Grain, China is Likely to Be an Important High-Growth Market
9.4.2 India
9.4.2.1 India is Likely to Witness the Fastest Growth in the Coming Years
9.4.3 Japan
9.4.3.1 Rising Imports of Corn is Likely to Drive the Market for Grain Protectants to Maintain Stock Quality
9.4.4 Australia
9.4.4.1 Fumigation is the Preferred Method for Its Residue-Free Control of Pests in Grains
9.4.5 Rest of Asia Pacific
9.5 South America
9.5.1 Brazil
9.5.2 Argentina
9.5.3 Rest of South America
9.6 Rest of the World (RoW)
9.6.1 Middle East
9.6.2 Africa
10 Competitive Landscapes (Page No. - 103)
10.1 Overview
10.2 Company Share Analysis
10.2.1 Grain Protectant Manufacturers
10.3 Competitive Scenario
10.3.1 Expansions
10.3.2 New Product Launches
10.3.3 Mergers & Acquisitions
10.3.4 Agreements, Collaborations, and Partnerships
11 Company Profiles (Page No. - 110)
(Business Overview, Products Offered, Recent Developments, SWOT Analysis, MnM View)*
11.1 Dowdupont
11.2 BASF
11.3 Bayer
11.4 Syngenta
11.5 Sumitomo Chemical
11.6 FMC Corporation
11.7 Nufarm
11.8 UPL
11.9 Degesch America, Inc.
11.10 Arysta Lifescience Corporation
11.11 Central Life Sciences
11.12 Hedley Technologies Ltd. (Biosyent Inc.)
*Details on Business Overview, Products Offered, Recent Developments, SWOT Analysis, MnM View Might Not Be Captured in Case of Unlisted Companies.
12 Appendix (Page No. - 139)
12.1 Discussion Guide
12.2 Knowledge Store: Marketsandmarkets� Subscription Portal
12.3 Available Customizations
12.4 Related Reports
12.5 Author Details
List of Tables (65 Tables)
Table 1 USD Exchange Rate, 2014�2017
Table 2 Market Size for Grain Protectants, By Control Method, 2016�2023 (USD Million)
Table 3 Chemical: Grain Protectants Market Size, By Type, 2016�2023 (USD Million)
Table 4 Chemical: Market Size, By Type, 2016�2023 (KT)
Table 5 Chemical: Market Size, By Region, 2016�2023 (USD Million)
Table 6 Insecticides: Grain Protectants Market Size, By Type, 2016�2023 (USD Million)
Table 7 Fumigants: Market Size, By Active Ingredient, 2016�2023 (USD Million)
Table 8 Physical: Market Size for Grain Protectants, By Type, 2016�2023 (USD Million)
Table 9 Physical: Market Size, By Region, 2016�2023 (USD Million)
Table 10 Biological: Grain Protectants Market Size, By Type, 2016�2023 (USD Million)
Table 11 Biological: Market Size, By Region, 2016�2023 (USD Million)
Table 12 Market Size for Grain Protectants, By Target Pest, 2016�2023 (USD Million)
Table 13 Insects: Grain Protectant Market Size, By Region, 2016�2023 (USD Million)
Table 14 Insects: Market Size, By Type, 2016�2023 (USD Million)
Table 15 Rodents: Grain Protectants Market Size, By Region, 2016�2023 (USD Million)
Table 16 Others: Market Size, By Region, 2016�2023 (USD Million)
Table 17 Market Size for Grain Protectants, By Grain Type, 2016�2023 (USD Million)
Table 18 Corn: Market Size for Grain Protectants, By Region, 2016�2023 (USD Million)
Table 19 Wheat: Market Size, By Region, 2016�2023 (USD Million)
Table 20 Rice: Market Size for Grain Protectants, By Region, 2016�2023 (USD Million)
Table 21 Others: Market Size for Grain Protectants, By Region, 2016�2023 (USD Million)
Table 22 Market Size for Grain Protectants, By Region, 2016�2023 (USD Million)
Table 23 North America: Grain Protectants Market Size, By Country, 2016�2023 (USD Million)
Table 24 North America: Market Size, By Grain Type, 2016�2023 (USD Million)
Table 25 North America: Market Size, By Target Pest, 2016�2023 (USD Million)
Table 26 North America: Market Size, By Control Method, 2016�2023 (USD Million)
Table 27 US: Grain Protectants Market Size, By Grain Type, 2016�2023 (USD Million)
Table 28 Canada: Market Size for Grain Protectants, By Grain Type, 2016�2023 (USD Million)
Table 29 Mexico:Market Size for Grain Protectants, By Grain Type, 2016�2023 (USD Million)
Table 30 Europe: Grain Protectants Market Size, By Country, 2016�2023 (USD Million)
Table 31 Europe: Market Size, By Grain Type, 2016�2023 (USD Million)
Table 32 Europe: Market Size, By Target Pest, 2016�2023 (USD Million)
Table 33 Europe: Market Size, By Control Method, 2016�2023 (USD Million)
Table 34 France: Grain Protectants Market Size, By Grain Type, 2016�2023 (USD Million)
Table 35 Germany: Market Size for Grain Protectants, By Grain Type, 2016�2023 (USD Million)
Table 36 Spain: Market Size for Grain Protectants, By Grain Type, 2016�2023 (USD Million)
Table 37 Poland: Market Size for Grain Protectants, By Grain Type, 2016�2023 (USD Million)
Table 38 UK: Grain Protectants Market Size, By Grain Type, 2016�2023 (USD Million)
Table 39 Rest of Europe: Market Size for Grain Protectants, By Grain Type, 2016�2023 (USD Million)
Table 40 Asia Pacific: Grain Protectants Market Size, By Country, 2016�2023 (USD Million)
Table 41 Asia Pacific:Market Size, By Grain Type, 2016�2023 (USD Million)
Table 42 Asia Pacific: Market Size, By Target Pest, 2016�2023 (USD Million)
Table 43 Asia Pacific: Market Size, By Control Method, 2016�2023 (USD Million)
Table 44 China: Grain Protectants Market Size, By Grain Type, 2016�2023 (USD Million)
Table 45 India: Market Size for Grain Protectants, By Grain Type, 2016�2023 (USD Million)
Table 46 Japan: Market Size for Grain Protectants, By Grain Type, 2016�2023 (USD Million)
Table 47 Australia: Grain Protectants Market Size, By Grain Type, 2016�2023 (USD Million)
Table 48 Rest of Asia Pacific: Market Size for Grain Protectants, By Grain Type, 2016�2023 (USD Million)
Table 49 South America: Grain Protectants Market Size, By Country, 2016�2023 (USD Million)
Table 50 South America: Market Size, By Grain Type, 2016�2023 (USD Million)
Table 51 South America: Market Size, By Target Pest, 2016�2023 (USD Million)
Table 52 South America: Market Size, By Control Method, 2016�2023 (USD Million)
Table 53 Brazil: Market Size for Grain Protectants, By Grain Type, 2016�2023 (USD Million)
Table 54 Argentina: Grain Protectants Market Size, By Grain Type, 2016�2023 (USD Million)
Table 55 Rest of South America: Grain Protectants Market Size, By Grain Type, 2016�2023 (USD Million)
Table 56 RoW: Grain Protectants Market Size, By Region, 2016�2023 (USD Million)
Table 57 RoW: Market Size, By Grain Type, 2016�2023 (USD Million)
Table 58 RoW: Market Size, By Target Pest, 2016�2023 (USD Million)
Table 59 RoW: Market Size, By Control Method, 2016�2023 (USD Million)
Table 60 Middle East: Grain Protectants Market Size, By Grain Type, 2016�2023 (USD Million)
Table 61 Africa: Market Size for Grain Protectants, By Grain Type, 2016�2023 (USD Million)
Table 62 Expansions, 2013�2018
Table 63 New Product Launches, 2016�2018
Table 64 Mergers & Acquisitions, 2015�2018
Table 65 Agreements, Collaborations, and Partnerships, 2014�2017
List of Figures (42 Figures)
Figure 1 Market Segmentation
Figure 2 Research Design
Figure 3 Breakdown of Primary Interviews: By Company Type, Designation, and Region
Figure 4 Market Size Estimation Methodology: Bottom-Up Approach
Figure 5 Market Size Estimation Methodology: Top-Down Approach
Figure 6 Data Triangulation Methodology
Figure 7 Market Size for Grain Protectants, By Target Pest, 2018 vs 2023
Figure 8 Market Share for Grain Protectants, By Control Method, 2018
Figure 9 Market Size for Grain Protectants, By Grain Type, 2018 vs 2023
Figure 10 Regional Snapshot
Figure 11 Higher Grain Losses During Storage to Drive the Market Growth
Figure 12 Grain Protectants Were Applied at the Highest Rate on Corn in 2017
Figure 13 Stored Grains Were Majorly Damaged By Insects in Asia Pacific in 2017
Figure 14 Chemical Control Dominated the Global Market in 2017
Figure 15 US and China Were Important Markets for Grain Protectants in 2017
Figure 16 Global Wheat Consumption Grew By 25% From the Period 2001/02 to 2016/17
Figure 17 Grain Protectants Market: Drivers, Restraints, Opportunities, and Challenges
Figure 18 Mean Estimates of Post-Harvest Losses (Phl) of Grains in Ghana (% of Total Production)
Figure 19 Market Size for Grain Protectants, By Control Method, 2018 vs 2023 (USD Million)
Figure 20 Market Size for Grain Protectants, By Target Pest, 2018 vs 2023 (USD Million)
Figure 21 Market Size for Grain Protectants, By Grain Type, 2018 vs 2023 (USD Million)
Figure 22 Grain Protectants Market is Projected to Witness Signifcant Growth in the Americas
Figure 23 North America: Market Snapshot
Figure 24 Asia Pacific: Market Snapshot
Figure 25 Key Developments By Leading Players in the Grain Protectants Market, 2013�2018
Figure 26 Company Share Analysis: Grain Protectants Market, 2017
Figure 27 Dowdupont: Company Snapshot
Figure 28 Dowdupont: SWOT Analysis
Figure 29 BASF: Company Snapshot
Figure 30 BASF: SWOT Analysis
Figure 31 Bayer: Company Snapshot
Figure 32 Bayer: SWOT Analysis
Figure 33 Syngenta: Company Snapshot
Figure 34 Syngenta: SWOT Analysis
Figure 35 Sumitomo Chemical: Company Snapshot
Figure 36 Sumitomo Chemical: SWOT Analysis
Figure 37 FMC Corporation: Company Snapshot
Figure 38 FMC Corporation: SWOT Analysis
Figure 39 Nufarm: Company Snapshot
Figure 40 UPL: Company Snapshot
Figure 41 Arysta Lifescience: Company Snapshot
Figure 42 Biosyent Inc. : Company Snapshot
The grain protectants market was valued at USD 549.0 million in 2017 and is projected to reach USD 726.1 million by 2023, at a CAGR of 4.86% during the forecast period.
The years considered for the study are as follows:
- Base year � 2017
- Beginning of the forecast period � 2018
- End of the forecast period � 2023
Objectives of the report:
- Determining and projecting the size of the market with respect to grain type, control method, target pest, and regional markets, over a five-year period ranging from 2018 to 2023
- Identifying attractive opportunities in the market by determining the largest and fastest-growing segments across regions
- Analyzing the demand-side factors on the basis of the impact of macro- and micro-economic factors on the market and shifts in demand patterns across different subsegments and regions
- Recognizing key drivers and restraints impacting the global market
Research Methodology:
- The key players have been identified through extensive secondary research. In the secondary research process, various sources such as the FAO (Food and Agriculture Organization), Environmental Protection Agency (EPA), Pest Management Regulatory Agency (PMRA), and Grains Research & Development GRDC (Australia); and databases such as Bloomberg Businessweek and Factiva were referred.
- All percentage shares, splits, and breakdowns have been determined using secondary sources and verified through primary sources
- The research included the study of the reports, reviews, and newsletters of top market players along with extensive interviews for opinions from leaders such as CEOs, directors, and marketing executives.
- All possible parameters that affect the markets covered in this research study have been accounted for, viewed in extensive detail, verified through primary research, and analyzed to obtain the final quantitative and qualitative data
To know about the assumptions considered for the study, download the pdf brochure
The various contributors involved in the value chain of the grain protectants market include raw material suppliers; R&D institutes; grain protectant manufacturing companies such as Bayer (Germany), Sumitomo Chemical (Japan), Nufarm (Australia), BASF (Germany); and government bodies & regulatory associations such as the US Environmental Protection Agency (US EPA), World Health Organization (WHO), Grains Research and Development Corporation (GRDC), Food and Agriculture Organization (FAO), and Pest Management Regulatory Agency (PMRA).
Target Audience:
The stakeholders for the report are as follows:
- Grain protection (crop protection) manufacturers
- Grain fumigants and grain storage chemicals and service providers
- Pest control, pesticide, and warehouse associations and industry bodies
- Public and commercial research institutions/agencies/laboratories, and food processing companies
- Government regulatory authorities and agricultural research organizations
- Crop farmer associations and cooperative societies
Scope of the Report
This research report categorizes the market based on control method, target pest, grain type, and region.
Based on control method, the market has been segmented as follows:
- Chemical
- Insecticides
- Fumigants
- Rodenticides
- Physical
- Traps & baits
- Aeration
- Heat treatment
- Biological
- Microbials
- Botanicals
Based on target pest, the market has been segmented as follows:
- Insects
- Grain borers
- Weevils
- Beetles
- Moths
- Rodents
- Others (Fungal species, mites, and birds)
Based on grain type, the market has been segmented as follows:
- Corn
- Wheat
- Rice
- Others (sorghum, millets, barley, and oats)
Based on region, the market has been segmented as follows:
- North America
- Asia Pacific
- Europe
- South America
- RoW (the Middle East and Africa)
Available Customizations
With the given market data, MarketsandMarkets offers customizations according to company-specific scientific needs.
The following customization options are available for the report:
Product Analysis:
- Product Matrix, which gives a detailed comparison of the product portfolio of each company
Geographic Analysis:
- Further breakdown of the Rest of European market for grain protectants into Italy, Hungary, and Ukraine.
- Further breakdown of the Rest of Asia Pacific market for grain protectants into Thailand, Vietnam, Malaysia, and South Korea.
- Further breakdown of the Rest of South American market for grain protectants into Peru and Paraguay.
Company Information:
- Detailed analysis and profiling of additional market players (up to 5)


Growth opportunities and latent adjacency in Grain Protectants Market