Grid-Scale Battery Market by Type (Lithium-Ion, Lead Acid, Flow Battery, Sodium-Based), Ownership-Model (Third-Party, Utility), Application (Renewable Integration, Peak Shift, Ancillary Services, Back-Up Power), and Region - Global Forecast to 2023


[139 Pages Report] The global grid-scale battery market was valued at USD 0.87 Billion in 2017 and is expected to reach USD 5.82 Billion by 2023, at a CAGR of 33.52% between 2018 and 2023. Major factors driving the growth of the market include the increasing investments in renewable energy, reducing costs of grid-scale battery owing to technological advancements and expanded deployment. The market has been segmented on the basis of type, ownership-model, application, and region.
The years considered for the study are as follows:
- Base Year: 2017 (Whenever information for the base year was unavailable, the prior year has been considered.)
- Estimated Year: 2018
- Projected Year: 2023
- Forecast Period: 2018�2023
Objectives of the Study
- To define, describe, and forecast the grid-scale battery market by type, ownership-model, application, and region
- To provide detailed information regarding the major factors influencing the growth of the market (drivers, restraints, opportunities, and industry-specific challenges)
- To strategically analyze the grid-scales battery market with respect to individual growth trends, future projections, and contribution of each segment to the market
- To track and analyze competitive developments such as contracts and agreements, product launches, expansions and investments, and partnerships and collaborations in the market
- To profile key players and comprehensively analyze their market ranking and core competencies
Research Methodology
This research study involves the use of extensive secondary sources, directories, and databases, such as D&B, Bloomberg Businessweek, and Factiva, to identify and collect information useful for a technical, market-oriented, and commercial study of the market. Primary sources are mainly industry experts from core and related industries, preferred suppliers, manufacturers, distributors, service providers, technology developers, standards and certification organizations of companies, and organizations related to all segments of this industry�s value chain. The following points explain the research methodology followed in making this report.
- Study of annual revenues and market developments of major players in the market
- Assessment of future trends and growth of applications
- Assessment of the market with respect to the type of technologies used for different applications
- Study of contracts and developments carried out by market players in different regions
- Finalization of the overall market size by triangulating supply-side data, which comprises product developments, supply chain, and annual revenues of companies supplying grid-scale batteries worldwide
After arriving at the overall grid-scale battery market size, the total market has been split into several segments and subsegments. The following figure illustrates the breakdown of primaries, based on company type, designation, and region, conducted during the research study.
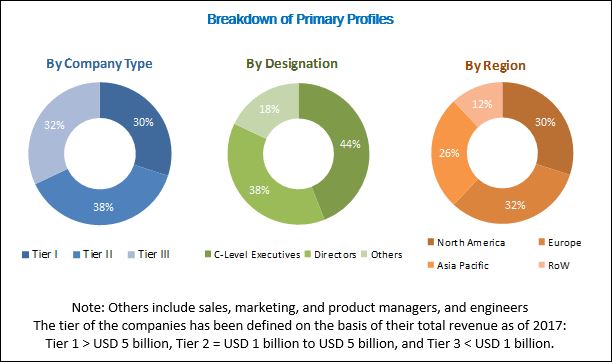
To know about the assumptions considered for the study, download the pdf brochure
Some of the leading manufacturers and providers of grid-scale battery market are LG Chem (South Korea), Samsung (South Korea), Panasonic (Japan), Fluence (US), Tesla (US), BYD Company (China), ABB (Switzerland), GE (US), GS Yuasa (Japan), Toshiba (Japan), Saft (France), S&C Electric (US), and NGK Insulators (Japan).
Target Audience:
The report�s target audience includes:
- Transmission and distribution utilities
- State and national regulatory authorities
- Power generation utilities
- Consulting companies and associations in the energy and power sector
- Government and research organizations
- Grid-scale battery manufacturers
- Investment banks
- Engineering, procurement, and construction companies in the distribution sector
Scope of the Report:
Grid-Scale Battery Market:
-
By Type
- Lithium-Ion
- Lead Acid
- Flow
- Sodium Based
- Others
-
By Ownership-Model
- Third-Party Owned
- Utility Owned
-
By Application
- Renewable Integration
- Peak Shift
- Ancillary Services
- Back-Up Power
- Others
-
By Region
- North America
- Europe
- Asia Pacific
- RoW
Available Customizations:
With the given market data, MarketsandMarkets offers customizations as per the client�s specific needs. The following customization options are available for the report:
Regional Analysis
- Further breakdown of region/country-specific analysis
Company Information
- Detailed analyses and profiling of additional market players (up to 5)
The global grid-scale battery market is expected to be valued at USD 1.37 Billion in 2018 and is likely to grow at a CAGR of 33.52% during the forecast period to reach USD 5.82 Billion by 2023. The growth of this market can be attributed to the increasing investments in renewable energy, reducing costs of grid-scale batteries owing to technological advancements and expanded deployment, and government subsidies and regulations for enhancing energy efficiency.
In this report, the grid-scale battery market has been segmented on the basis of type into lithium-ion, lead acid, flow, sodium-based and other batteries. The other batteries include nickel-cadmium, nickel metal-hydride, and nickel-iron batteries. Lithium-ion batteries are expected to hold the largest share of the market throughout the forecast period. These batteries have high energy and power density, which allows them to be lightweight with less standby losses and high life expectancy of 5�15 years with 98% efficiency. In addition, these batteries are lighter in weight than nickel-cadmium and nickel metal-hydride batteries.
The market has also been segmented on the basis of ownership-model into utility owned and third-party owned segments. The market for the third-party owned segment is likely to grow at the highest rate between 2018 and 2023. North America, Europe, and RoW have widely adopted the third-party owned model as it boosts overall grid stability. In addition, third-party owned systems receive incentives from various governments.
Based on application, the grid-scale battery market has been segmented into renewable integration, peak shifting, ancillary services, back-up power, and others (including microgrids, ramping, black start, and transmission/distribution upgrade deferral). Factors such as attainment of renewable targets and energy efficiency; increased reliability, security and resiliency from microgrid applications are expected to drive the growth of the market for renewable integration during the forecast period.
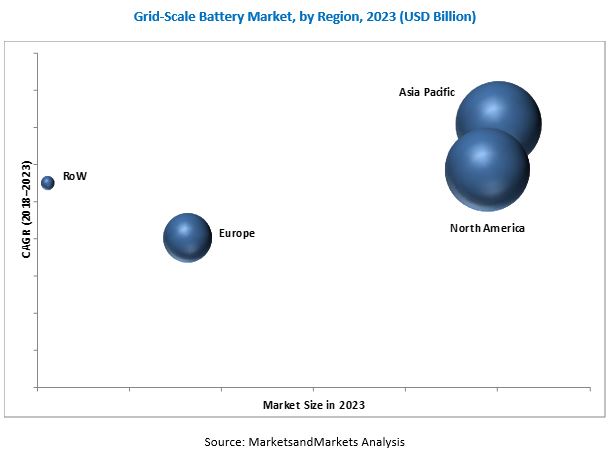
The market has been segmented on the basis of region into North America, Europe, Asia Pacific, and RoW. North America dominates the market. The growth of the market in North America can be attributed to the increasing demand for renewable energy storage in the residential, non-residential, and utility sectors.
The major factors restraining the growth of the grid-scale battery market include hazardous environmental effects and high capital investments. The market is fragmented and offers opportunities for consolidation.
In this market, most players are global multinational companies. Some of the leading players in the grid-scale battery market are LG Chem (South Korea), Samsung (South Korea), Panasonic (Japan), Fluence (US), Tesla (US), BYD Company (China), ABB (Switzerland), GE (US), GS Yuasa (Japan), Toshiba (Japan), Saft (France), S&C Electric (US), and NGK Insulators (Japan). These players have adopted growth strategies such as product launches, contracts and agreements, and expansions to capture a larger share of the market.
To speak to our analyst for a discussion on the above findings, click Speak to Analyst
 Exclusive indicates content/data unique to MarketsandMarkets and not available with any competitors.
Table of Contents
1 Introduction (Page No. - 14)
1.1 Objectives of the Study
1.2 Definition
1.3 Market Scope
1.3.1 Markets Covered
1.3.2 Years Considered for the Study
1.4 Currency
1.5 Stakeholders
2 Research Methodology (Page No. - 18)
2.1 Introduction
2.2 Research Data
2.2.1 Secondary Data
2.2.2 Primary Data
2.2.2.1 Key Data From Primary Sources
2.2.2.2 Key Industry Insights
2.2.2.3 Breakdown of Primary Interviews
2.3 Market Size Estimation
2.4 Market Breakdown & Data Triangulation
2.5 Research Assumptions
3 Executive Summary (Page No. - 26)
4 Premium Insights (Page No. - 30)
4.1 Attractive Opportunities in the Grid-Scale Battery Market During the Forecast Period
4.2 Industrial Control Transformer Market, By Country
4.3 Asia Pacific Market, By Type & Country
4.4 Market, By Type
4.5 Market, By Ownership Model
4.6 Market, By Application
5 Market Overview (Page No. - 35)
5.1 Introduction
5.2 Market Dynamics
5.3 Drivers
5.3.1 Increasing Renewable Energy Investments
5.3.2 Reduction in Cost Owing to Technological Advancements and Expanded Deployment
5.3.3 Government Subsidies and Regulations for Enhancing Energy Efficiency
5.4 Restraints
5.4.1 Hazardous Environmental Effects
5.4.2 High Capital Investments
5.5 Opportunities
5.5.1 Increasing Focus on Rural Electrification
5.5.2 Development of Molten-Salt Battery Technology
5.6 Challenges
5.6.1 Installation of Grid-Scale Battery in Remote Locations
6 Grid-Scale Battery, By Battery Type (Page No. - 40)
6.1 Introduction
6.2 Lithium-Ion
6.3 Lead Acid
6.4 Flow Battery
6.5 Sodium-Based Battery
6.6 Others
6.6.1 Nickel�Cadmium Battery
6.6.2 Nickel Metal Hydride Battery
6.6.3 Nickel�Iron Battery
7 Grid-Scale Battery, By Ownership Model (Page No. - 47)
7.1 Introduction
7.2 Third-Party-Owned
7.3 Utility-Owned
8 Grid-Scale Battery, By Application (Page No. - 53)
8.1 Introduction
8.2 Peak Shifting
8.3 Renewable Integration
8.4 Ancillary Services
8.5 Backup Power
8.6 Others
9 Grid-Scale Battery, By Region (Page No. - 59)
9.1 Introduction
9.2 North America
9.2.1 By Type
9.2.2 By Ownership Model
9.2.3 By Application
9.2.4 By Country
9.2.4.1 US
9.2.4.2 Canada
9.3 Asia Pacific
9.3.1 By Type
9.3.2 By Ownership Model
9.3.3 By Application
9.3.4 By Country
9.3.4.1 China
9.3.4.2 Australia
9.3.4.3 India
9.3.4.4 Japan
9.3.4.5 South Korea
9.3.4.6 Rest of Asia Pacific
9.4 Europe
9.4.1 By Type
9.4.2 By Ownership Model
9.4.3 By Appliaction
9.4.4 By Country
9.4.4.1 Germany
9.4.4.2 UK
9.4.4.3 France
9.4.4.4 Italy
9.4.4.5 Rest of Europe
9.5 Rest of the World
9.5.1 By Type
9.5.2 By Ownership Model
9.5.3 By Appliaction
9.5.4 By Region
9.5.4.1 Middle East
9.5.4.2 Africa
9.5.4.3 Latin America
10 Competitive Landscape (Page No. - 92)
10.1 Introduction
10.2 Ranking of Players & Industry Concentration, 2017
10.3 Competitive Scenario
10.3.1 Contract & Agreement
10.3.2 New Product Launch
10.3.3 Investment & Expansion
10.3.4 Joint Venture/Divestment/Merger & Acquisition/Partnership & Collaboration/ Strategic Alliance
11 Company Profiles (Page No. - 99)
(Business Overview, Products Offered, Recent Developments, SWOT Analysis, MnM View)*
11.1 Benchmarking
11.2 LG Chem, Ltd.
11.3 Samsung Sdi Co., Ltd.
11.4 Panasonic Corporation
11.5 Fluence Energy, LLC
11.6 Tesla
11.7 BYD Company Limited
11.8 ABB
11.9 General Electric (GE)
11.10 GS Yuasa Corporation
11.11 Toshiba
11.12 Saft Groupe S.A.
11.13 S&C Electric Company
11.14 NGK Insulators
*Details on Business Overview, Products Offered, Recent Developments, SWOT Analysis, MnM View Might Not Be Captured in Case of Unlisted Companies.
12 Appendix (Page No. - 131)
12.1 Insights From Industry Experts
12.2 Discussion Guide
12.3 Knowledge Store: Marketsandmarkets� Subscription Portal
12.4 Introducing RT: Real-Time Market Intelligence
12.5 Available Customizations
12.6 Related Reports
12.7 Author Details
List of Tables (73 Tables)
Table 1 Grid-Scale Battery Market Snapshot
Table 2 Capital, Operational, and Charging Costs for Grid-Scales Battery Market
Table 3 Comparison Between Lithium-Ion and Lead-Acid Batteries
Table 4 Market Size, By Type, 2016�2023 (USD Million)
Table 5 Lithium-Ion: Market, By Region, 2016�2023 (USD Million)
Table 6 Lead Acid: Grid-Scale Battery Market, By Region, 2016�2023 (USD Million)
Table 7 Flow Battery: Market, By Region, 2016�2023 (USD Million)
Table 8 Sodium-Based Battery: Market, By Region, 2016�2023 (USD Million)
Table 9 Others: Market, By Region, 2016�2023 (USD Million)
Table 10 Market, By Ownership Model, 2016�2023 (USD Million)
Table 11 Third-Party-Owned: Market, By Region, 2016�2023 (USD Million)
Table 12 Projects Based on Grid-Scale Battery Systems
Table 13 Utility-Owned: Market, By Region, 2016�2023 (USD Million)
Table 14 Market, By Application, 2016�2023 (USD Million)
Table 15 Peak Shifting: Grid-Scale Battery Market, By Region, 2016�2023 (USD Million)
Table 16 Renewable Integration: Market, By Region, 2016�2023 (USD Million)
Table 17 Ancillary Services: Market, By Region, 2016�2023 (USD Million)
Table 18 Back-Up Power: Market, By Region, 2016�2023 (USD Million)
Table 19 Others: Grid-Scale Battery Market, By Region, 2016�2023 (USD Million)
Table 20 Market Size, By Region, 2016�2023 (USD Million)
Table 21 Market Size, By Region, 2016�2023 (Mw)
Table 22 North America: Market, By Battery Type, 2016�2023 (USD Million)
Table 23 North America: Market, By Battery Type, 2016�2023 (Mw)
Table 24 North America: Market, By Ownership Model, 2016�2023 (USD Million)
Table 25 North America: Market, By Ownership Model, 2016�2023 (Mw)
Table 26 North America: Market Size, By Application, 2016�2023 (USD Million)
Table 27 North America: Market, By Country, 2016�2023 (USD Million)
Table 28 North America: Market, By Country, 2016�2023 (Mw)
Table 29 Events for Market in the US
Table 30 US: Grid-Scale Battery Market, By Battery Type, 2016�2023 (USD Million)
Table 31 Canada: Market, By Battery Type, 2016�2023 (USD Million)
Table 32 Asia Pacific: Market, By Battery Type, 2016�2023 (USD Million)
Table 33 Asia Pacific: Market, By Battery Type, 2016�2023 (Mw)
Table 34 Asia Pacific: Market, By Ownership Model, 2016�2023 (USD Million)
Table 35 Asia Pacific: Market, By Ownership Model, 2016�2023 (Mw)
Table 36 Asia Pacific: Market Size, By Application, 2016�2023 (USD Million)
Table 37 Asia Pacific: Market, By Country, 2016�2023 (USD Million)
Table 38 Asia Pacific: Market, By Country, 2016�2023 (Mw)
Table 39 China: Market Size, By Type, 2016�2023 (USD Million)
Table 40 Australia: Market Size, By Type, 2016�2023 (USD Million)
Table 41 India: Market Size, By Type, 2016�2023 (USD Million)
Table 42 Japan: Market Size, By Type, 2016�2023 (USD Million)
Table 43 South Korea: Market Size, By Type, 2016�2023 (USD Million)
Table 44 Rest of Asia Pacific: Market Size, By Type, 2016�2023 (USD Million)
Table 45 Europe: Grid-Scale Battery Market, By Battery Type, 2016�2023 (USD Million)
Table 46 Europe: Market, By Battery Type, 2016�2023 (Mw)
Table 47 Europe: Market, By Ownership Model, 2016�2023 (USD Million)
Table 48 Europe: Market, By Ownership Model, 2016�2023 (Mw)
Table 49 Europe: Market Size, By Application, 2016�2023 (USD Million)
Table 50 Europe: Market, By Country, 2016�2023 (USD Million)
Table 51 Europe: Market, By Country, 2016�2023 (Mw)
Table 52 Germany: Market Size, By Type, 2016�2023 (USD Million)
Table 53 Grid-Scale Battery Events in the UK
Table 54 UK: Grid-Scale Battery Market Size, By Type, 2016�2023 (USD Million)
Table 55 France: Market Size, By Type, 2016�2023 (USD Million)
Table 56 Italy: Market Size, By Type, 2016�2023 (USD Million)
Table 57 RoE: Market Size, By Type, 2016�2023 (USD Million)
Table 58 Upcoming Events Related to Market System in the RoW
Table 59 RoW: Market, By Battery Type, 2016�2023 (USD Million)
Table 60 RoW: Market, By Battery Type, 2016�2023 (Mw)
Table 61 RoW: Market, By Ownership Model, 2016�2023 (USD Million)
Table 62 RoW: Market, By Ownership Model, 2016�2023 (Mw)
Table 63 RoW: Market Size, By Application, 2016�2023 (USD Million)
Table 64 RoW: Market, By Region, 2016�2023 (USD Million)
Table 65 RoW: Market, By Region, 2016�2023 (Mw)
Table 66 Middle East: Grid-Scale Battery Market Size, By Type, 2016�2023 (USD Million)
Table 67 Africa: Market Size, By Type, 2016�2023 (USD Million)
Table 68 Latin America: Grid-Scale Battery Market Size, By Type, 2016�2023 (USD Million)
Table 69 ABB, the Most Active Player in the Market Between 2015 and May 2018
Table 70 Contracts & Agreements, 2015�May 2018
Table 71 New Product Launches, 2015�February 2018
Table 72 Investments and Expansions, 2015�February 2018
Table 73 Joint Ventures/Divestments/Mergers & Acquisitions/Partnerships & Collaborations/Strategic Alliances, 2015�February 2018
List of Figures (39 Figures)
Figure 1 Grid-Scale Battery Market Segmentation
Figure 2 Regional Scope: Grid-Scale Battery
Figure 3 Grid-Scale Battery Industry: Research Design
Figure 4 Breakdown of Primary Interviews: By Company Type, Designation, & Region
Figure 5 Market Size Estimation Methodology: Bottom-Up Approach
Figure 6 Market Size Estimation Methodology: Top-Down Approach
Figure 7 Data Triangulation Methodology
Figure 8 Asia Pacific Was Expected to Dominate the Grid-Scales Battery Market in 2017
Figure 9 Lithium-Ion Segment is Expected to Grow at the Highest CAGR During the Forecast Period
Figure 10 Third-Party-Owned Segment is Expected to Lead the Grid-Scales Battery Market During the Forecast Period
Figure 11 Renewable Integration Segment is Expected to Grow at the Highest CAGR During the Forecast Period
Figure 12 Increasing Renewable Energy Investments are Driving the Grid-Scales Battery Market, From 2018 to 2023
Figure 13 The Market in India is Expected to Grow at the Highest CAGR During the Forecast Period
Figure 14 Lithium-Ion Segment and South Korea Dominated the Grid-Scales Battery Market in Asia Pacific
Figure 15 Lithium-Ion Segment is Expected to Dominate the Grid-Scale Battery Market During the Forecast Period
Figure 16 Third-Party-Owned Segment Dominated the Grid-Scale Battery Market, By Ownership Model, in 2017
Figure 17 Renewable Integration Segment Dominated the Grid-Scales Battery Market, By Application, in 2017
Figure 18 Drivers, Restraints, Opportunities, & Challenges of the Grid-Scale Battery Market
Figure 19 Investment in Renewable Energy Sources, 2004�2016 (USD Billion)
Figure 20 Lithium-Ion Segment Dominated the Grid-Scales Battery Market in 2017
Figure 21 Third-Party-Owned Segment Dominated the Grid-Scales Battery Market in 2017
Figure 22 Number of Projects By RT o/Iso and Type of Ownership
Figure 23 Renewable Integration Segment is Expected to Lead the Grid-Scales Battery Market During the Forecast Period
Figure 24 Asia Pacific is Expected to Grow at the Highest CAGR During the Forecast Period
Figure 25 North America LED the Grid-Scales Battery Market in 2017, By Value
Figure 26 North America: Grid-Scales Battery Market Snapshot
Figure 27 Asia Pacific: Grid-Scales Battery Market Snapshot
Figure 28 Contracts & Agreements is the Most Widely Adopted Development Strategy Between 2015 and May 2018
Figure 29 Samsung LED the Grid-ScalesBattery Market in 2017
Figure 30 LG Chem: Company Snapshot
Figure 31 Samsung: Company Snapshot
Figure 32 Panasonic: Company Snapshot
Figure 33 Tesla: Company Snapshot
Figure 34 BYD Company: Company Snapshot
Figure 35 ABB: Company Snapshot
Figure 36 GE: Company Snapshot
Figure 37 GS Yuasa: Company Snapshot
Figure 38 Toshiba: Company Snapshot
Figure 39 NGK Insulators: Company Snapshot


Growth opportunities and latent adjacency in Grid-Scale Battery Market