This study involved four major activities in estimating the current size of the high-speed engine market. Exhaustive secondary research was done to collect information on the market, peer market, and parent market. The next step was to validate these findings, assumptions, and market sizing with industry experts across the value chain through primary research. Both top-down and bottom-up approaches were used to estimate the total market size. After that, the market breakdown and data triangulation were done to estimate the market size of the segments and sub-segments.
Secondary Research
This research study involved extensive secondary sources, directories, and databases, such as Hoover’s, Bloomberg BusinessWeek, Factiva, Magazine and OneSource, to identify and collect information useful for a technical, market-oriented, and commercial study of the global high-speed engine market. The other secondary sources included annual reports, press releases & investor presentations of companies, white papers, certified publications, articles by recognized authors, manufacturer associations, trade directories, and databases.
Primary Research
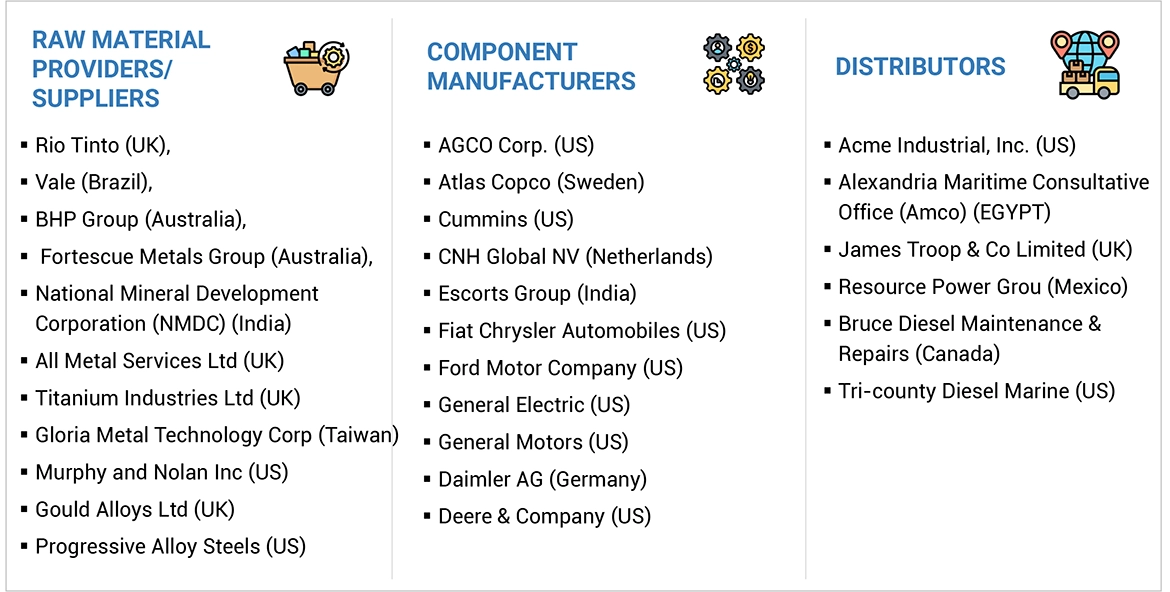
The high-speed engine market comprises several stakeholders, such as end-product manufacturers, service providers, and end-users in the supply chain. This market's demand side is characterized by its end-users, such as power generation, marine, railway, mining and oil & gas, construction and others. The supply-side is characterized by high-speed engine manufacturers and others. Various primary sources from both the supply and demand sides of the market were interviewed to obtain qualitative and quantitative information. The breakdown of primary respondents is given below:
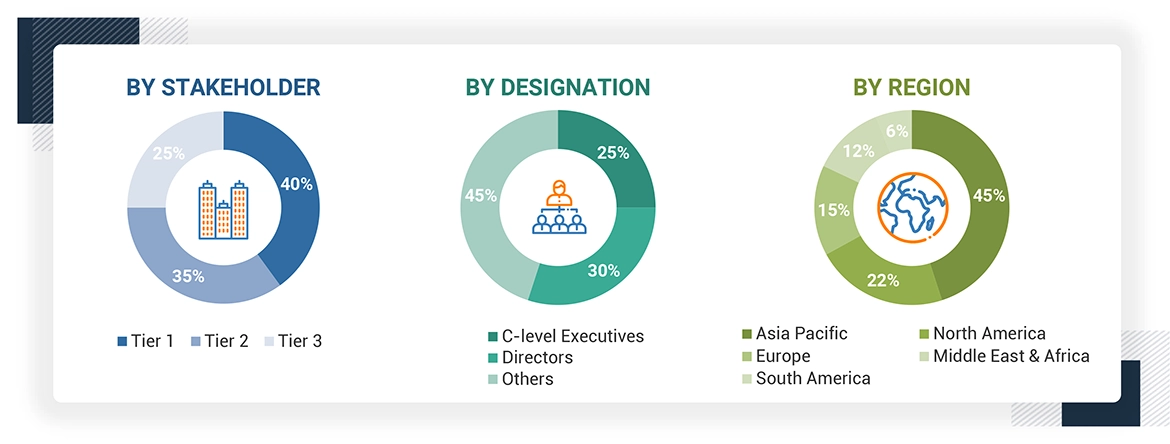
Note: “Others” include sales managers, engineers, and regional managers
The tiers of the companies are defined based on their total revenue as of 2021: Tier 1: >USD 1 billion, Tier 2: USD 500 million–1 billion, and Tier 3: < USD 500 million
To know about the assumptions considered for the study, download the pdf brochure
Market Size Estimation
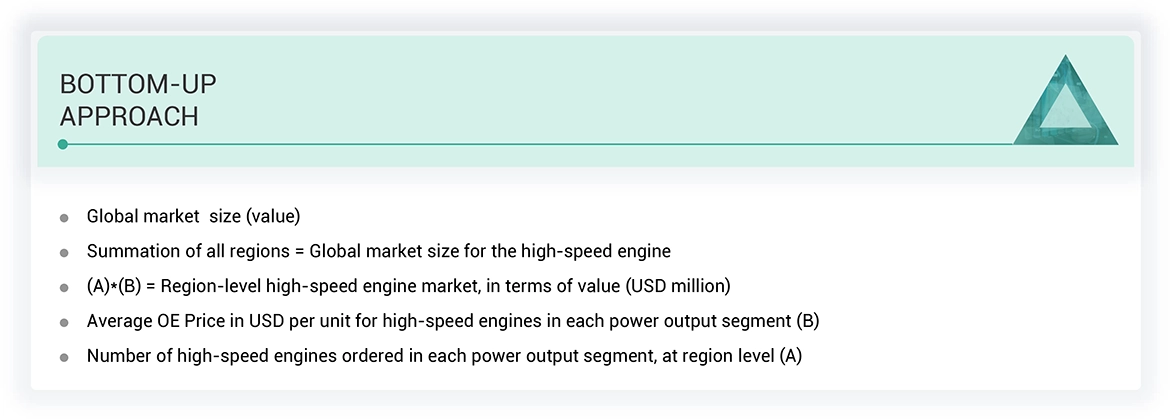
Both top-down and bottom-up approaches have been used to estimate and validate the size of the global high-speed engine market and its dependent submarkets. These methods were also used extensively to estimate the size of various sub-segments in the market. The research methodology used to estimate the market size includes the following:
-
The industry and market's key players have been identified through extensive secondary research, and their market share in the respective regions has been determined through both primary and secondary research.
-
In terms of value, the industry’s supply chain and market size have been determined through primary and secondary research processes.
-
All percentage shares, splits, and breakdowns have been determined using secondary sources and verified through primary sources.
Data Triangulation
After arriving at the overall market size—using the market size estimation processes as explained above—the market was split into several segments and subsegments. To complete the overall market engineering process and arrive at the exact statistics of each market segment and subsegment, data triangulation, and market breakdown procedures were employed, wherever applicable. The data was triangulated by studying various factors and trends from both the demand and supply sides.
Report Objectives
-
To define, describe, segment, and forecast the high-speed engine market by speed, power output, end user, and region, in terms of value and volume.
-
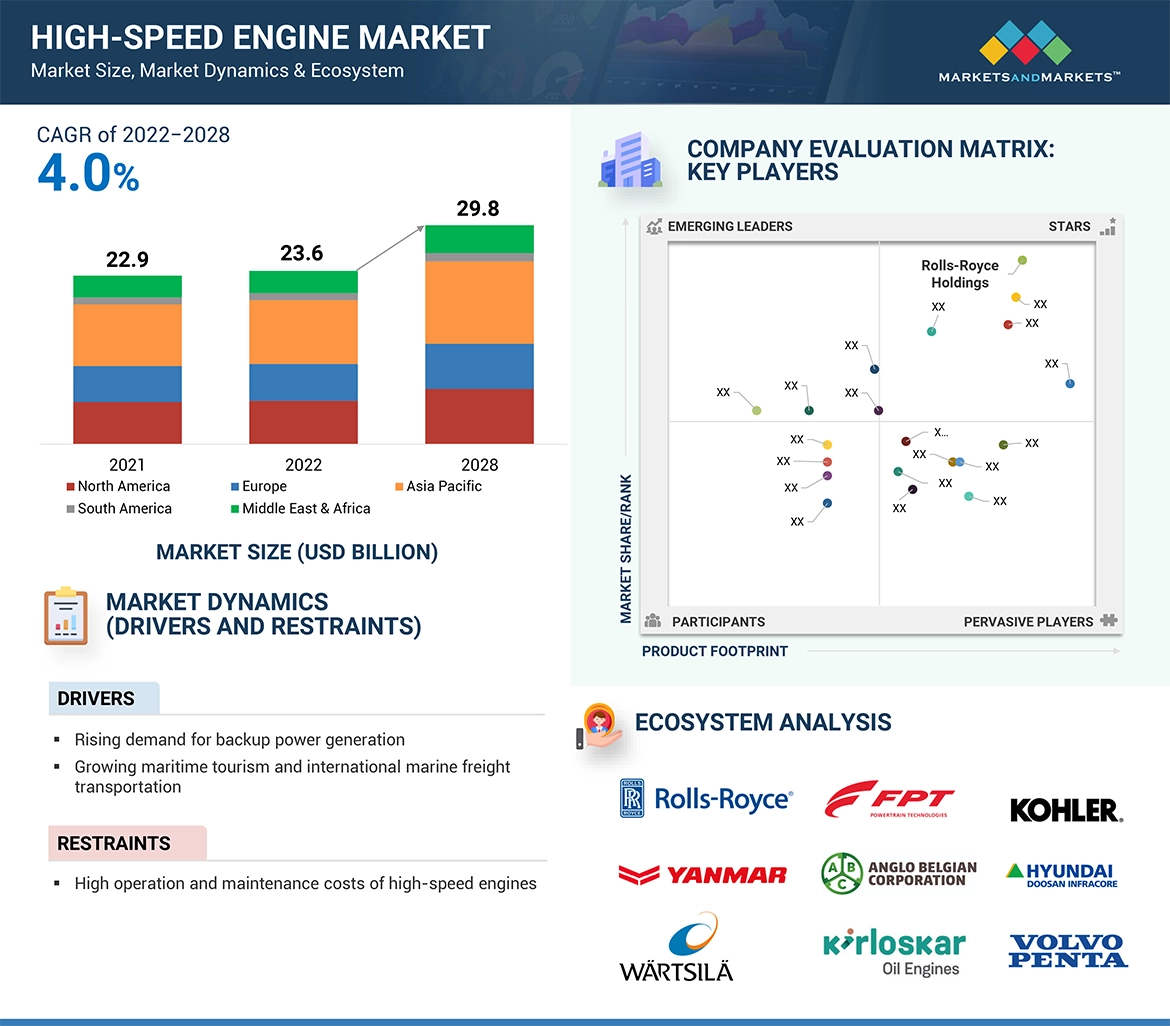
To provide comprehensive information about the drivers, restraints, opportunities, and industry-specific challenges that affect the market growth
-
To strategically analyze the global high-speed engine market with respect to individual growth trends, future expansions, and each segment's contribution to the market.
-
To analyze market opportunities for stakeholders and details of the competitive landscape for market leaders.
-
To forecast the growth of the global high-speed engine market with respect to the main regions (Asia Pacific, North America, Europe, Middle East & Africa, and South America).
-
To profile and rank key players and comprehensively analyze their market share.
-
To analyze competitive developments such as contracts & agreements, product launches, and mergers & acquisitions in the high-speed engine market.
-
This report covers the global high-speed engine market size in terms of value and volume.

 HIGHEST CAGR MARKET IN 2023
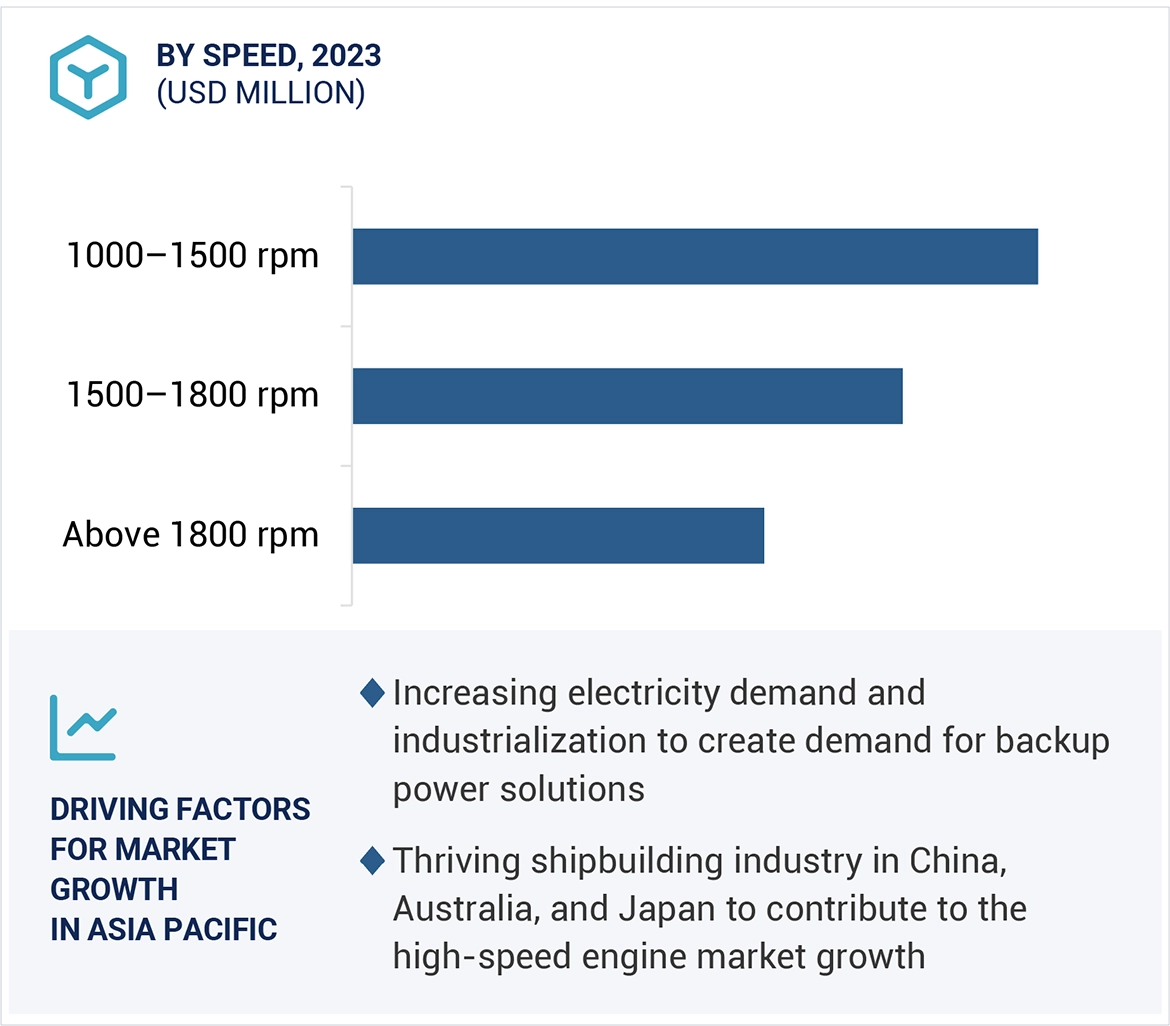


Growth opportunities and latent adjacency in High-Speed Engine Market